Interactive visualisations with


Jesús Martínez Blanco
Principal Data Scientist
@

DISCLAIMER
- There is no way to master D3 after a day workshop.
- This course is intended to provide an overview on D3 so that:
- you develop a feeling of what is possible,
- you can further investigate these techniques,
- you know what's under the hood when using all the other higher level visualization tools.
- you get a basic taste of web technologies (JS, CSS, HTML).
- Stop me when I am too basic or too advanced. I am here to learn too!
DAY 1 OUTLOOK
- History and scope
- WEB document and the D.O.M.
- Javascript basics
- D3 selections
- SVG vs CANVAS
- Loading and Binding Data
- Mouse events (interactivity)
- Transitions (animations)
Exercise
History
- Early 1990's: First browsers, static pages limited to clicks and page scrolls.
- 1995: JavaScript to the rescue (introduced by Netscape): client-side scripting.
-
2000's: predecessors of D3.js:
- 2005: Prefuse: required a Java plug-in to render viz in the browser
- 2007: Flare: required a Flash plug-in to render viz in the browser
- 2009: Protovis: JavaScript library (from Stanford) to generate SVG graphics from data
- 2011: Publication of D3.js by the devs of Protovis to focus on web standards and improve performance.
- 2016: Split the library into many mini-libraries.
Seeding paper
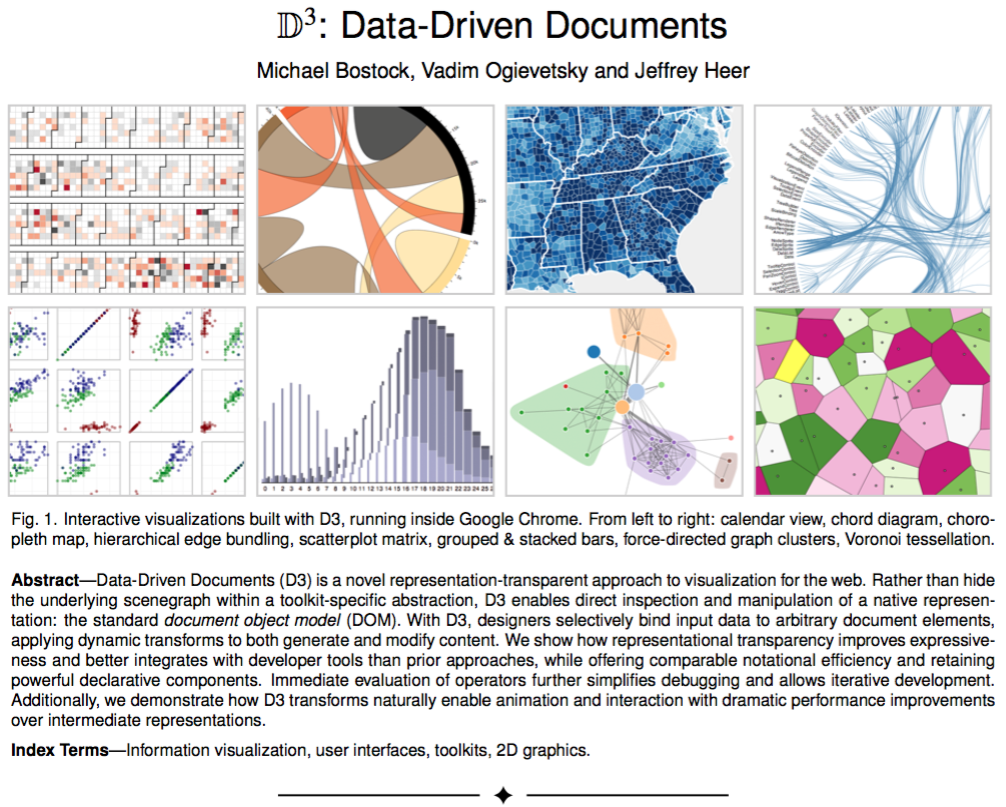
M. Bostock, V. Ogievetsky, J. Heer, IEEE, 2011, 17, 2301-2309
Main author

- Presentation blog post: A better way to code (by M. Bostock)
- Nice guide: The User Manual
- Try it out at https://observablehq.com/
Similar to the Jupyter Notebook, for JavaScript projects
D3: Pros and Cons
cons:
pros:
- low level
- steep learning curve
- requires designer skills
- open-source (vibrant community)
- flexible
- lots of libs rely on it
- increasing popularity for data viz
Check it out if you are into Data Journalism
Nice Example in the wild
Some examples of my own
[{
    "title": "The Phantom Menace",
    "opening_crawl": "Turmoil has engulfed the\r\nGalactic Republic. The taxation\r\nof trade routes to outlying star\r\nsystems is in dispute.\r\n\r\nHoping to resolve the matter\r\nwith a blockade of deadly\r\nbattleships, the greedy Trade\r\nFederation has stopped all\r\nshipping to the small planet\r\nof Naboo.\r\n\r\nWhile the Congress of the\r\nRepublic endlessly debates\r\nthis alarming chain of events,\r\nthe Supreme Chancellor has\r\nsecretly dispatched two Jedi\r\nKnights, the guardians of\r\npeace and justice in the\r\ngalaxy, to settle the conflict....",
    "planets": [{
        "name": "Malastare",
        "population": 2000000000,
        "diameter": 18880,
        "people": [{
            "name": "Sebulba",
            "species": "Dug"
        }]
    }, {
        "name": "Glee Anselm",
        "population": 500000000,
        "diameter": 15600,
        "people": [{
            "name": "Kit Fisto",
            "species": "Nautolan"
        }]
...

}, {
    "title": "Attack of the Clones",
    "opening_crawl": "There is unrest in the Galactic\r\nSenate. Several thousand solar\r\nsystems have declared their\r\nintentions to leave the Republic.\r\n\r\nThis separatist movement,\r\nunder the leadership of the\r\nmysterious Count Dooku, has\r\nmade it difficult for the limited\r\nnumber of Jedi Knights to maintain \r\npeace and order in the galaxy.\r\n\r\nSenator Amidala, the former\r\nQueen of Naboo, is returning\r\nto the Galactic Senate to vote\r\non the critical issue of creating\r\nan ARMY OF THE REPUBLIC\r\nto assist the overwhelmed\r\nJedi....",
    "planets": [{
        "name": "Kamino",
        "population": 1000000000,
        "diameter": 19720,
        "people": [{
            "name": "Boba Fett",
            "species": "Human"
        }, {
            "name": "Lama Su",
            "species": "Kaminoan"
        }, {
            "name": "Taun We",
            "species": "Kaminoan"
        }]
    }, {
        "name": "Glee Anselm",
        "population": 500000000,
        "diameter": 15600,
        "people": [{
            "name": "Kit Fisto",
            "species": "Nautolan"
        }]
    }, {
        "name": "Muunilinst",
        "population": 5000000000,
        "diameter": 13800,
        "people": [{
            "name": "San Hill",
            "species": "Muun"
        }]
Star Wars Data
Developer Tools
Develop ➭ Show Javascript Console
View ➭ Developer ➭ JavaScript console
Tools ➭ Web Developer ➭ Web Console


- Your favourite text editor to write the source code.
- The browser web inspector to see the current state of the DOM and debug and test the JavaScript code:
Web document
(D.O.M.: Document Object Model)
- A representation of the document as a group of objects (with properties and methods) arranged in a hierarchical tree structure.
- The idea is to provide with a framework in which one can get, change, add or delete HTML elements programatically. D3 will make use of this property.
document
element <head>
element <body>
element <html>
element <title>
text
"my title"
element <h1>
element <a>
text
"My page"
attribute href
text
"my link"
element <div>
parent, child, sibling
DOM nodes
Web document
.html (structure)
Let's check this out at fiddle
<!DOCTYPE html>
<html>

    <head>

    </head>


    <body>

    </body>

</html>
.css (style)
body {
  background: blue;
  text-align: left;
}


p {
  font-size: 25px;
  font-family: Helvetica;
}
.js (scripting)
var a = 3;

function sqr(x) {
    return x*x;
}

console.log(sqr(a));
visit MDN Web Docs or web.dev for tutorials
id and class
.css
.html
<div id='myObject'><div class='myClass'>#myObject {
width: 100px;
height: 50px;
}.myClass {
width: 100px;
height: 50px;
}These are two element attributes that will be used to identify a specific element or a group of elements.
All in one file
(not recommended)
<!DOCTYPE html>
<html>

    <head>
        <style>
        body {
          background: blue;
          text-align: left;
        }

        p {
          font-size: 25px;
          font-family: Helvetica;
        }
        </style>
    </head>


    <body>
        <script>
        var a = 3;

        function sqr(x) {
            return x*x;
        }

        console.log(sqr(a));
        </script>
    </body>

</html>
<link rel="stylesheet" type="text/css" href="css/myStyle.css">
<script src="js/myScript.js"></script>
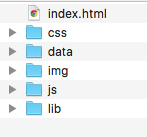
Suggested folder tree for a D3 visualization:
relationship between the current document and the linked document
media type of the linked document
How to load D3
<script src="https://d3js.org/d3.v7.min.js"></script>Simply add a line to the head of your .html document:
if you are loading an externally hosted version:
<script src="lib/d3.v7.min.js"></script>if you are loading from a local relative folder:
JavaScript basics

from this tweet

But ...
JavaScript basics
VARIABLES
All variables can be defined with var:
var foo = 14;
var str = "My taylor is rich";
var arr = [3,2,6,1];
var mylist = ["a","b","c"];
function addFive(x){
   return x+5;
}
FUCTIONS
var addFive = function(x){
   return x+5;
};
declaration
expression
JavaScript basics
VARIABLE SCOPE
function hello(x){
   var myLocal = 0;
   myGlobal = 5;
}
When defined inside a function, variables are considered local unless the var is omitted:
a better approach... use:
let myLocal = 0;
const myLocal = 0;
scoped to a block
meant for constants, also scoped to a block
JavaScript basics
DATA STRUCTURES
- Arrays
- Objects
var cars = ["Seat", "Volvo", "BMW"];
cars[0] = 100;
var numCars = cars.length;
var matrix = [[1,3],[6,3]];
var person = {
firstName:"Michael",
lastName:"Knight",
age:36
};
var firstName = person.firstName;
var firstName = person["firstName"];JavaScript basics
ANONYMOUS FUNCTIONS
Similar to lambda functions in Python.
var cars = ["Seat", "Volvo", "BMW"];

var names = cars.map(function(d){return d;});
var indices = cars.map(function(d,i){return i;});
d: each element data i: 0-based indices
Similar to lambda functions in Python.
The order matters.
Selections
Before you can modify programatically the elements of your document, you should be able to select them.
You can do that with one of the following methods:
selects the first match
selects all elements that match
d3.selectAll(selector)
d3.select(selector)
.select and .selectAll return an OBJECT.
A useful method of such object:
d3.selectAll(selector).nodes()
returns an array with the selected DOM nodes
Selections
examples of selector are:
- a string specifying a CSS selector
- a DOM node.
d3.select('p')
d3.select('#myObject')
d3.select('.myClass')
 d3.select(
    d3.selectAll('p').nodes()[2]
 )
- a function (advanced)
 d3.selectAll(
    function(){
       return d3.select(this).nodes()[0]
    }
 )
current element
Things you can do with a selection
.remove()Remove it:
Remove the first <p> element of the example document.
Things you can do with a selection
.attr(<name>, <value>)
.style(<name>, <value>)
.text(<value>)
.html(<value>)
Change its properties (setters):
Get the font-family of the title (the h1 element).
Get the html code of the <table> element.
.attr(<name>)
.style(<name>)
.text()
.html()
Get its properties (getters):
Change the class attribute of all <p> elements to "info".
Change the font-family of the title to Helvetica.
Change the title to "My document".
Things you can do with a selection
.append(element)
Append children:
Append at the end of the document this hyperlink:
<a target="_blank" href="https://web.dev/">docs</a>Append a column to the table filled with zeros.
Things you can do with a selection
.select(selector)
.selectAll(selector)
Nest more selections:
Select the rows in the body of the table and then
change the value of the first element of every row to "9".
SVG and CANVAS
Elements are drawn and forgotten (no html tags, no mouse events).
Suited for drawing thousands of elements.
Poor resolution when zooming in (pixel map).
Example using canvas: Spirograph
Elements are added to the DOM and are treated as such.
Limitted in the number of elements the browser can handle.
Same resolution quality at any zoom scale.
<svg>
<canvas>
Common SVG D.O.M. elements
<circle cx="50" cy="50" r="40"/>
<rect x="50" y="50" width="40" height="40"/>
<line x1="50" y1="50" x2="80" y2="40"/>
<text x="50" y="50">Some text</text>
Style can be specified as tag attributes and as css.
d3.select("svg")
    .append("circle")
    .attr("cx","50")
    .attr("cy","50")
    .attr("r","40");
d3.select("svg")
    .append("text")
    .attr("x","50")
    .attr("y","50")
    .text("Some text");
How to add them to the document programatically with D3:
Add them inside the <svg> tag of the .html document:
Coordinate system
x and y coordinates are absolute to the top-left corner of the <svg> element:
+x
+y
<g> element
...unless the element is wrapped in a <g> element:
<g transform="translate(dx,dy)">
   ...
   ...
</g>
+x
+y
Good for moving several elements altogether.
<g> element
...unless the element is wrapped in a <g> element:
<g transform="translate(dx,dy)rotate(deg)">
   ...
   ...
</g>
+x
+y
You can concatenate multiple transformations:
- translate
- rotate
- scale
- skew
- ...
Binding data to selections
Appending one circle to my SVG:
var mySVG = d3.select("svg");

mySVG.append("circle")
    .attr("cx",50)
    .attr("cy",50)
    .attr("r",50);
But what if you have to append many?
for (let i=0;i<5;i+=1){
    mySVG.append("circle")
        .attr("cx",50+i*100)
        .attr("cy",50)
        .attr("r",50);
}
And what if the position of the circles depend on the values of an array that is changing dynamically?
Binding data to selections
A more powerful and universal way:
var myData = [50,150,250,350,450];

var circles = d3.select('svg')
                .selectAll("circle")
                .data(myData);

circles.join("circle")
        .attr("cx", function(d){return d;})
        .attr("cy", 50)
.attr("r", 50);- Bind data to a selection that can also be empty.
- join method to assign a data element to each selection.
- The bonded data can be used to change attributes of selections using anonymous functions.
What have we done here?
Simplified syntax:
d => d
Binding data to selections
Selections can be stored in variables, and will keep their bind data.
It's possible to bind different data sets to subselections (selections within selections)
If no data is assigned to a child node, the corresponding data item from the data linked to its parent is used.
Some considerations:
Mouse events
(interactivity)
Attach a mouse event listener to an element with the .on method:
d3.select("svg")
  .on("mousemove", doSomething);

function doSomething(event){
    var myPointer = d3.pointer(event);

    var x = myPointer[0];
    var y = myPointer[1];

    d3.select("p").text(x + "," + y);
}- mousedown
- mouseup
- click
- dblclick
- mouseover
- mouseout
- mouseenter
- mouseleave
Other events:
Transitions
(basic animations)
Modify over time an element attribute or style:
d3.select("svg")
    .transition()
    .style("background","red");
It is possible to concatenate transitions
d3.select("svg")
    .transition().duration(500)
        .style("background","red")
    .transition().duration(500)
        .style("background","yellow");
Transitions
(basic animations)
Apart from duration, it is possible to set
also delay:
and ease:
d3.select("svg")
    .transition().duration(500)
        .style("background","red")
    .transition().duration(500).delay(500)
        .style("background","yellow");
d3.select("svg")
.transition().duration(500)
.ease(d3.easeBounce)
.style("background","red");Scales
var scale = d3.scaleLinear()
                    .domain([100,500])
                    .range([10,350]);
Functions to map a domain to a range:
var scale = d3.scaleLinear()
                    .domain([100,500])
                    .range(["white","blue"]);
scale(100); //Returns 10
scale(300); //Returns 180
scale(500); //Returns 350They can interpolate also colors!
scale(100);  //Returns "rgb(255, 255, 255)"
scale(300);  //Returns "rgb(128, 128, 255)"
scale(500);  //Returns "rgb(0, 0, 255)"
Loading data from outside
Convenience method based on promises (asynchronous):
It is always possible to hardcode data in the script.
But what if you want to load from outside your app?
d3.csv("https://someFile.csv")
  .then(function(data){
    ... do something with data
   })
d3.csv
d3.tsv
d3.json
data is an array of objects:
data = [
        {A:'1', B:'2'},
        {A:'5', B:'9'},
       ]
| A | B |
|---|---|
| 1 | 2 |
| 5 | 9 |
For security only served files (no access to locals)
Loading data from outside
Convenience method based on promises (asynchronous):
It is always possible to hardcode data in the script.
But what if you want to load from outside your app?
d3.csv("https://someFile.csv", d3.autoType)
  .then(function(data){

   })
data is an array of objects:
data = [
        {A: 1, B: 2},
        {A: 5, B: 9},
       ]
| A | B |
|---|---|
| 1 | 2 |
| 5 | 9 |
Loading data from outside
Convenience method based on promises (asynchronous):
It is always possible to hardcode data in the script.
But what if you want to load from outside your app?
d3.csv("https://someFile.csv", d3.autoType)
  .then(function(data){
    ... do something with data
   })
  .catch(function(error){
    ... handle error
   })
If the data could not be fetched, we can catch the error and act accordingly.
Prepare the data
JavaScript does not have much built-in functionality for data manipulation. Several libraries have been developed to remedy that.
Add to your page with:
https://cdn.jsdelivr.net/npm/lodash/lodash.min.jswhere URL is:
<script src=URL></script>
But also D3 has builtin functionality for basic manipulation of arrays:
https://cdn.jsdelivr.net/npm/danfojs@0.1.1/dist/index.min.jshttps://cdn.jsdelivr.net/npm/arquero@latestlodash.js
Some examples:
_.range
_.random
_.flatten
_.map
_.filter
_.max, _.min
on arrays:
on objects:
See the full API at lodash.com/docs
Exercise: Given the array of names:
   var names =
          ["Chris","David","Jin","Jose","Juan","Kevin","Ricardo","Max"];
create an array of objects of the same length using underscore functions. Each object should have a "name" property and a "score" property with a random value between 0 and 10. The result should look like this:
   [{
     name: "Chris",
     score: 4
   }, {
     name: "David",
     score: 8
   },
   ...]
Obtain the object with the maximum score.
EXERCISE
Write a webapp that loads the data at
and displays dots at initial positions (Xi, Yi)
that transition to final positions (Xf, Yf)

Layouts
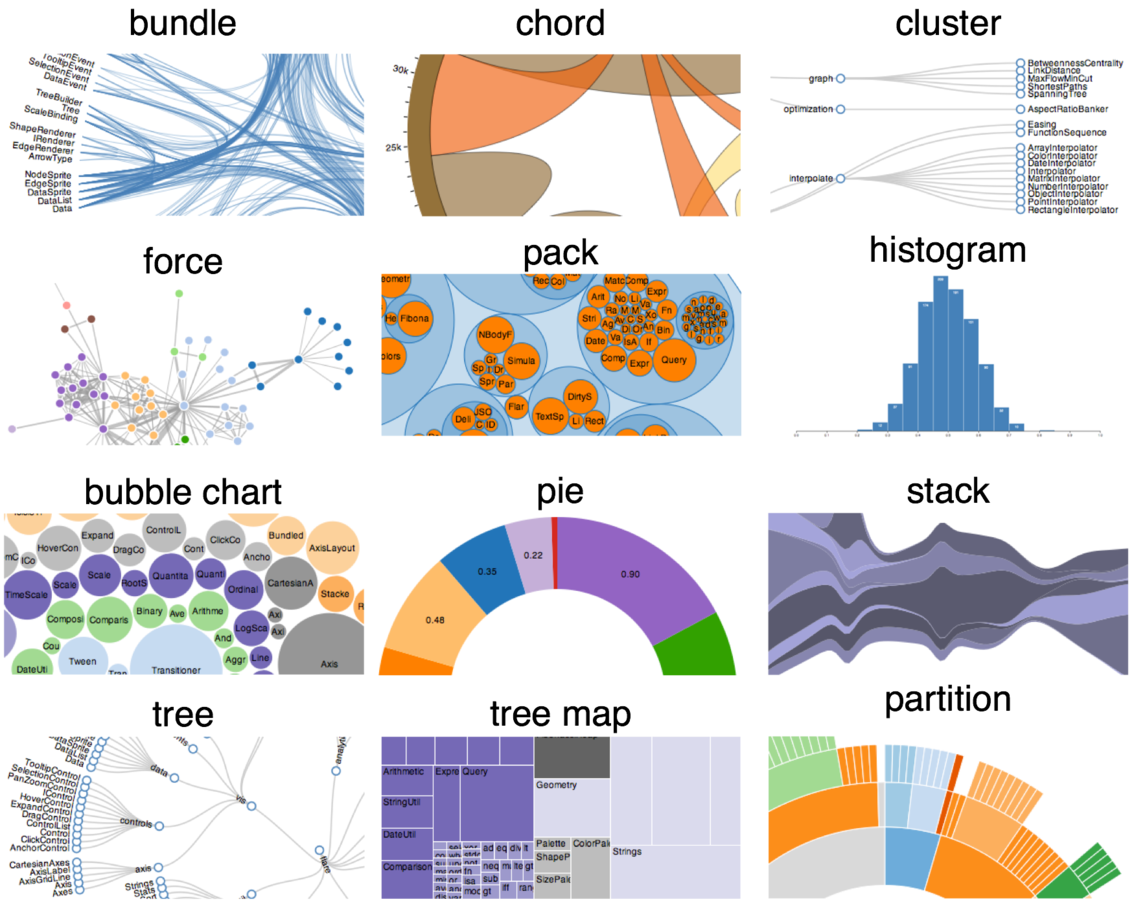
Charts
You better use any of the higher level readily made libraries to build charts in javascript. Examples are:


Resources
Docs
- app.rawgraphs.io
- distill.pub Machine Learning journal built on interactive viz.
- dashingd3js.com
- alignedleft.com/tutorials/d3/
- "Interactive Data Visualization for the Web" (book)
- http://jsdatav.is/index.html (book "Data Visualization with JavaScript")
- The Hitchhiker's Guide to d3.js
Tutorials
Examples
- Observable Notebook for d3 (by Mike Bostock)
- d3 playground Web interface to write d3 code and render in real time
Tools