Historical Data
Case Study
Cindy A. Nguyen
UC Berkeley, History Ph.D. Student
@cindyanguyen
Goals
- Data and quantitative methods
- structural processes of history rather than heavily cultural analysis and close readings
- meaning beyond specific doctoral project (also in flux)
- exposure to new tools
- DH in field of Vietnamese studies
- (context of long -distance learning and DH in a new program)
Stage 0
- 5-7 hours each week
- readings, research, tools
- ~2 weeks of coterminous processes of
-
conceptualizing project
-
possibility logistically
Stage 0 (still...)
- failure of automation = 2 weeks of hand-inputting one data source
- compilation of Vietnamese language newspapers & serials 1865-1945
-

Lessons from Tedious Data Entry
- historical trends
- organizational understanding of newspapers
- newspapers in Thailand, China, prisons, secret
- subjective data of source
- data & metadata
- static and variability of journalistic data
- epistemological questions, data as fact?
- excel and language skills
- historical trends
- organizational understanding of newspapers
- newspapers in Thailand, China, prisons, secret
- subjective data of source
- data & metadata
- static and variability of journalistic data
- epistemological questions, data as fact?
- excel and language skills
Stage 1: Challenges & Tools
- Language
- Ghostscript + Tesseract + VietOCR
- Vietnamese font into Unicode
- Data
- Microsoft Excel
- Open Refine
- Visualization
- Tabula
- Manyeyes
- Quadrigram
- Timeline.js
Stage 1: Challenges & Tools
-
Geospatial
- QGIS
- Mapbox & Tilemill
- Google script for geocoding
- CartoDB
- Networks
- Gephi
- Miscellaneous
- Scrivener
- Microsoft Word
- Slid.es
Stage 2: Possible Directions
- Network Visualization people-->publications-->place
- Locational representation of data on cities-->publications
- Geo-spatial Visualization of Saigon/Hanoi distributors
Stage 3: Outcomes
Tables & Charts
Stage 3: Outcomes
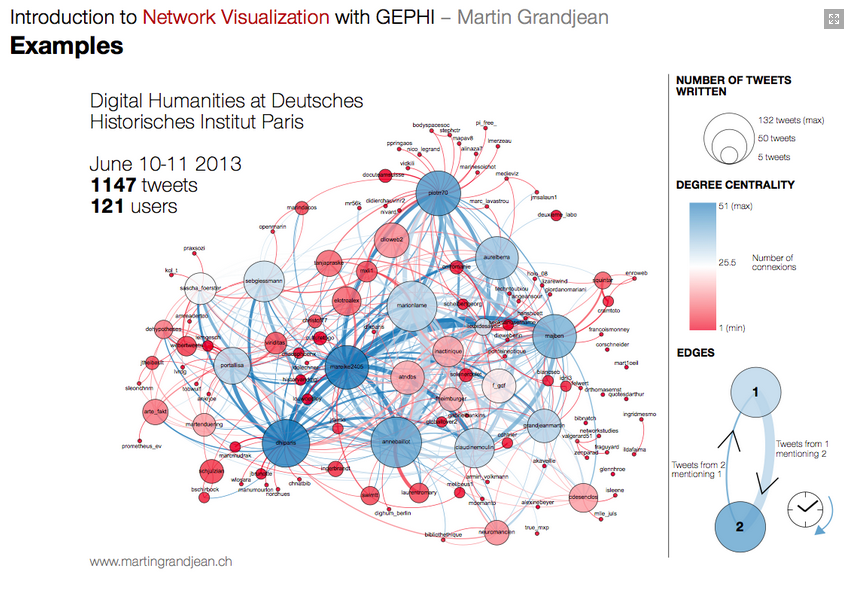
- Basic Gephi Visualization
- http://exploreyourdata.wordpress.com/2013/07/29/gephi-curated-list-of-tutorials/
-
Introduction to Network Visualization with Gephi http://www.martingrandjean.ch/introduction-to-network-visualization-gephi/#!prettyPhoto[slides]-1813/1/
(look at file)

Viz Outcomes

- searchable
- over 500 people connected to publications
- can assume how things were, not necessarily what they were not
Viz Limitations
- one data source
- should have more connections
- potential subjectiveness
- size of circle (nodes) measure degree of edges can be misleading
- so what?
Other Directions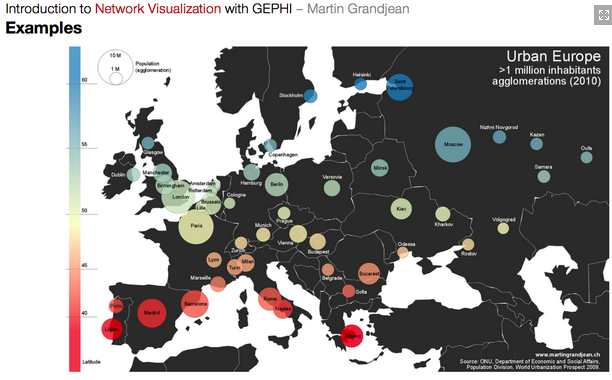
- attempt to place node groups on map Tilemill + mapbox + finding period map
-

Project Conclusions
- long distance reading of larger data sets + categorization (fuzzy data)
- subjectiveness of categorization, subjectiveness of source
- Gephi & Network Maps
- not all data sets should be a network map
- visualization as a REPRESENTATION of something we already/might know
- when can viz's reveal 'what we don't know?'
- methodological closeness with large sets of data force us to question how the data is recorded (Padua case)
Future
- mores sources & the need for automation
- grant application for undergraduate research assistant
- expand decisions documentation
- open source data
- collaboration with compilers (can also help with copyright/intellectual property issues)
- contributions from other scholars
- collaboration with French & Vietnamese archives and libraries