Dynamic Systems Modelling
24-25th September 2018 - Villa Finaly
Paul Chapron, IGN, COGIT, paul.chapron@ign.fr
Clémentine Cottineau, CNRS, CMH, clementine.cottineau@ens.fr
Objectives
- Compare methods of modelling big spatial data (BSD)
- Evaluate the opportunity of BSD compared to traditional sources of information
- Produce modelling workflows robust to frequent updates of datasets
What is a model?
The simplified representation of elements and processes from a more complex reality towards a specific purpose.
What is a complex model?
The simplified representation of elements and processes from a more complex reality towards a specific purpose.
A complex model has additional features:
- emergence
- local interactions
- "too much for the human brain"
- not solvable analytically
- heterogenous levels of interaction
Why different models?
Different models of the same reality can be
- confronted as alternatives
- complementary
- all wrong but all useful!
Different modelling frameworks (descriptive modelling & generative modelling for example)
- can be used for different purposes (ex. explain vs. predict)
- can be used in a workflow
Why model? (Epstein, 2008, JASSS)
- Explain (very distinct from predict)
- Guide data collection
- Illuminate core dynamics
- Suggest dynamical analogies
- Discover new questions
- Promote a scientific habit of mind
- Bound (bracket) outcomes to plausible ranges
- Illuminate core uncertainties.
- Offer crisis options in near-real time
- Demonstrate tradeoffs / suggest efficiencies
- Challenge the robustness of prevailing theory through perturbations
- Expose prevailing wisdom as incompatible with available data
- Train practitioners
- Discipline the policy dialogue
- Educate the general public
- Reveal the apparently simple (complex) to be complex (simple)
What is a model?
The simplified representation of elements and processes from a more complex reality towards a specific purpose.
What is data?
Operationally:
The simplified observation of elements from a more complex reality.
What is a model?
What is data?
Operationally:
The simplified observation of elements from a more complex reality.
data < model
The simplified representation of elements and processes from a more complex reality towards a specific purpose.
Specificity of big data
They are models built towards a purpose usually different to the one you will use them for.
ex. Mobile phone data located at cell tower
- create voronoi polygons from scatter points
- intersect polygons with other geography
- interpolate distribution into intersections
> Creates two levels of spatial uncertainties
In this workshop...
- Make big spatial data usable for social study
- Compare sources of information on a specific subject: socioeconomic segregation
- Explore descriptive models of segregation with BSP
- Explore generative models of segregation with BSP (Schelling)
Big spatial data for social study
Case study:
- Segregation analysis
- from Airbnb data
- in 3 Canadian metropolises (Montreal / Toronto / Vancouver)
Sources:
- Scraping of Airbnb listings (InsideAirBnB.com)
- Canadian Census API ('cancensus' R package)
Big spatial data for social study
> Get into the 'syllabus' folder
- copy/paste from USB sticks
- OR download zip package / clone from GitHub
> Open 'Modelling_Data_Part1.Rmd'
DON'T KNIT YET!
- Execute (later) the .Rmd file chunk by chunk
- OR copy/paste the chunks into a blanck .R file. In this case, use setwd(PATH_OF_'SYLLABUS') at the beginning
Airbnb Data (purpose/structure)

Airbnb Data (purpose/structure)
Big spatial data for social study
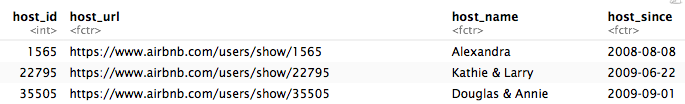
Listing file structure:
General info
Host info

Big spatial data for social study
Listing file structure:
Spatial info


Big spatial data for social study
Listing file structure:
Spatial info
Big spatial data for social study
Listing file structure:
Housing info
Economic info


Big spatial data for social study
Main problems:
Absence of info
Redundancy


Big spatial data for social study
Proxy definition
s
Identifying residential types -11,639
Identifying residents vs. multi-owners -7,168
Identifying current hosts -7,499


Big spatial data for social study
Proxy definition
Estimating value per room in $ -150
Initial observations = 43,211
Final observations = 16,755

-60%
Big spatial data for social study
Spatial
sampling
bias

Big spatial data for social study
Spatial
sampling
bias

https://raisingthevillage.ca/social-identity-toolkit/
Big spatial data for social study
Spatial
sampling
bias

Big spatial data for social study
Spatial sampling bias
Using the census to model
- density of AirBnB listing
- price of AirBnB listing
Descriptive models
Modelling the density of Airbnb listings based on:
- centrality of census tract in the city
- concentration of visible minorities in the tract
Modelling the relative price of Airbnb listings based on:
- centrality of listing in the city
- concentration of visible minorities in the surrounding tract
Descriptive models

Non linear relationship
between:
density of Airbnb listing
and
distance to the
city centre (City Hall)
Central
sample
Peripheral
sample
10 km
Descriptive models

Number of listings per tract
Price per room
Central
sample
Peripheral
sample
Complete
sample
Descriptive models
Segregation measures:
- on ethno-racial categories: Entropy divergence
- on airbnb relative price: Reardon ordinal index
Comparing cities
- Toronto
- Vancouver
- Montreal
Descriptive models

Entropy
Segregation
(minorities)
Reardon
Segregation
(Airbnb price)
0.18
0.26
0.14
0.17
0.13
0.18
Generative models


Source: Gauvin et al., 2009
Generative models
Video: YouTube, Dan Olner.
Model implementation: Wilensky, U. (1997). NetLogo Segregation model.
Schelling model
- environment is a regular grid
- global vacancy percentage
- 2 groups of agents
- Each agent:
- computes "happiness" regarding neighborhood occupation by other group agents and a tolerance threshold
- teleports in an empty cell if unhappy
See Modeling/syllabus/Schelling.Rmd or SchelingwithOptim.Rmd
Generative model
Possible increments of the model rules:
- initialise with data
- change the mechanisms of relocation
- change the city (Vancouver, Montreal)
- simulate Airbnb listings
Material
https://github.com/DynamiteStaff/R-workshops/tree/master/Modeling