Modern
Survival Analysis
Cam Davidson-Pilon
PyData Piraeus Meetup 🎉
July 31, 2020

statistics
statistics
Machine
Learning
statistics
Machine
Learning
Classification
statistics
Machine
Learning
Classification
Regression
statistics
Machine
Learning
Classification
Regression
Causal Inference
statistics
Machine
Learning
Classification
Regression
Causal Inference
Dim. Reduction
....
statistics
Machine
Learning
Classification
Regression
Causal Inference
Dim. Reduction
....
Survival Analysis
statistics
Machine
Learning
Classification
Regression
Causal Inference
Dim. Reduction
....
Survival Analysis
What is survival Analysis?
What is survival Analysis?
Measuring the time between events*
What is survival Analysis?
Measuring the time between events*
*Later, we will generalize this
- Time between contracting a disease, and death.
- Time between contracting a disease, and death.
- How long a politician is in office for.
- Time between contracting a disease, and death.
- How long a politician is in office for.
- Time between a user sign up and the user leaving.
- Time between contracting a disease, and death.
- How long a politician is in office for.
- Time between a user sign up and the user leaving.
- How long a packet takes to travel from data center to data center.
- Time between contracting a disease, and death.
- How long a politician is in office for.
- Time between a user sign up and the user leaving.
- How long a packet takes to travel from data center to data center.
- The lifespan of an organism.


Survival Analysis
Regression
Survival Analysis
- duration should be non-negative
Regression
Survival Analysis
- duration should be non-negative
Regression
- not necessarily, but you could transform the output to a positive value
Survival Analysis
- duration should be non-negative
- the event may or may not occur
Regression
- not necessarily, but you could transform the output to a positive value
Survival Analysis
- duration should be non-negative
- the event may or may not occur
Regression
- not necessarily, but you could transform the output to a positive value
- ???
Survival Analysis
- duration should be non-negative
- the event may or may not occur
Classification
Survival Analysis
- duration should be non-negative
- the event may or may not occur
Classification
- naturally models if an event occurs.
Survival Analysis
- duration should be non-negative
- the event may or may not occur
Classification
- naturally models if an event occurs.
- But throws out important information about how long it took to occur (or not)
Pieces of Survival Analysis
Survival Function
Survival Function

Hazard function
Hazard function
Hazard function
Hazard function
Hazard function
Cumulatuve Hazard function
Cumulatuve Hazard function

In survival analysis, you're modelling one of these
Let's model the survival function
Data -> Kaplan-Meier

| T | E |
|---|---|
| 60 | 1 |
| 60 | 1 |
| 60 | 0 |
| 15 | 0 |
| 69 | 1 |
| 45 | 1 |
| 17 | 1 |
| 48 | 1 |
| 60 | 1 |
| ... | ... |
Kaplan Meier is non-parametric
As are:
Kaplan Meier is non-parametric
As are:
- mean
- median
- empirical CDF
Kaplan Meier is non-parametric
As are:
- mean
- median
- empirical CDF
- random forests / decision trees
Modern survival
Analysis Tip #1


Regression typically models the cumulative hazard
Regression typically models the cumulative hazard
Why model the cumulative hazard?
- Independent causes of death are additive on the cumulative hazard scale.
Why model the cumulative hazard?
- Independent causes of death are additive on the cumulative hazard scale.
Why model the cumulative hazard?
- Independent causes of death are additive on the cumulative hazard scale.
- Differentiating (to recover the hazard) is many times easier than integrating the hazard (to recover the CHF).
Why model the cumulative hazard?
- Independent causes of death are additive on the cumulative hazard scale.
- Differentiating (to recover the hazard) is many times easier than integrating the hazard (to recover the CHF).

Why model the cumulative hazard?
- Independent causes of death are additive on the cumulative hazard scale.
- Differentiating (to recover the hazard) is many times easier than integrating the hazard (to recover the CHF).
👍
Why model the cumulative hazard?
- Independent causes of death are additive on the cumulative hazard scale.
- Differentiating (to recover the hazard) is many times easier than integrating the hazard (to recover the CHF).
👍
👎
"I've heard of the cox proportional model - what's that?"
Cox Proportional Hazard model
- Used because it's semi-parametric
Cox Proportional Hazard model
- Used because it's semi-parametric
Cox Proportional Hazard model
- Used because it's semi-parametric
Non-parametric baseline hazard
Cox Proportional Hazard model
- Used because it's semi-parametric
Non-parametric baseline hazard
Parametric scalar
Cox Proportional Hazard model
- Used because it's semi-parametric
Non-parametric baseline hazard
Parametric scalar
- the non-parametric part is nice: "it's makes less assumptions about the form"
Modern survival
Analysis Tip #2
Cox Proportional Hazard model
- Used because it's semi-parametric
Non-parametric baseline hazard
Parametric scalar
Don't bother with it
- the non-parametric part is nice: "it's makes less assumptions about the form"
Cox Proportional Hazard model
- the non-parametric part is nice: "it's makes less assumptions about the form"
Cox Proportional Hazard model
- the non-parametric part is nice: "it's makes less assumptions about the form"
- But it carries a lot of hidden, and quite strict, assumptions.
Cox Proportional Hazard model
- the non-parametric part is nice: "it's makes less assumptions about the form"
- But it carries a lot of hidden, and quite strict, assumptions.
Cox Proportional Hazard model
- the non-parametric part is nice: "it's makes less assumptions about the form"
- But it carries a lot of hidden, and quite strict, assumptions.
- The coefficients are non-collapsible.
Cox Proportional Hazard model
- the non-parametric part is nice: "it's makes less assumptions about the form"
- But it carries a lot of hidden, and quite strict, assumptions.
- The coefficients are non-collapsible.
- The coefficients cannot be interpreted causally.
Cox Proportional Hazard model
- the non-parametric part is nice: "it's makes less assumptions about the form"
- But it carries a lot of hidden, and quite strict, assumptions.
- The coefficients are non-collapsible.
- The coefficients cannot be interpreted causally.
- Prediction is less efficient than other methods.
Calibration of Survival Models
Calibration of Survival Models
Modern Survival Analysis tip #3

f: MoDel's Probability outputs
↦ observed outcomes
We discretize the [0,1] interval, put the probabilities into bins, and average them.
f: MoDel's Probability outputs
↦ observed outcomes
We discretize the [0,1] interval, put the probabilities into bins, and average them. We hope that:
f: MoDel's Probability outputs
↦ observed outcomes
This is like creating a new prediction function, F, that maps model predictions to outcomes.
We discretize the [0,1] interval, put the probabilities into bins, and average them. We hope that:
f: MoDel's Probability outputs
↦ observed outcomes
The binning approach is coarse and drops information.
f: MoDel's Probability outputs
↦ observed outcomes
The binning approach is coarse and drops information.
One could use a parametric model:
f: MoDel's Probability outputs
↦ observed outcomes
The binning approach is coarse and drops information.
One could use a parametric model:
More flexible the better (competing with a non-parametric histogram)
f: MoDel's Probability outputs
↦ observed outcomes
The binning approach is coarse and drops information.
One could use a parametric model:
More flexible the better (competing with a non-parametric histogram)
Apply to same idea to survival model calibrations.
f: MoDel's Probability outputs
↦ observed outcomes
Given a fixed time, t, we output probabilities of subjects being alive.
f: MoDel's Probability outputs
↦ observed outcomes
Given a fixed time, t, we output probabilities of subjects being alive.
We need to connect these probabilities, p, to realized data (T, E).
f: MoDel's Probability outputs
↦ observed outcomes
Given a fixed time, t, we output probabilities of subjects being alive.
We need to connect these probabilities, p, to realized data (T, E).
We can use a highly flexible parametric survival model.

Do I have time for
Modern Survival Analysis tip #4?
Summary metrics
Metrics like the hazard ratio (from Cox model), or log-rank, are hard to interpret.
Metrics like the hazard ratio (from Cox model), or log-rank, are hard to interpret.
Plus they tell you little about the future - how many years do I have left to live?
Summary metrics
Median survival time is okay - but doesn't always exist.
Summary metrics
Restricted Mean Survival Time is the new standard. (RMST)
Summary metrics
Restricted Mean Survival Time is the new standard. (RMST)
Summary metrics

In conclusion
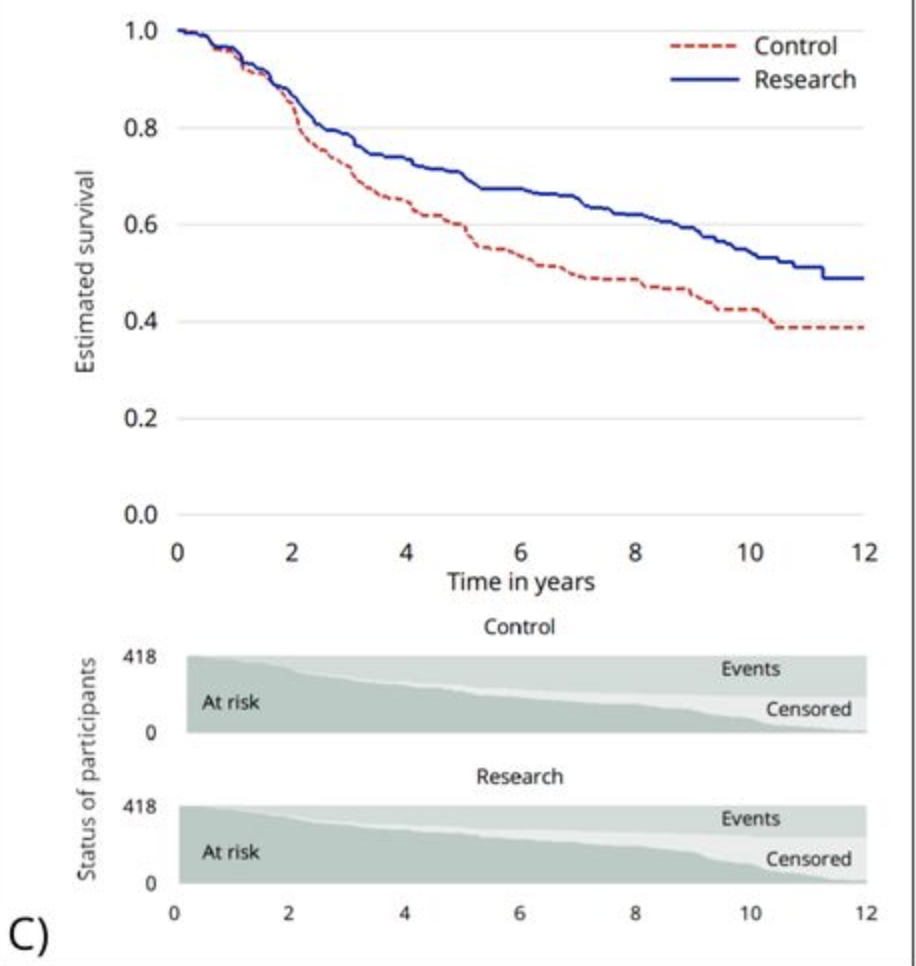
- Use KMunicate-style for presenting Kaplan-Meier results
In conclusion
- Use KMunicate-style for presenting Kaplan-Meier results
- Skip the Cox Proportional Hazard model (if you can)
In conclusion
- Use KMunicate-style for presenting Kaplan-Meier results
- Skip the Cox Proportional Hazard model (if you can)
- Use survival probability calibration plots
In conclusion
- Use KMunicate-style for presenting Kaplan-Meier results
- Skip the Cox Proportional Hazard model (if you can)
- Use survival probability calibration plots
- RMST (restricted mean survival times) are often preferable to other summary metrics.
Questions?
Software
Python:
- lifelines
- scikit-survival
- pycox
R
- survival
- flexsurvreg