Monitoring a !little ecosystem

Cristian Spinetta
@cebspinetta


@cspinetta
Outline
Despegar Infra


Observability

Logging

Metrics

Distributed tracing

A bit of context...
First productive datacenter

Miami region
Private cloud based on Openstack

Self-administrated by devs via Cloudia, an in-house solution developed for creating VMs, load balancers, storage, traffic rules...
A lot of VMs distributed in 2 datacenters:
~8K nodes

AWS

Contingency region

Active mode with productive traffic

~1.4K nodes
~500 deploys per day
What happens internally?

The 3 Pillars of Observability

Logging
Logging
Centralizing at least the access log
Logging with context: you need to correlate logs and see the causality between services

Metrics
Metrics
For reliability and trending in use:
What is happening right now?
What will happen next?
To measure the impact of a change:
Aggregated Data


How is doing before the change?

How is doing after the change?
Metrics
Reliability is not just about throughput and latency
There are a lot of extra effects to consider
Metrics
Garbage collection

Metrics
What about aggregated effects introduced by underlying platform?
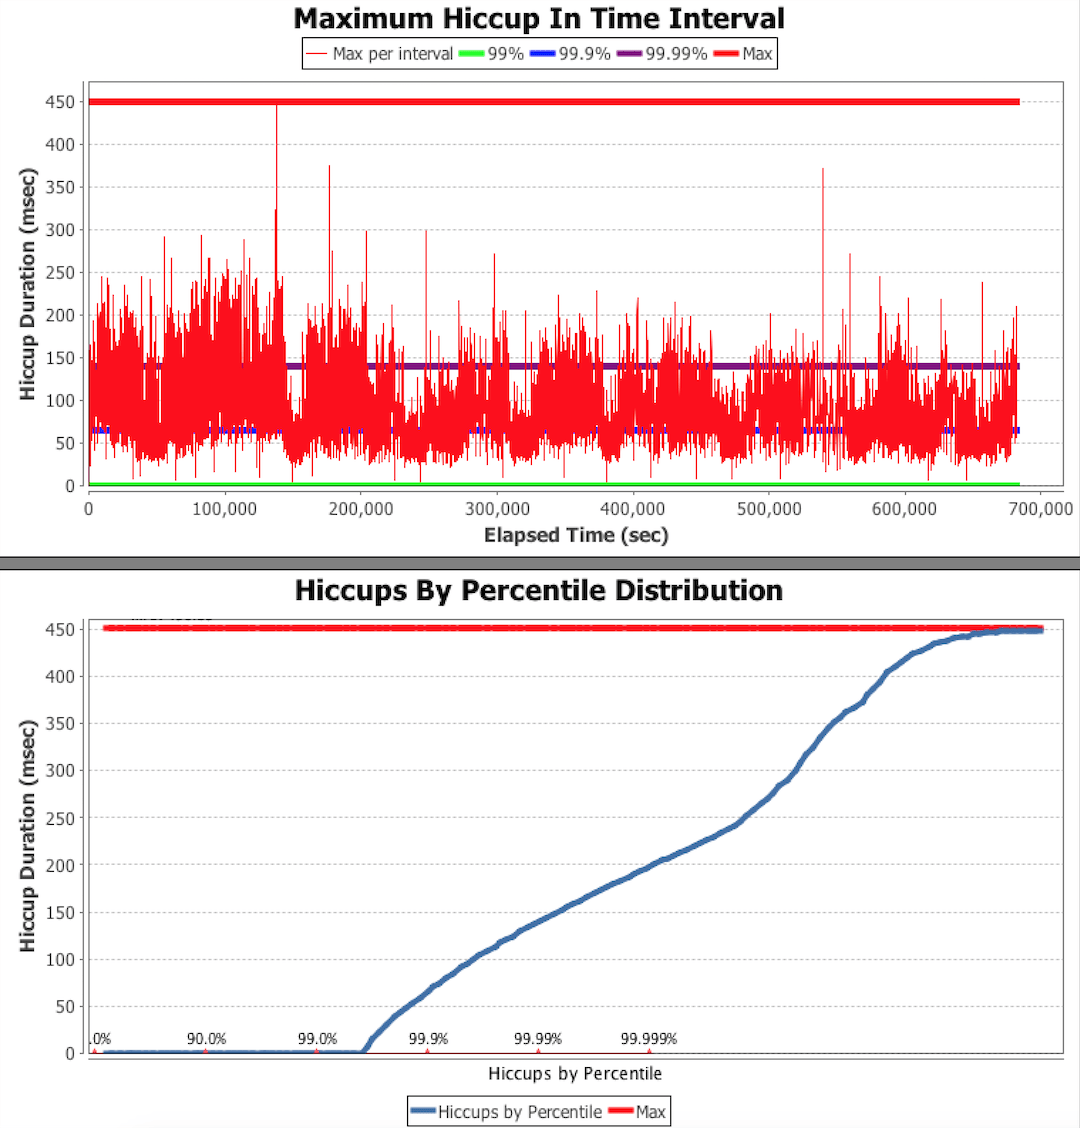
Metrics
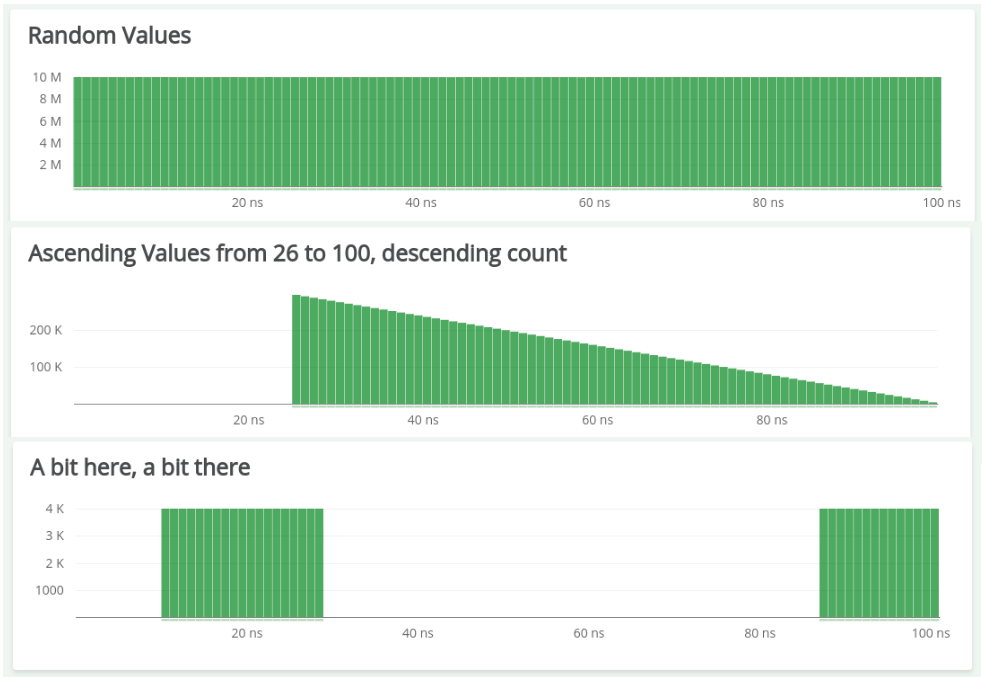
Never use averages
What do they have in common?
Metrics
For all of them, the average is ~50ns
Don't be fooled by the average
you'll be blinded!!
Metrics
Average says:
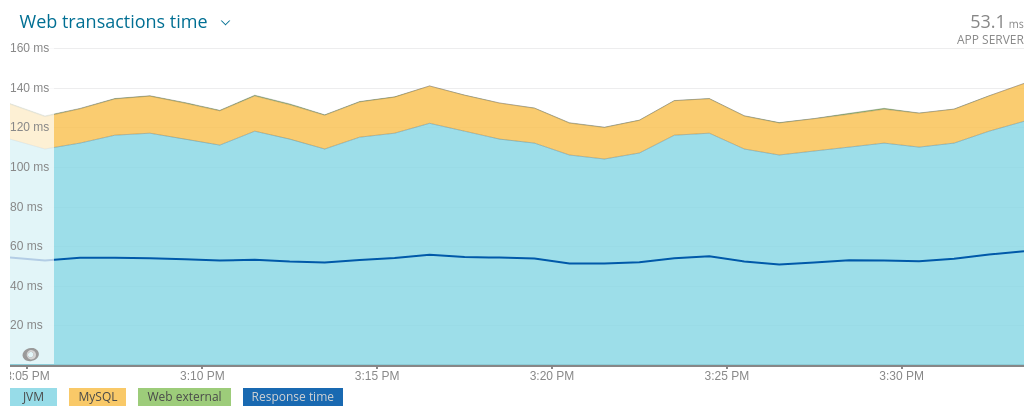
Response time: ~55ms

Metrics
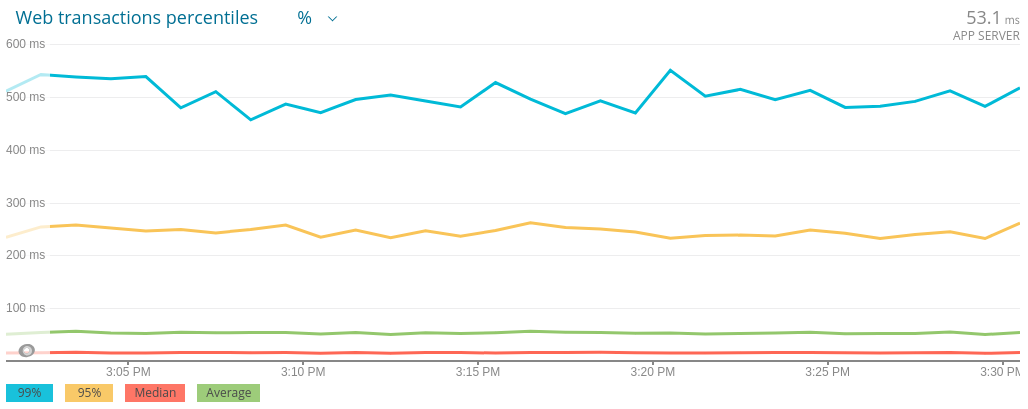
Percentiles say:
Avg: ~55ms | P95: ~250ms - P99: ~550ms

Metrics
Actual latency
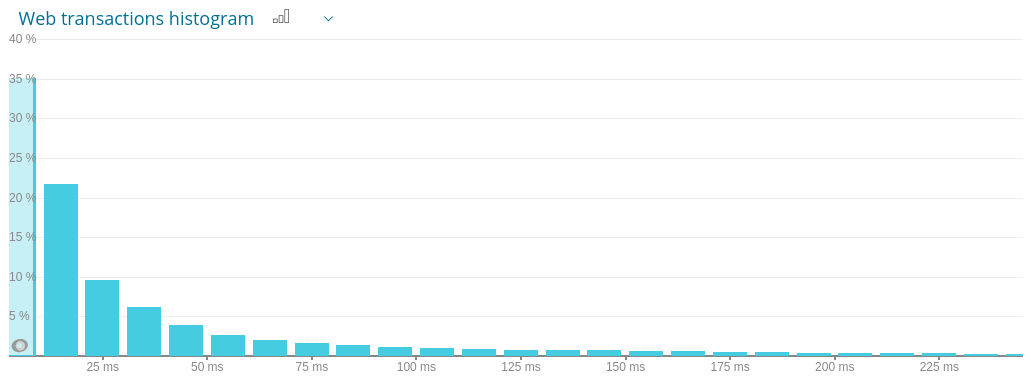
It could be a lot of requests with high values
It's a system optimized for handling time series data (usually an array of long indexed by time).
Prometheus

InfluxDB

Time series databases
Graphite

Datadog

Khronus

OpenTSDB

Be careful or you'll be lying to yourself
Averages lie! Percentiles are good option

Things To Keep In Mind
Neither percentiles nor average can be aggregated

Remember the external effects: hypervisor, jvm, networking...

Get to know your tools. Don't believe to anyone!

Distributed Tracing
Distributed Tracing

Which services did a request pass through?

Where are the bottlenecks?

How much time is lost due to network lag during communication between services?

What occurred in each service for a given request?
A few of the critical questions that DT can answer quickly and easily:
Distributed Tracing Example
- There are two services involved in serving the /users endpoint of this system.
- There are three HTTP calls made from Service A to Service B and happen in parallel.
- Storing the session token happens after all HTTP calls to Service B have completed.
- A substantial amount of time was spent on storing the session token.

Distributed Tracing Components
- A Span represents a logical unit of work.
- Tags and Marks add extra information to spans.

Distributed Tracing Components
- A Trace is a end-to-end latency graph, composed of spans.

Distributed Tracing




Brave


Things To Keep In Mind
Sampling reduces Overhead

Observability tools are unintrusive

Instrumentations can be delegated to commons frameworks

Don't trace every single operation

Zipkin

Distributed Tracing System

Based on Google Dapper (2010)

Created by Twitter (2012)

OpenZipkin (2015)

Active Community

Zipkin UI

Jaeger
Distributed Tracing System

Based on Google Dapper (2010)

Inspired by OpenZipkin

Created by Uber


Jaeger UI

Tracers

Distributed Tracing, Metrics and Context Propagation for application running on the JVM.

- Observability SDK(metrics, tracing).

Trace instrumentation API definitions.
- OpenZipkin's java library and instrumentation.
Brave
Thanks for Coming!
Questions?
