Monitoring Production with Grafana Stack
Cristian Spinetta
@cebspinetta
@cspinetta
Lucas Amoroso
@_lucasamoroso
@lucasamoroso


And friends...






It's a video!
Keep watching...
Outline
Prometheus... Cortex... for what?

Stack Cortex + Prometheus + Grafana

Monitoring And Observability

Show me the money the dashboards

How to start to monitor my services?

Logging with Loki

Tracing with Zipkin


Monitoring And Observability
Observability captures what "montoring" doesn't (and shouldn't)
based on evidences (not conjectures)


Highly granular insights into the behavior of systems along with rich context, perfect for debugging purposes.
Provide visibility into the health of a system and the impact of any failure.
Monitoring
Observability


Prometheus... why?

The people We want to use Prometheus!
Multi dimensional data model (metric name + tags)

Large community of users

Flexible query language
Areas of struggles

Storage limited to local disk

Hard to achieve HA

Strong focus on reliability (each service is independent)

Excellent integration with mainstream
technologies
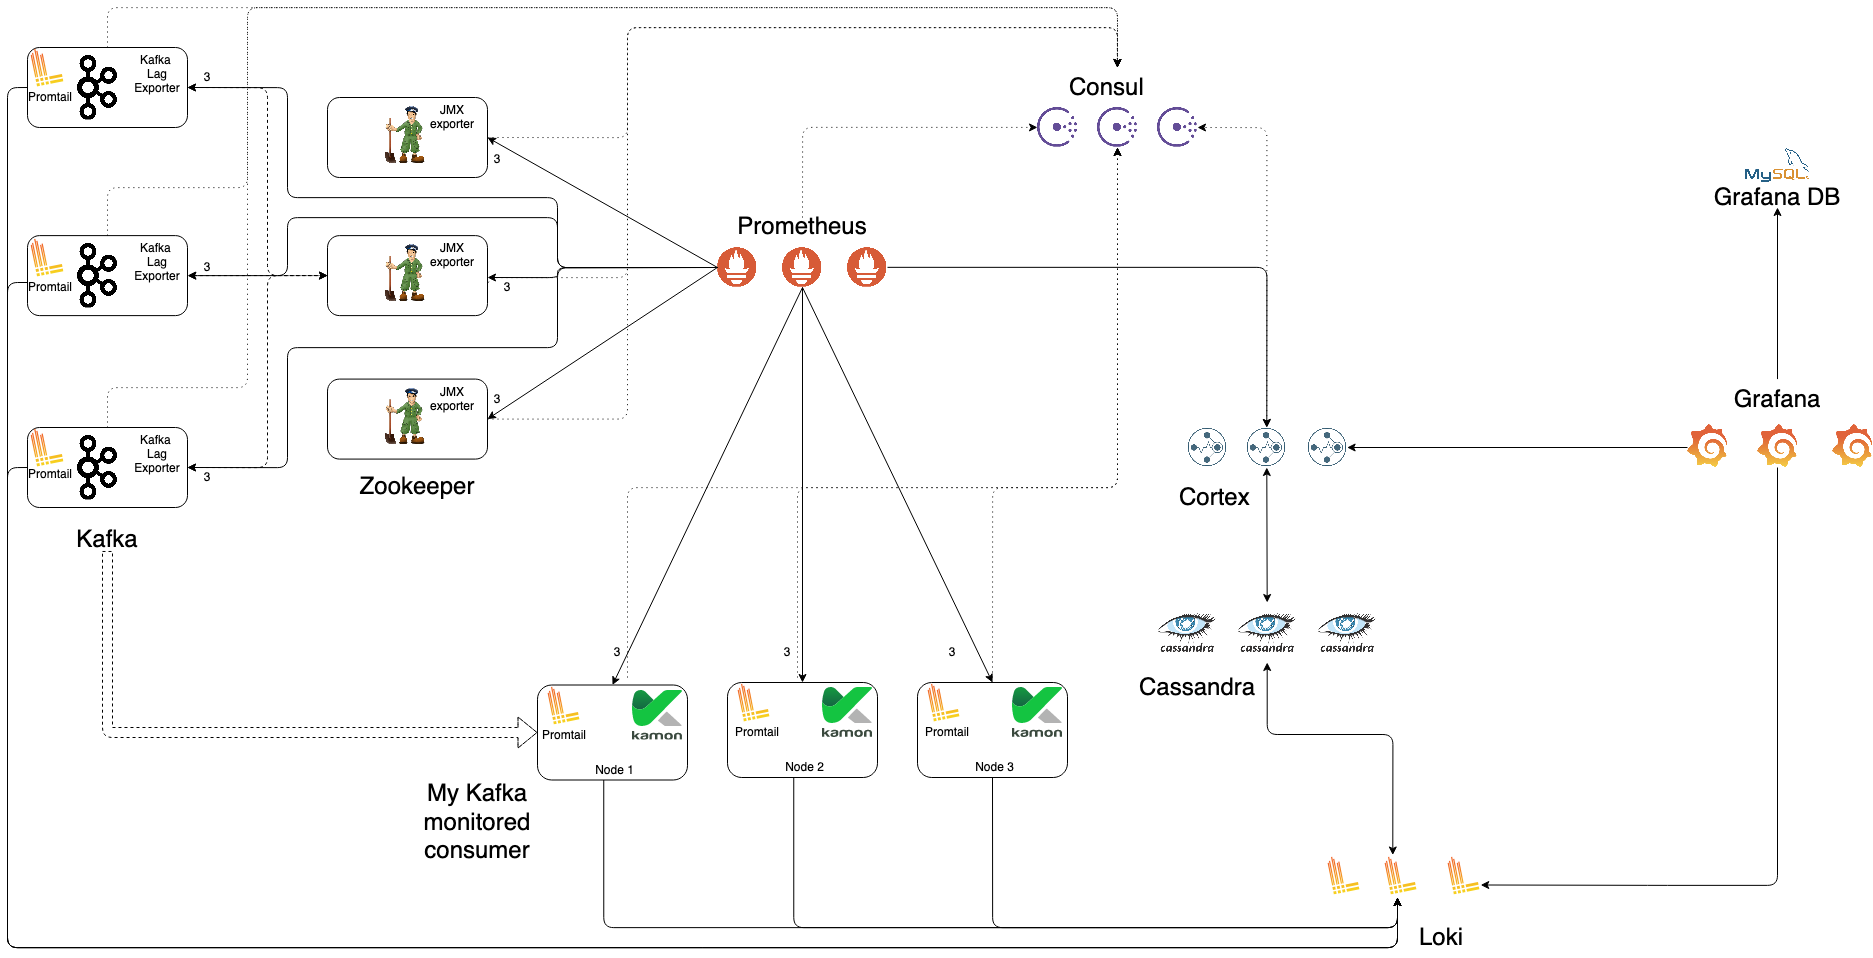
Prometheus Architecture


Collects metrics via pulling over HTTP

Each service have to expose metrics via HTTP

We use Kamon to collect and expose metrics for our Java apps

Each other public project (Kafka, Zookeeper, Cassandra, so on) have to have a way to expose their metrics to Prometheus

Almost all projects based on Java use JXM-Exporter, a Prometheus's Java agent
How to deal with the already known limitation?

Global view

Long term storage
Two widely adopted options:

Easy HA

Introduce Cortex

Cortex uses Consul to distribute metrics handling among nodes and deduplicate the metrics coming from multiple Prometheus.


Require a Storage service for both index and data.

We just chosen Cassandra for lacks of other options. It can be replaced by some other services such as S3, Bigtable, etc.

Prometheus is configured to send every metric to Cortex.
How to visualize the metrics?

Multiple visualization options (histograms, heatmap, tables, ...)

Great integration with Prometheus (also others like InfluxDB, Elastic, etc.)

Alerting

HA

SSO integration (we connected it to ATP3)

Free And Open Source

Visualization for logging and traces (also correlation between logs and metrics)

Introduce Grafana

Require a Storage to provide HA.

Each Grafana node is stateless.

Show me the money
the dashboards
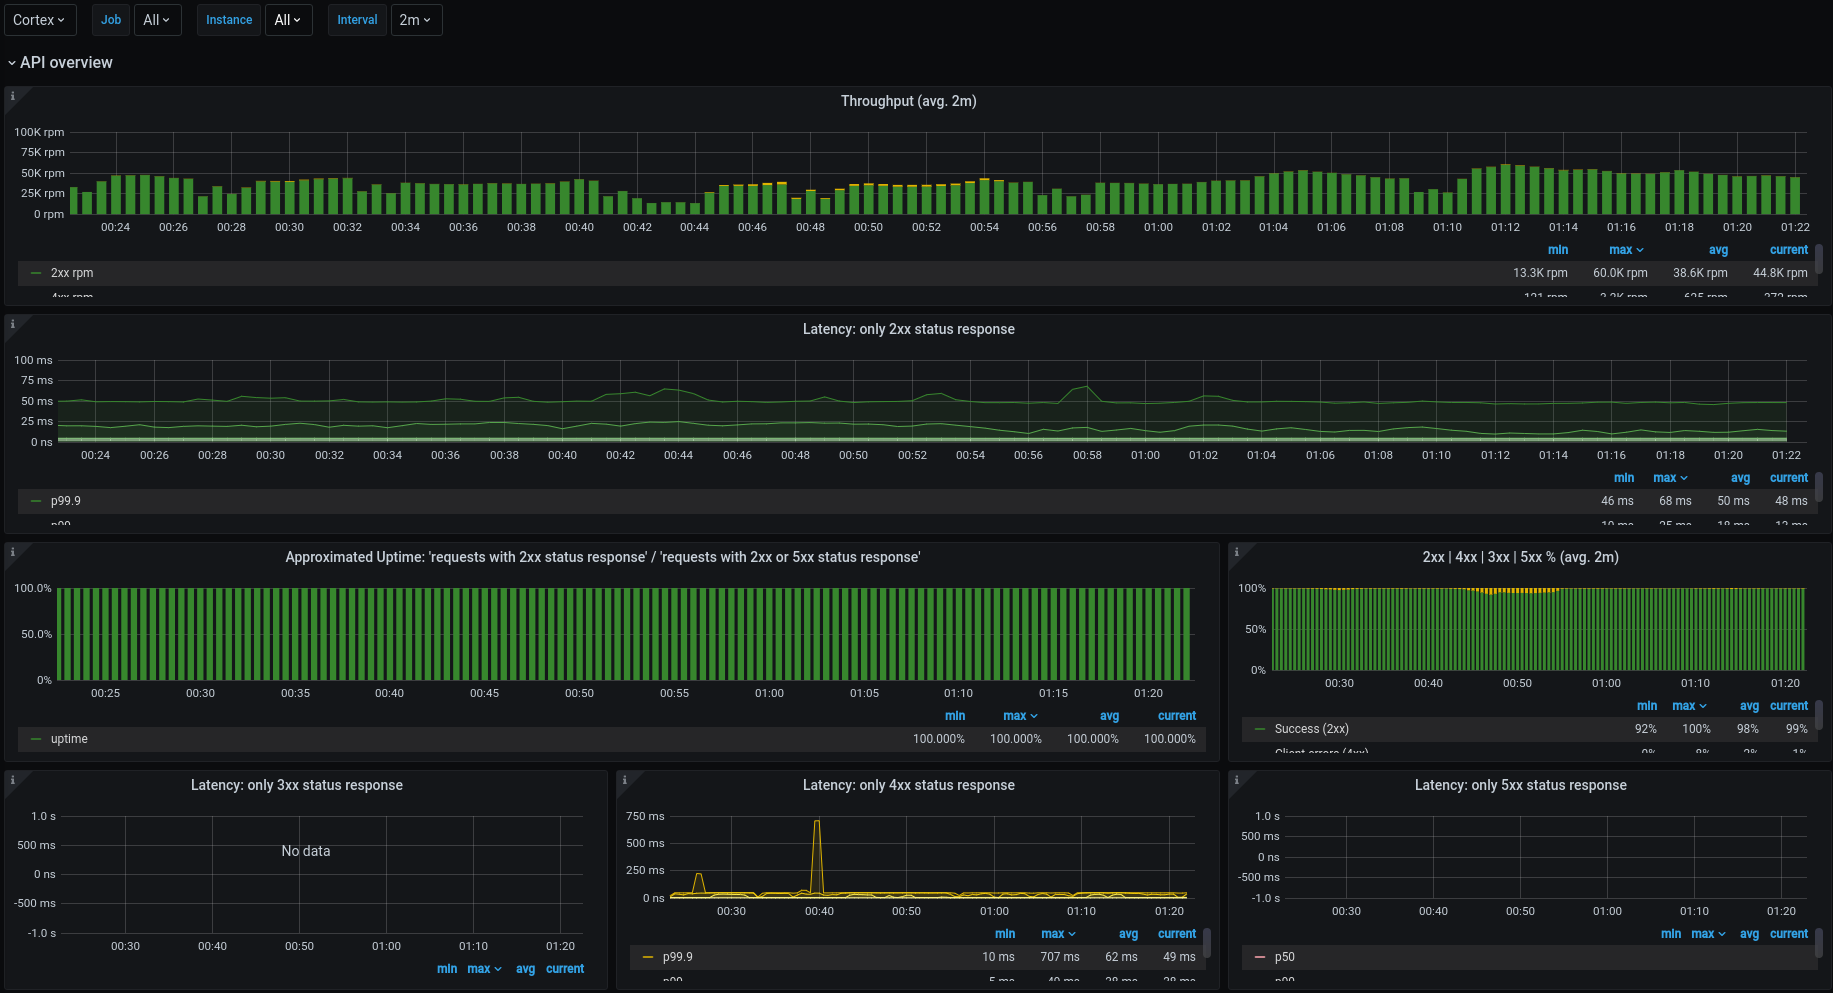
Show me the money
the dashboards

How to start to monitor my services?

Add some lib to instrument -> collect -> expose the metrics to Prometheus.
Some popular lib for JVM-based apps: Micrometer, Kamon, and so on ...

Register the new service on Consul so Prometheus can auto discover it.
It could be automatic via a Consul client running as sidecar, or manually via sending a request to Consul server.
One more option is using Prometheus-Configurer, which accept the cluster.info file to register a service on Consul.

Checks the metrics are being scraped by Prometheus
Query on the Prometheus Backoffice.
{instance=~"name-service.*"}
Configure a dashboard on Grafana
Importing a dashboard (you can find one at
Or creating a new one on your own.
Verification. Verify the endpoint is properly exposed (something like http://localhost:9090/metrics or the path that was configured)

Logs with Loki

Very cheap compared to ELK

Flexible query language with aggregations (like Prometheus)

Developed by Grafana, so a great integration with our ecosystem

HA and long-term storage

Free And Open Source

Logs and metrics in the same place: Grafana UI

Introduce Loki

Promtail collect log lines, attach to them metadata, and finally ship them to Loki

Log lines are processed by Loki, only metadata is indexed
Grafana ask to Loki for log lines

Exploring logs with Loki

Tracing with Zipkin

Applications need to be “instrumented” to report trace data to Zipkin

If you have a trace ID in a log file, you can jump directly to it


Distributed tracing system


It has its own UI
Integration with Grafana allow us to work with Loki logs and correlate them with Zipkin
Wait! What is Tracing?
A few of the critical questions that Tracing can answer quickly and easly:
Which did a request pass through?

Where are the bottlenecks?

How much time is lost due to network lag during communication between services?

What occurred in each service for a given request?


Introduce Zipkin

A Zipkin reporter running in each server, in our case Kamon-Zipkin module, ships traces to the Zipkin collector

Zipkin collector process incoming traces, index them and saves to an storage

Now data is available to query thorough Zipkin UI or Grafana

Correlating traces with logs
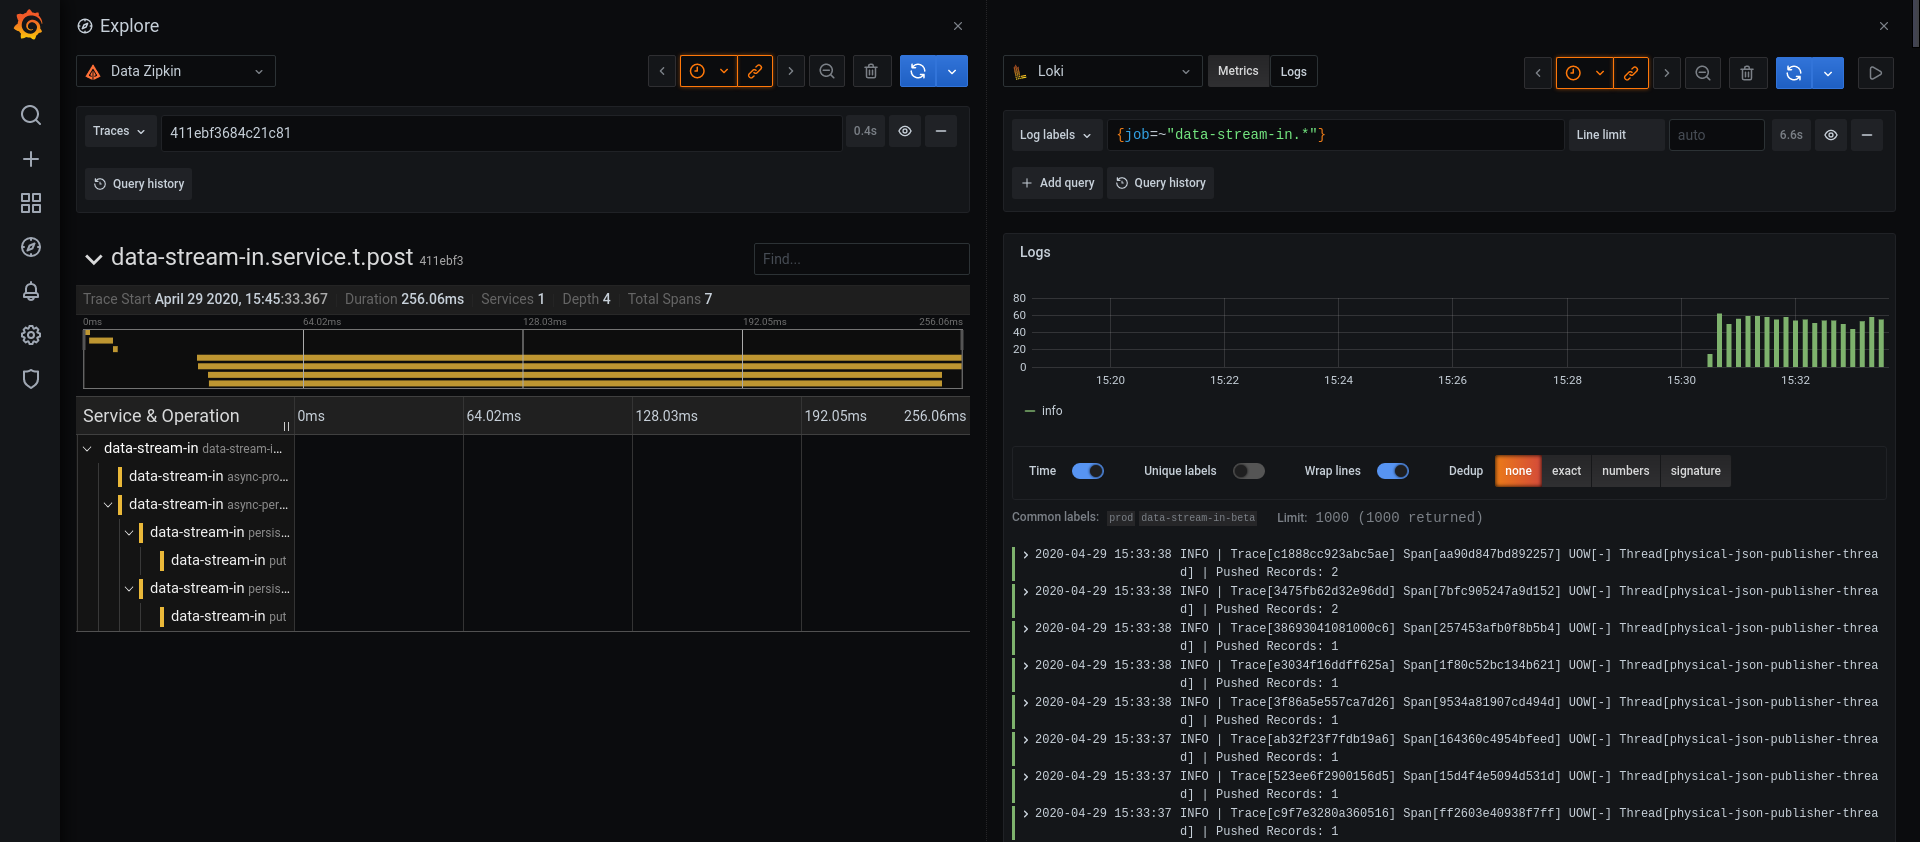
DEMO


Grafana UI
Zipkin UI
Prometheus UI
Consul UI
Cortex UI
Kamon Status
Metrics
Typical App instrumented by Kamon:


Thanks!Cristian Spinetta
@cebspinetta
@cspinetta
Lucas Amoroso
@_lucasamoroso
@lucasamoroso


Thanks!Cristian Spinetta
@cebspinetta
@cspinetta
Lucas Amoroso
@_lucasamoroso
@lucasamoroso


DEMO
