customized
ggplot2 charts
Czeller Ildi
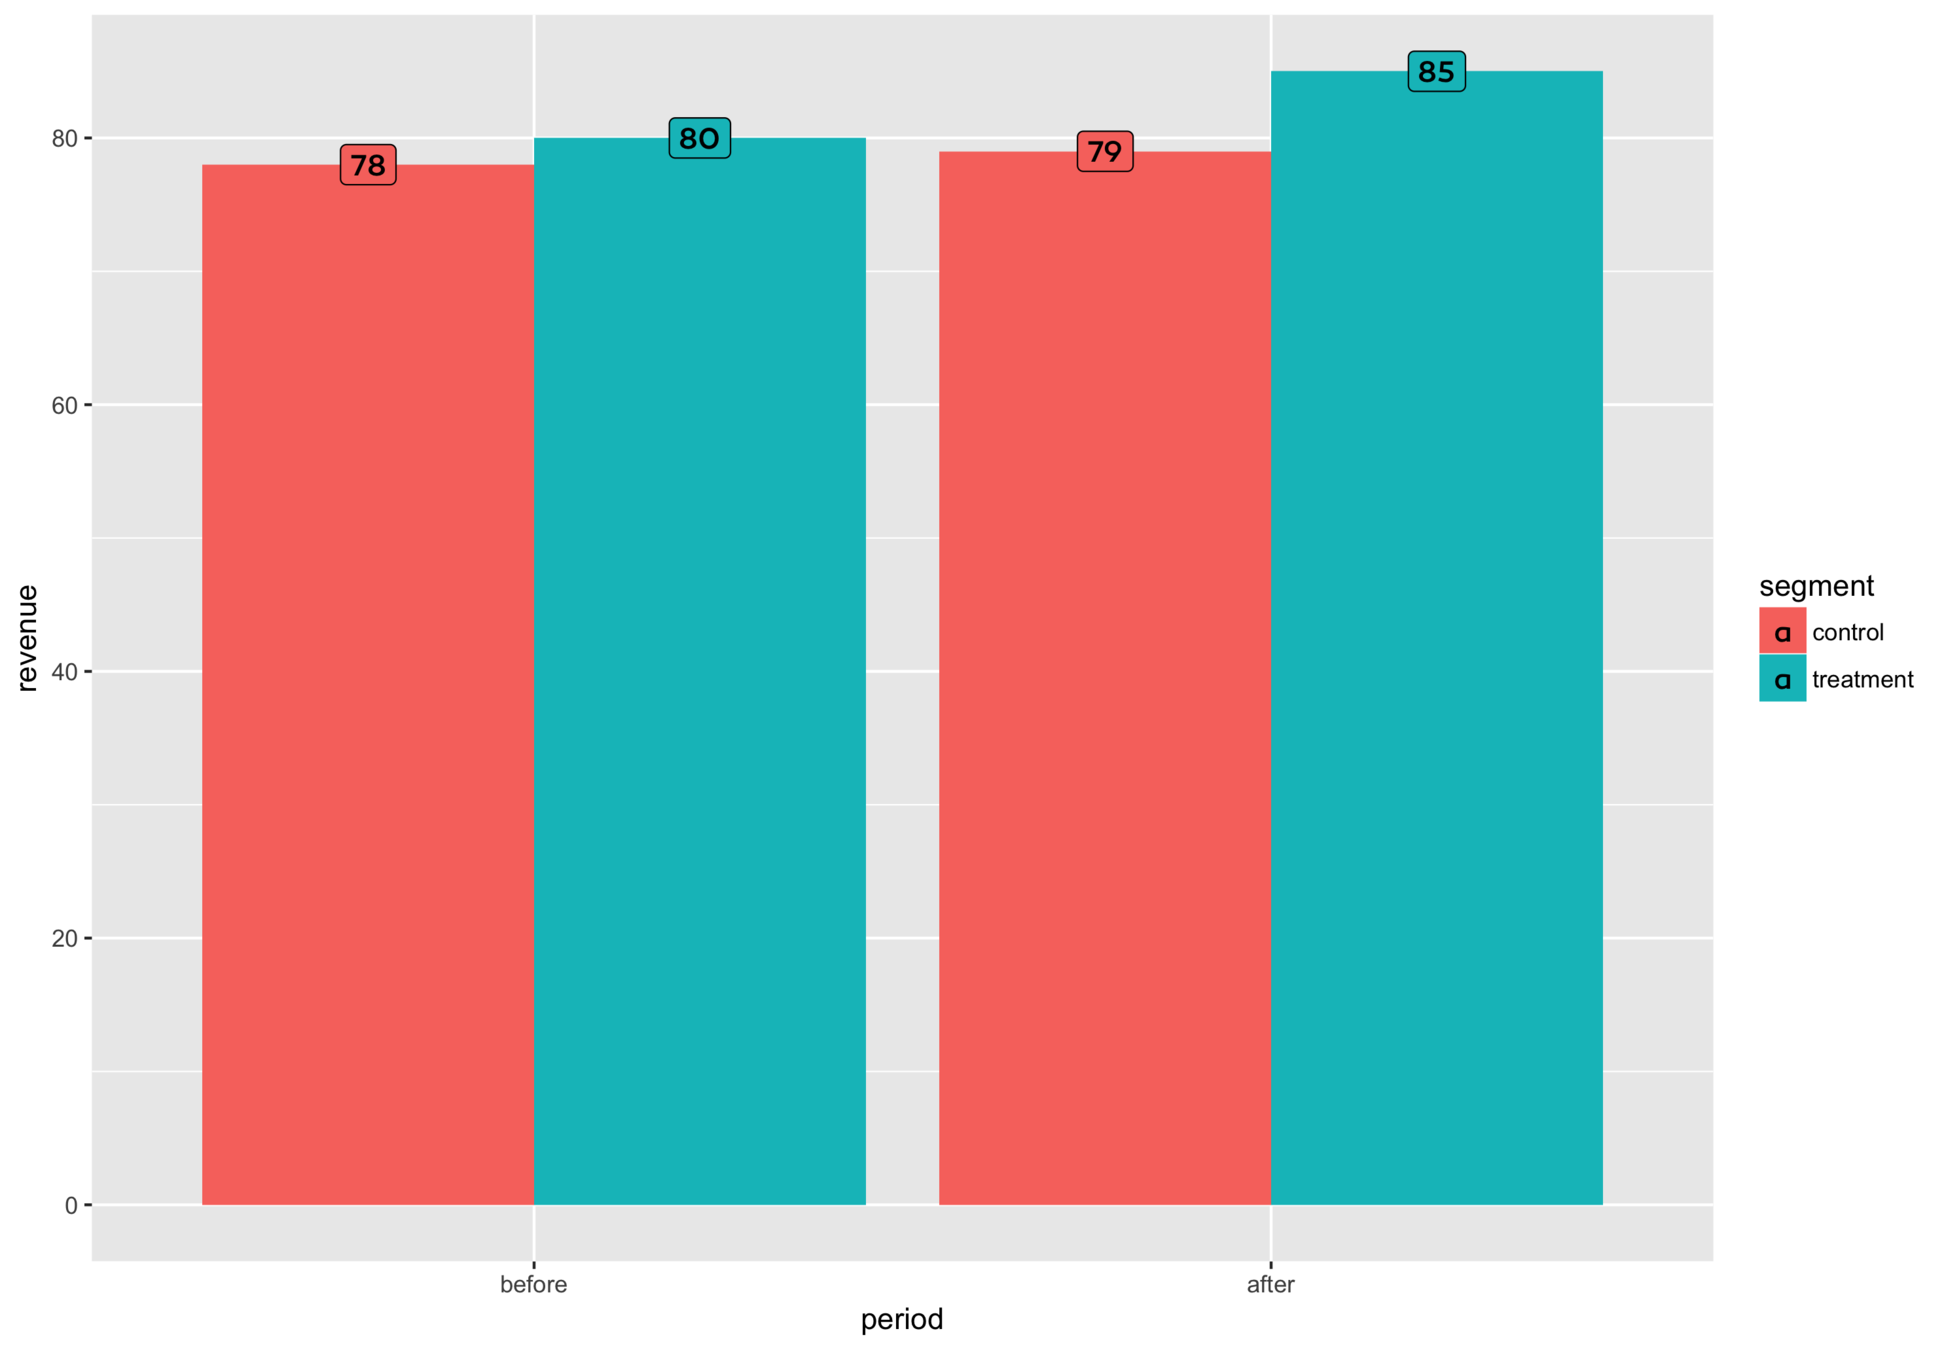
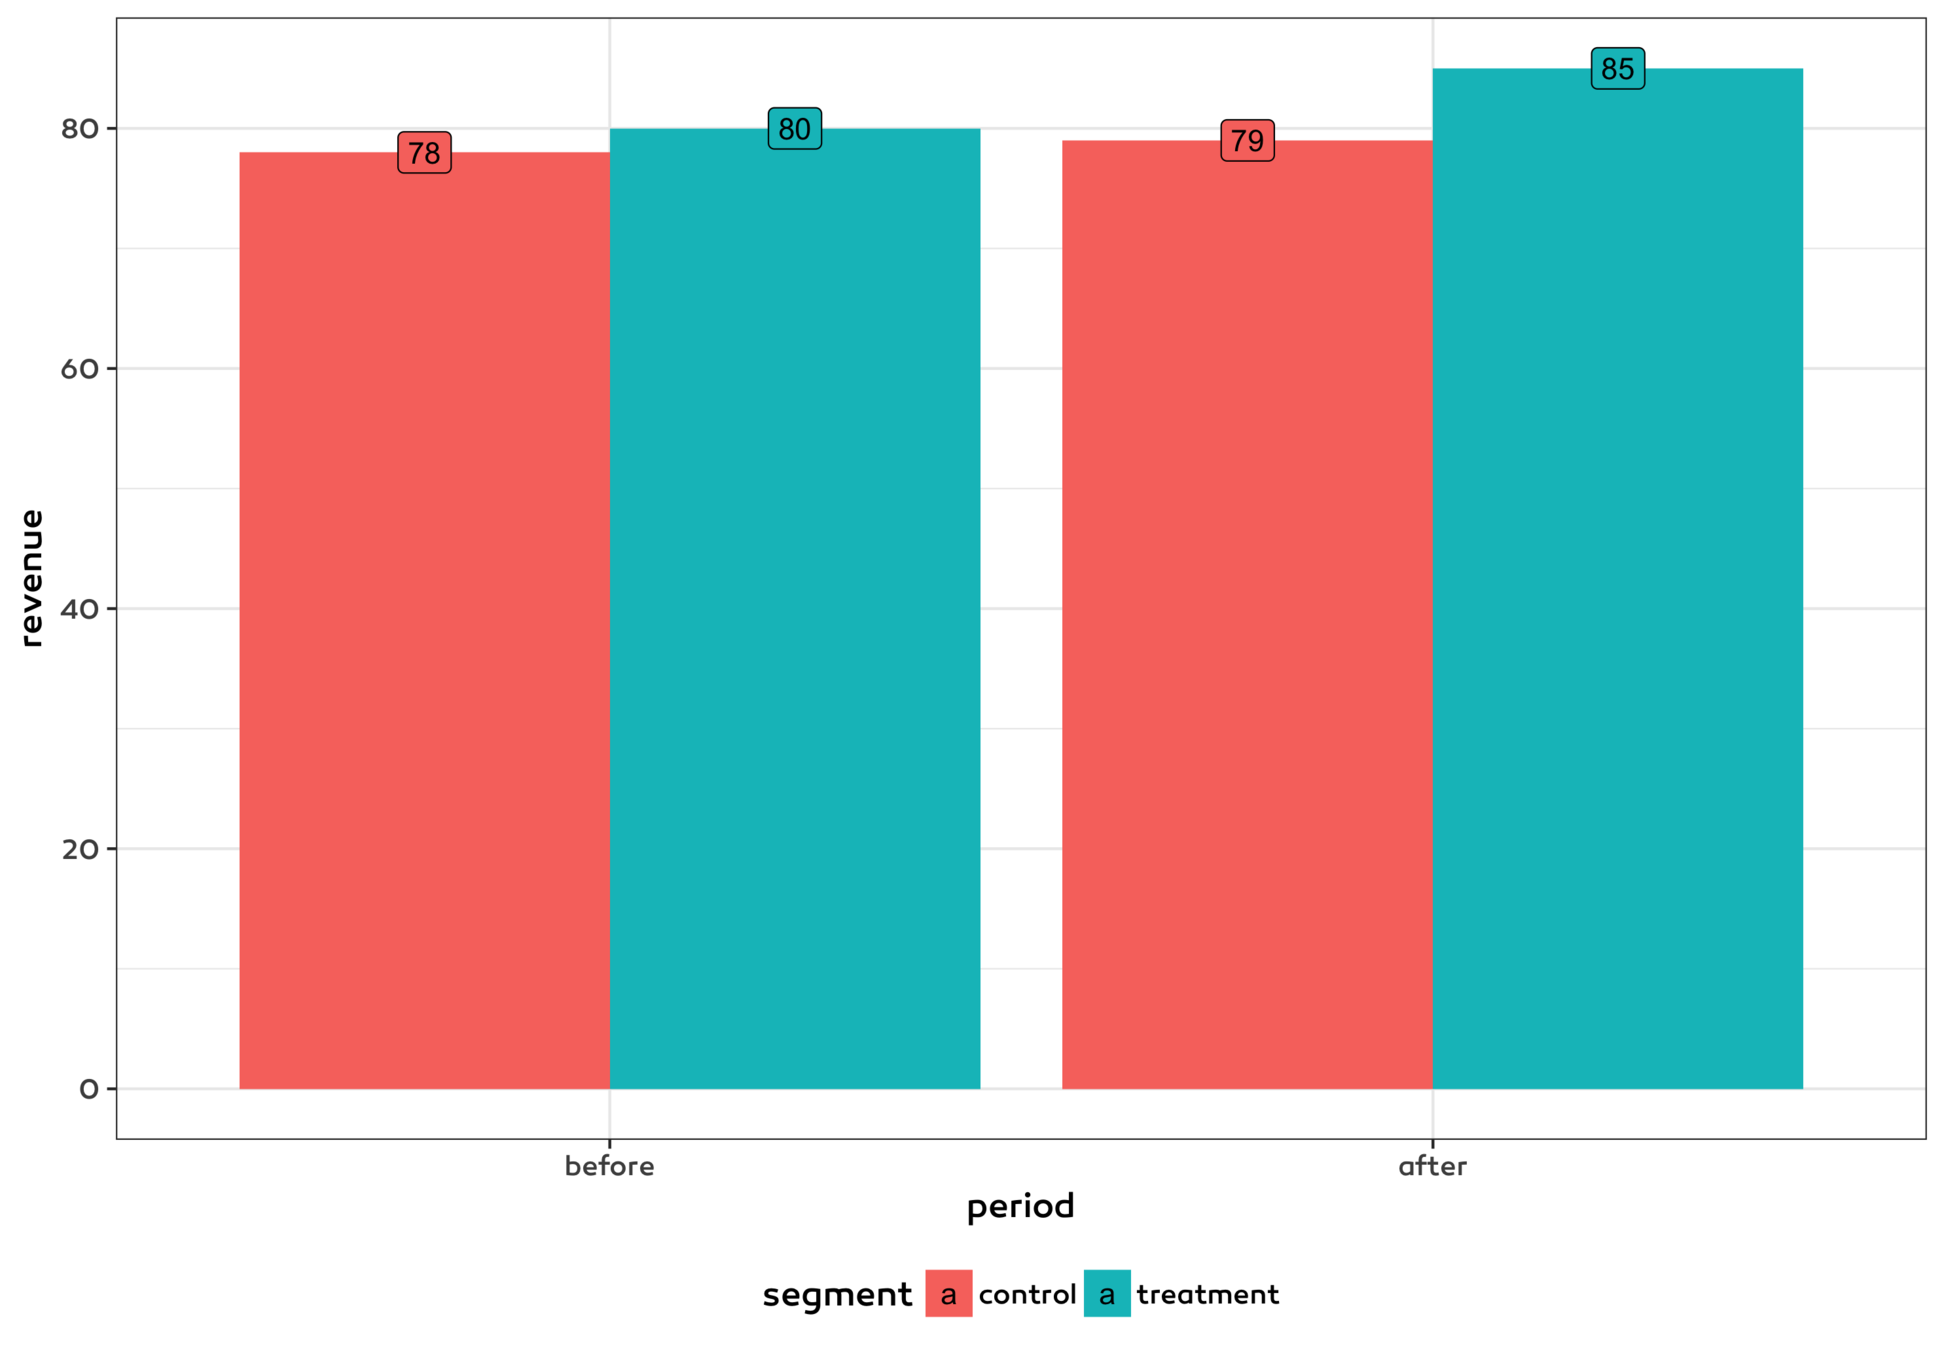
our_ggplot +
  scale_fill_manual(
    values = c(
      "treatment" = "#377EB8",
      "control" = "#E41A1C"
    )
  ) +
  geom_label(
    ...,
    family = "Canaro Medium"
  ) +
  theme_bw(
    base_family = "Canaro Medium"
  ) +
  theme(
    legend.position = "bottom"
  )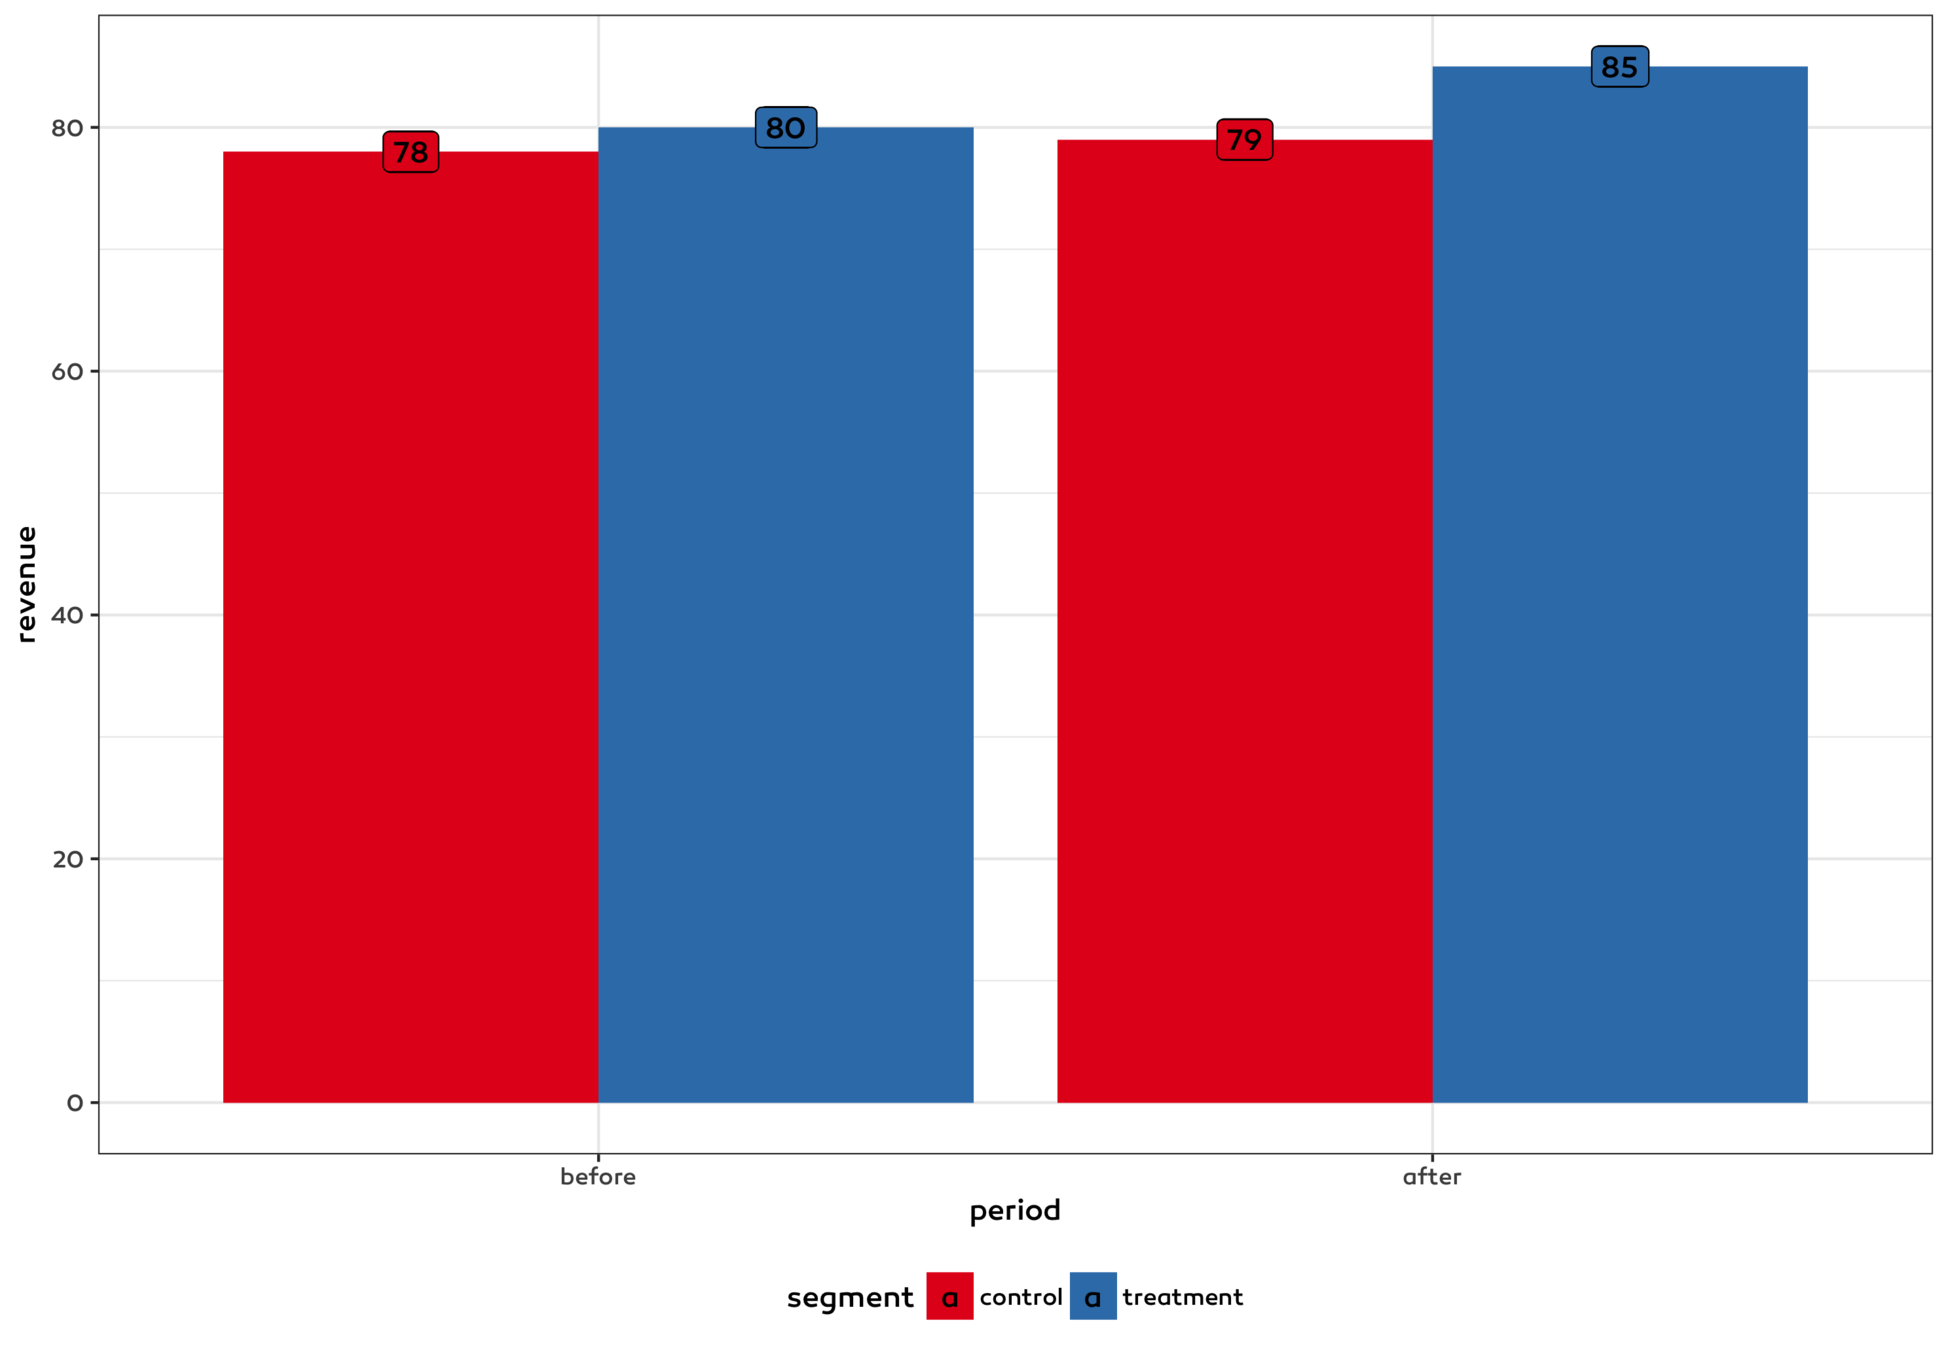
set_our_theme()

our_ggplot
set_our_theme <- function(base_size = 13) {
our_palette <- get_theme_palette()
ggthemr::ggthemr(our_palette)
ggplot2::theme_set(
theme_our(base_size = base_size)
)
update_font_defaults()
}complete theme
get_theme_palette <- function() {

    ggthemr::define_palette(
        swatch = c("#000000",
                   "#377EB8", "#E41A1C", "#4DAF4A", "#984EA3",
                   "#FF7F00", "#FFFF33", "#A65628", "#F781BF"),
        gradient = c(lower = "#377EB8", upper = "#E41A1C")
    )

}
colour palette
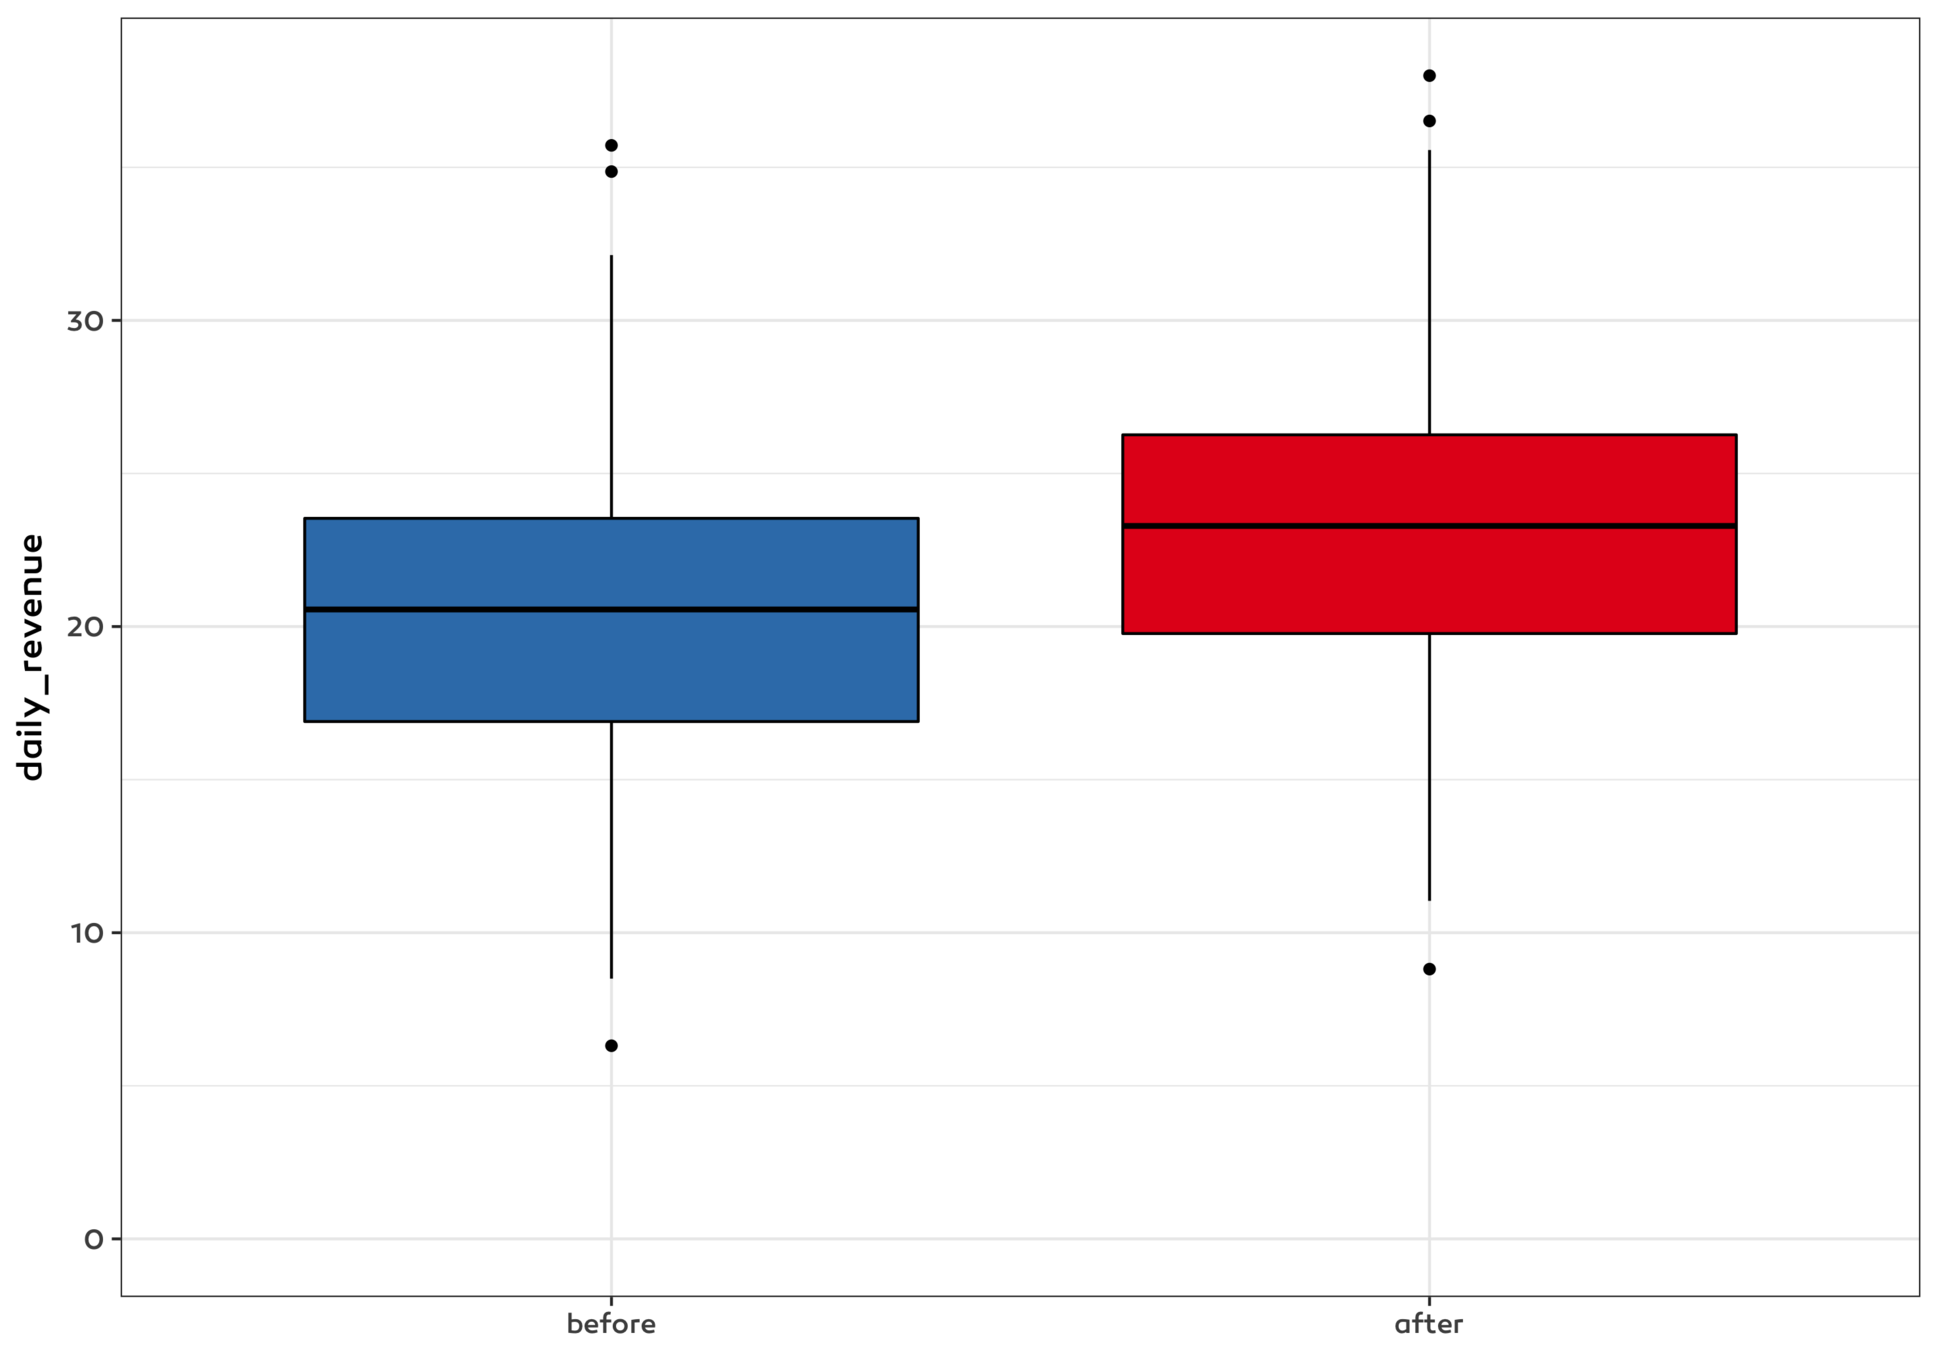
2 levels, 3 colours

discrete colour scale
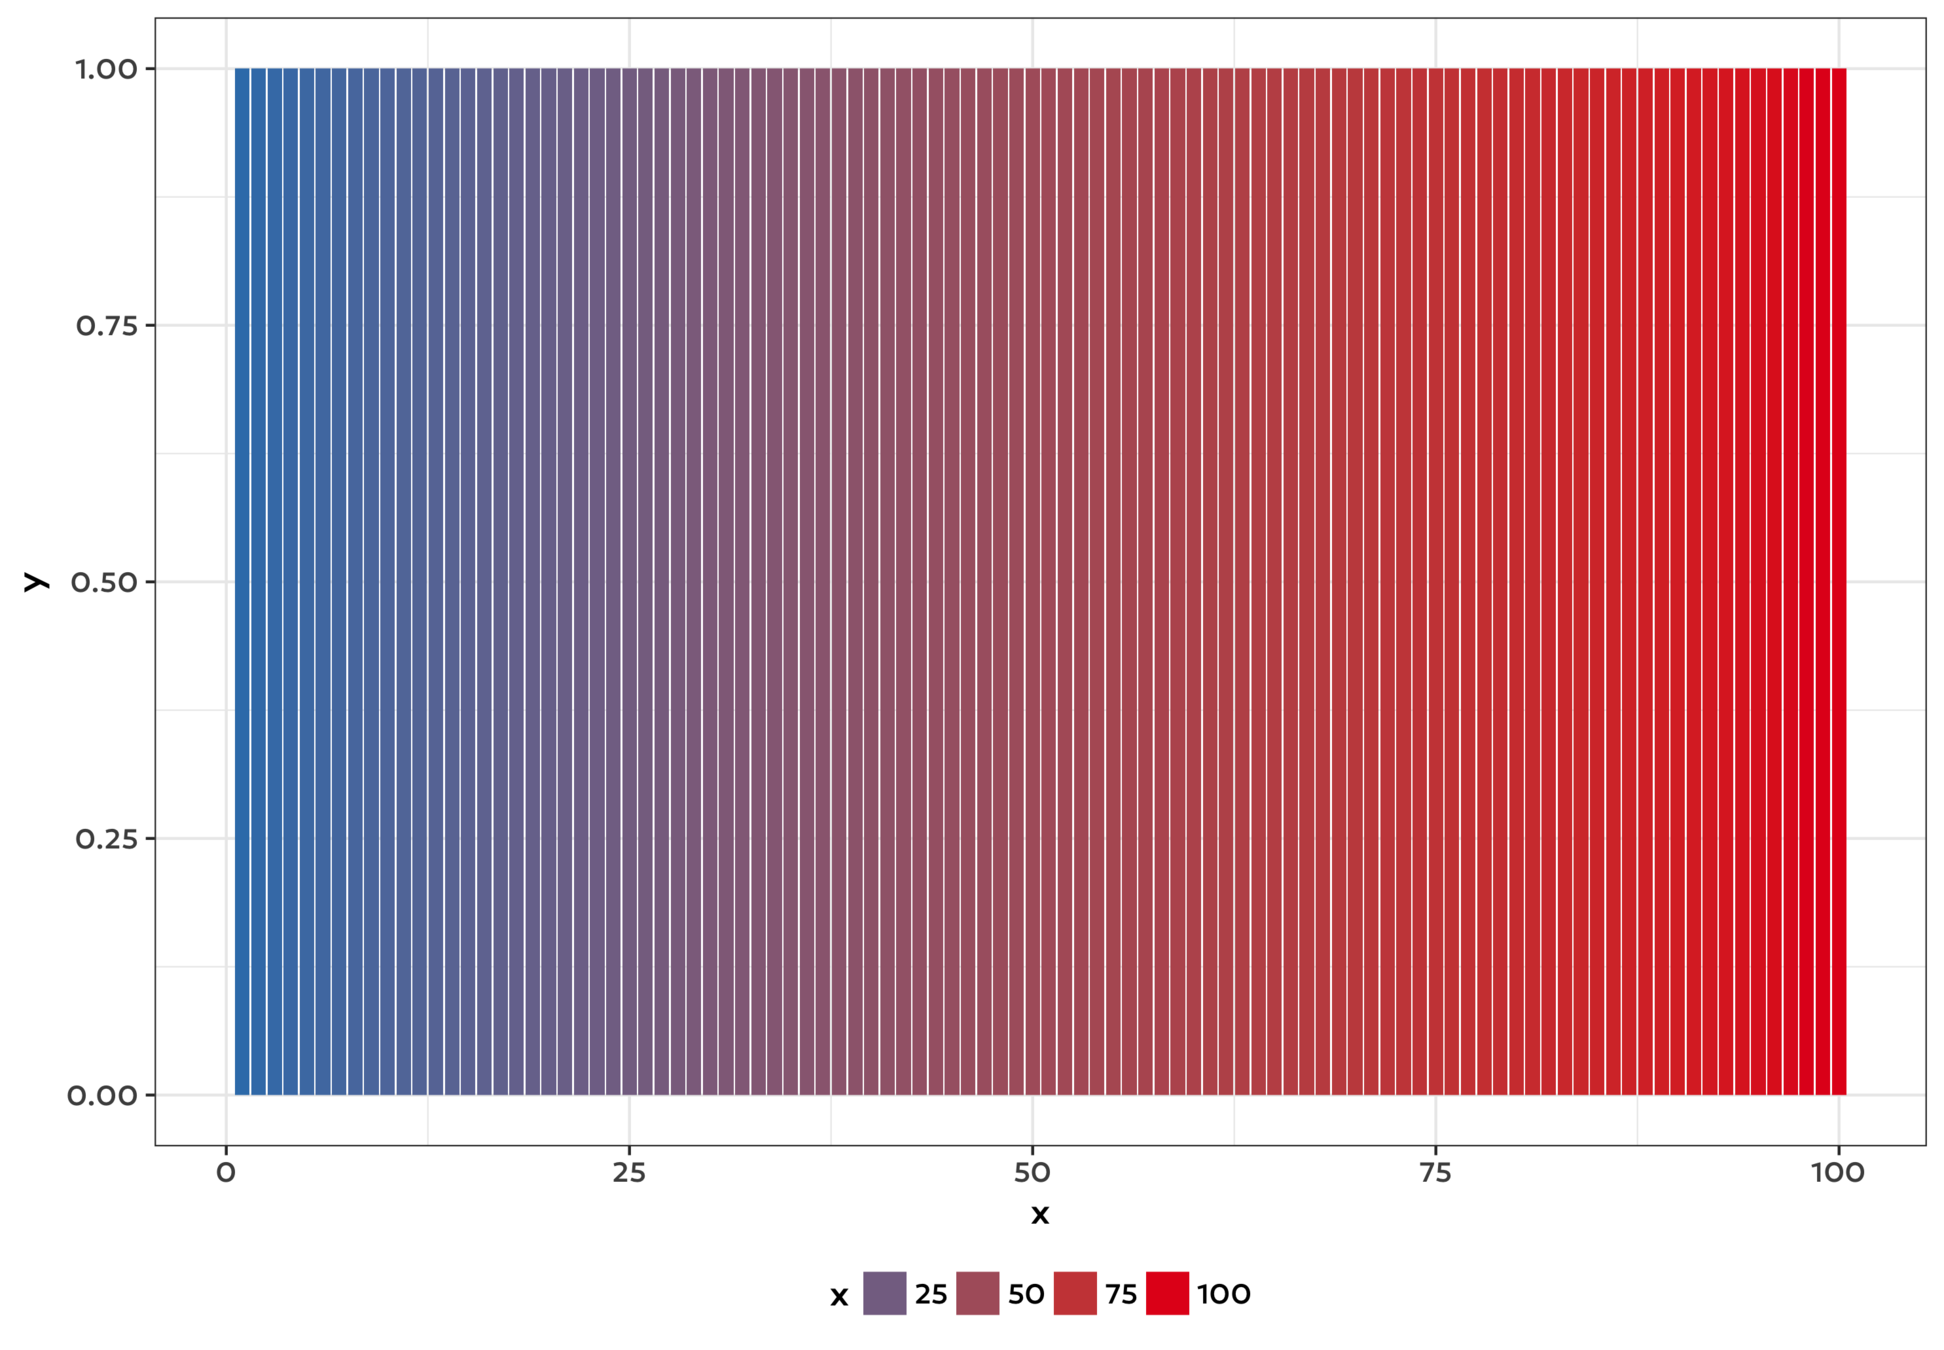
continuous colour scale
theme_our <- function(base_size = 13) {

    theme_bw(base_size, base_family = "Canaro Medium") +
        theme(legend.position = "bottom")

}
update_font_defaults <- function() {
    update_geom_defaults("text", list(family = "Canaro Medium"))
    update_geom_defaults("label", list(family = "Canaro Medium"))
}