Node.js Performance Monitoring
a DIY approach
daniel@khan.io | @dkhan
https://github.com/danielkhan/InstrumentationExample.git

Our C++ folks ...

daniel@khan.io | @dkhan
Famous sources of performance problems in Node.js applications
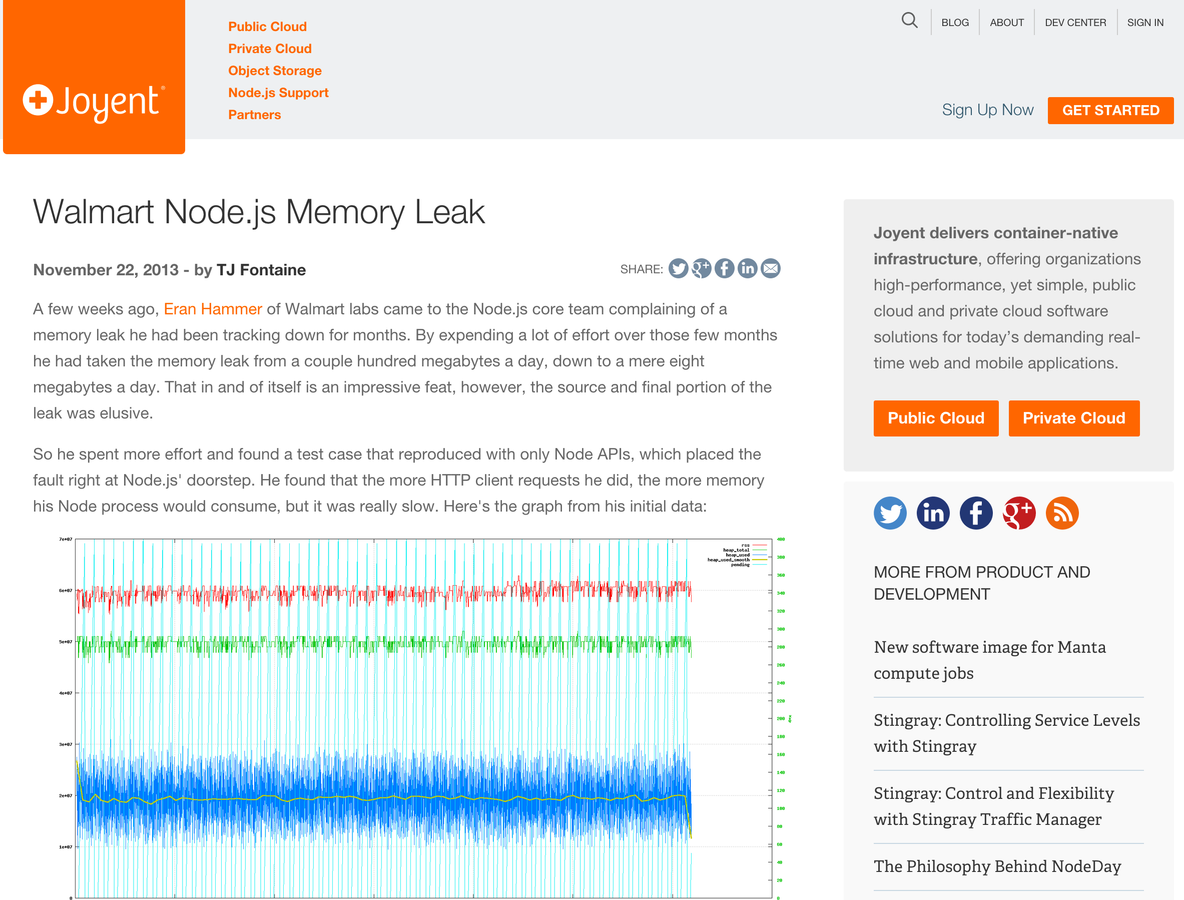
The Memory Leak
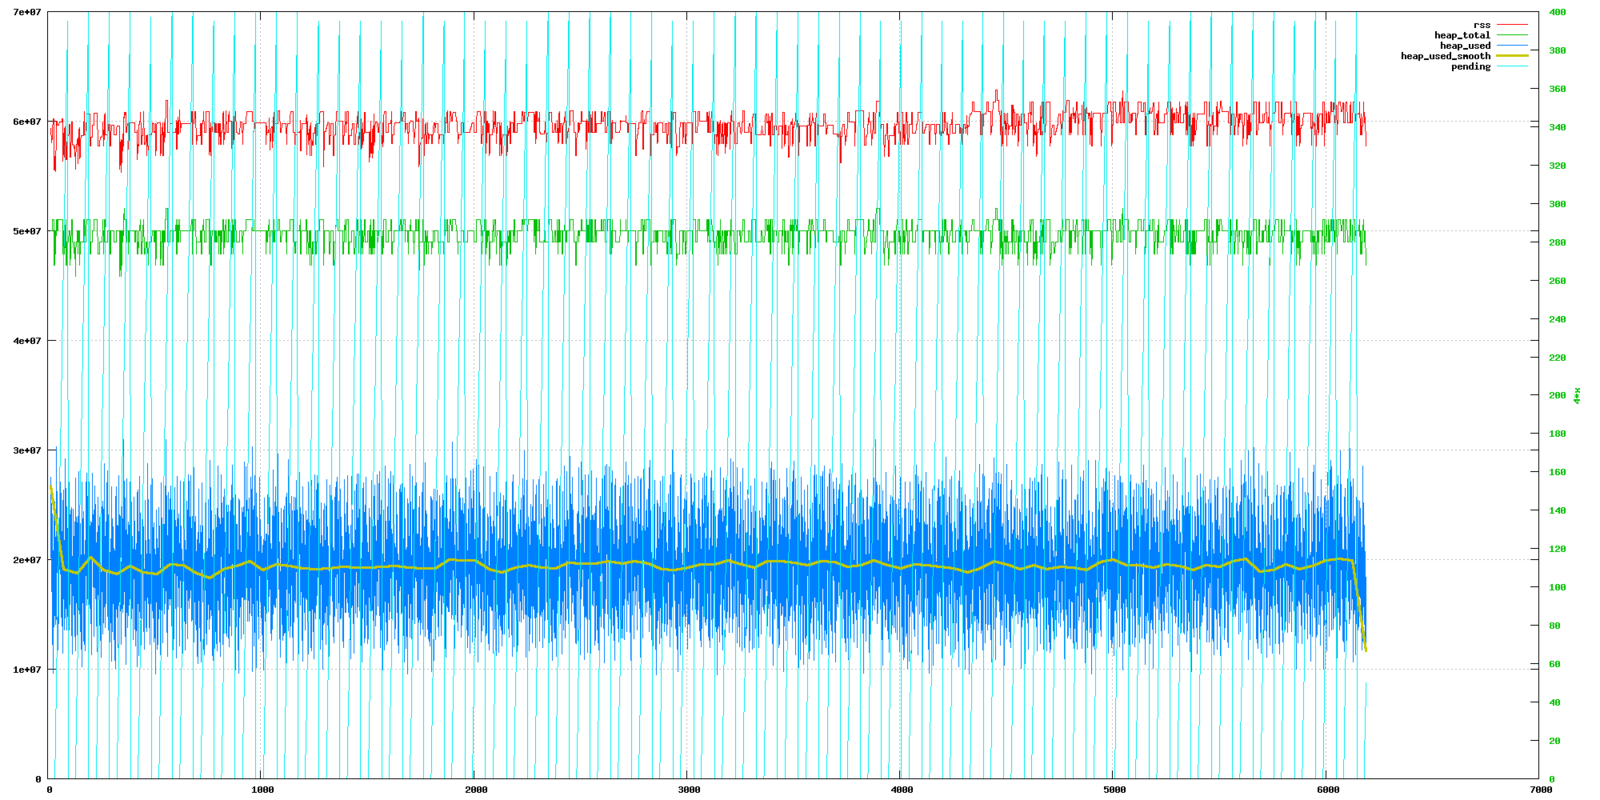
Heap
daniel@khan.io | @dkhan
The CPU Hog
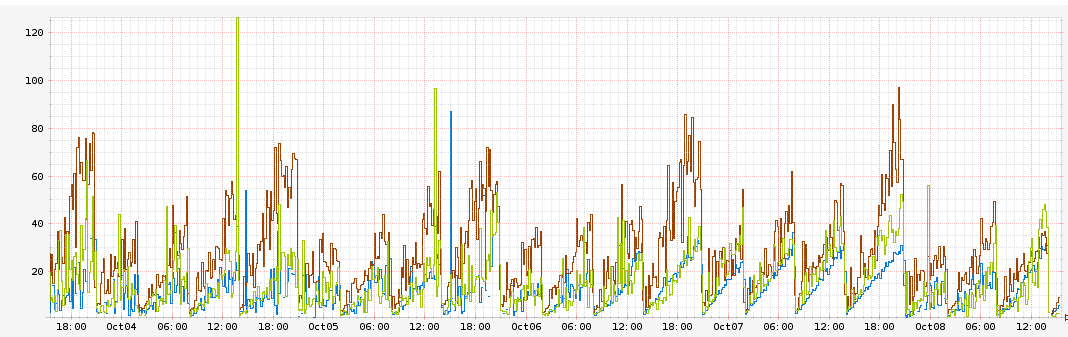
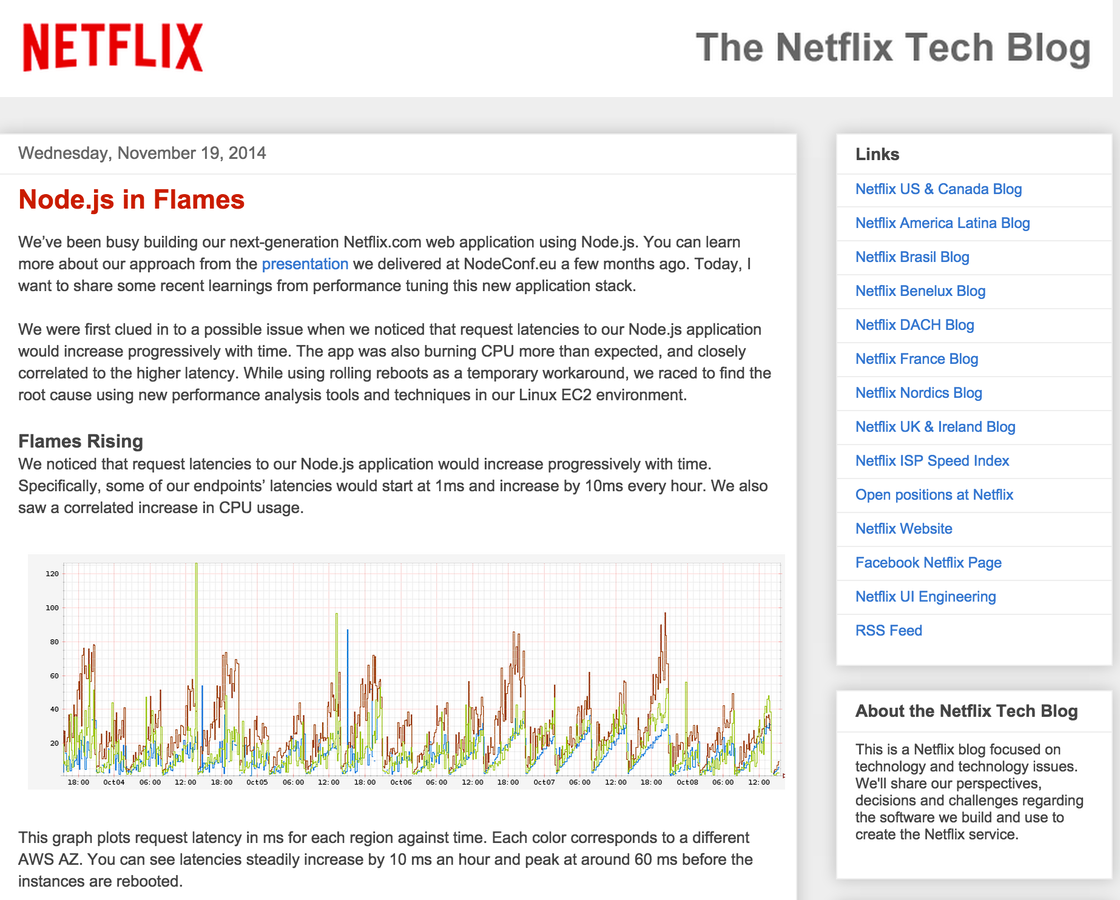
Latency
daniel@khan.io | @dkhan
The moment when you find out about the problem ...
daniel@khan.io | @dkhan
daniel@khan.io | @dkhan
daniel@khan.io | @dkhan
My take on performance monitoring
"Let's find out about problems before my customers do"
daniel@khan.io | @dkhan
Tool Time
nodemon

daniel@khan.io | @dkhan
nodemon
v8-profiler
v8::HeapSnapshot
v8::CpuProfile

daniel@khan.io | @dkhan
Memory leak detection
var fs = require('fs');
var profiler = require('v8-profiler');
var _datadir = null;
var nextMBThreshold = 0;

// .......
// Schedule heapdump attempt every x seconds
// .......

function heapDump() {
    var memMB = process.memoryUsage().rss / 1048576;
    if (memMB > nextMBThreshold) {
        console.log('Current memory usage: %j', process.memoryUsage());
        nextMBThreshold += 100;
        var snap = profiler.takeSnapshot('profile');
        saveHeapSnapshot(snap, _datadir);
    }
}

function saveHeapSnapshot(snapshot, datadir) {
    var buffer = '';
    var stamp = Date.now();
    snapshot.serialize(
        function iterator(data, length) {
            buffer += data;
        }, function complete() {

            var name = stamp + '.heapsnapshot';
            fs.writeFile(datadir + '/' + name , buffer, function () {
                console.log('Heap snapshot written to ' + name);
            });
        }
    );
}daniel@khan.io | @dkhan
Current memory usage: {"rss":4357156864,"heapTotal":921054976,"heapUsed":870913648}
var express = require('express');
var router = express.Router();
var theThing = null;
var replaceThing = function () {
var originalThing = theThing;
var unused = function () {
if (originalThing) console.log("hi");
};
theThing = {
longStr: new Array(1000000).join('*'),
someMethod: function () {
console.log('someMessage');
}
};
};
router.get('/leak', function (req, res, next) {
replaceThing();
return res.json({message: 'Everything is fine!'})
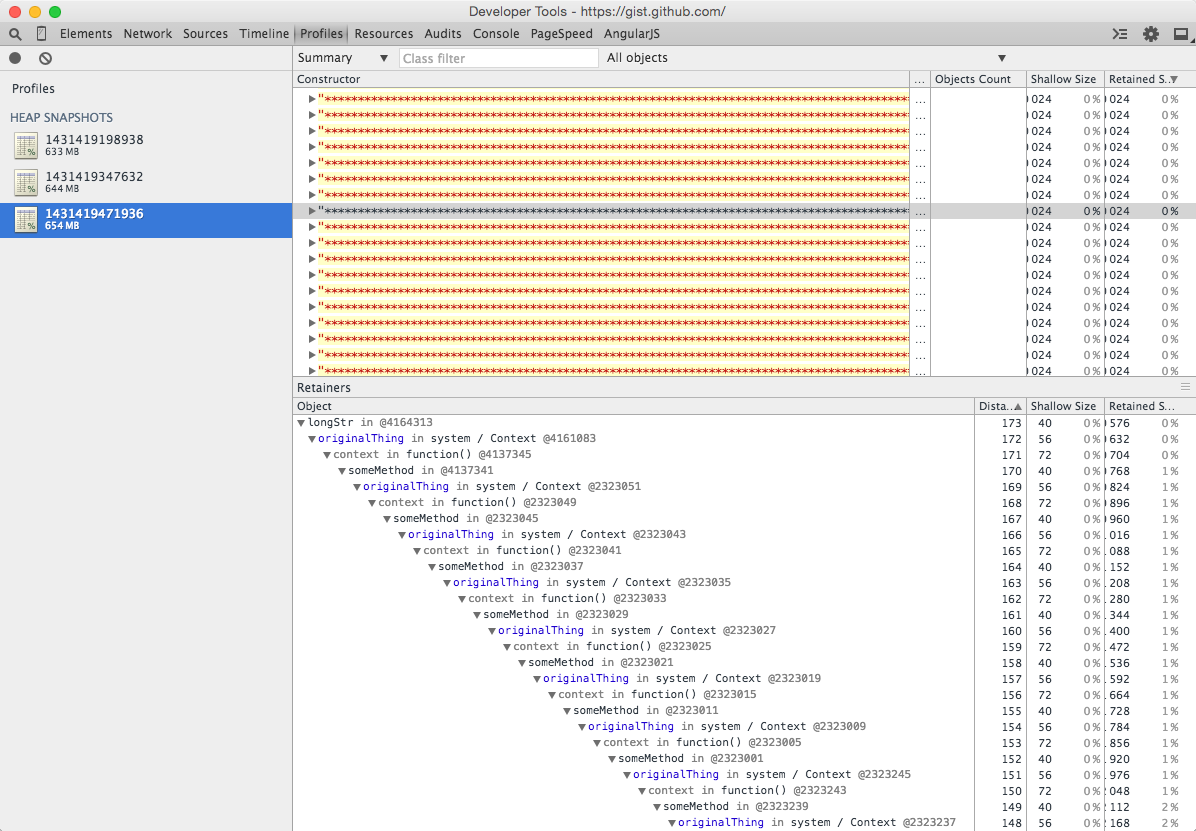
});Meet our Leak
daniel@khan.io | @dkhan
daniel@khan.io | @dkhan
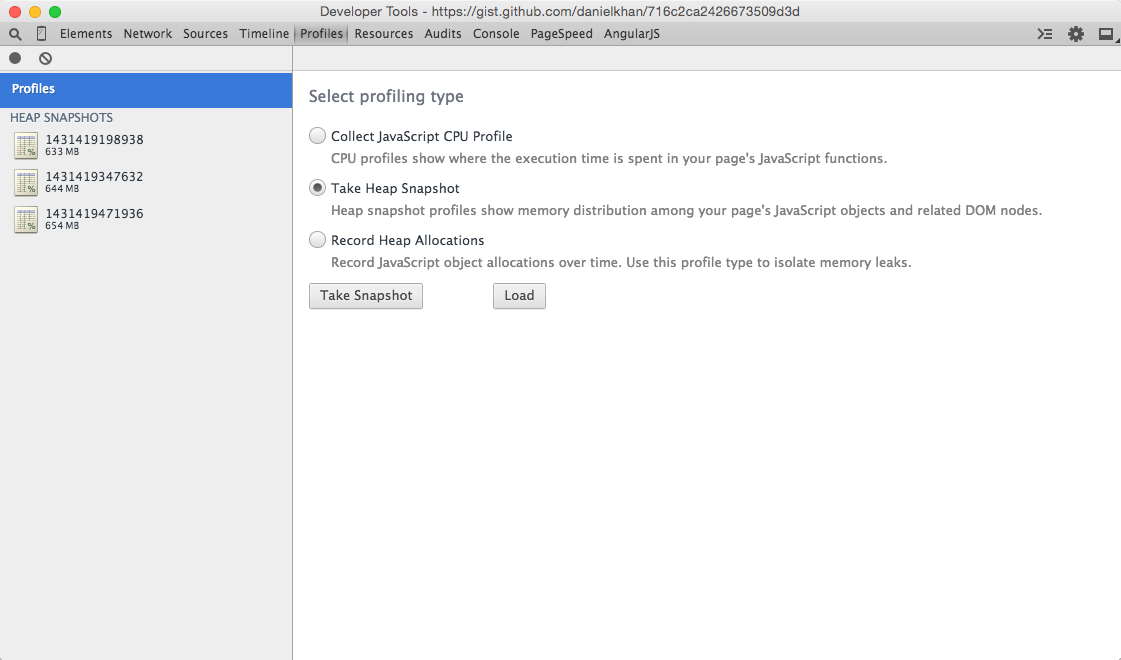
Chrome Developer Tools
daniel@khan.io | @dkhan
daniel@khan.io | @dkhan
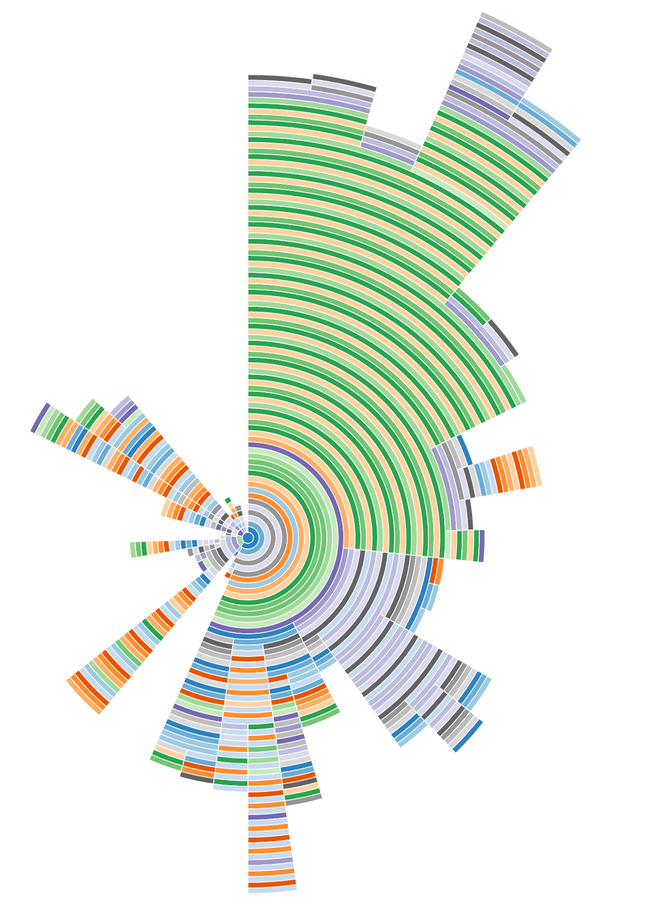
CPU hog detection
// ........

/**
 * Starts profiling and schedules its end
 */
function startProfiling() {
    var stamp = Date.now();
    var id = 'profile-' + stamp;

    // Use stdout directly to bypass eventloop
    fs.writeSync(1, 'Start profiler with Id [' + id + ']\n');

    // Start profiling
    profiler.startProfiling(id);

    // Schedule stop of profiling in x seconds
    setTimeout(function () {
        stopProfiling(id)
    }, 1000);
}

/**
 * Stops the profiler and writes the data to a file
 * @param id the id of the profiler process to stop
 */
function stopProfiling(id) {
    var profile = profiler.stopProfiling(id);
    fs.writeFile(_datadir + '/' + id + '.cpuprofile.json', JSON.stringify(profile), function () {
        console.log('Profiler data written');
    });
}daniel@khan.io | @dkhan
var primCalculator = function(start, end){
    var primes = [];
    for(var number = start; number < end; number++){
        var primeNumberDividers = []; //there should only be 2: 1 & number
        for(var divider = 1; divider <= number; divider++){
            if(number % divider === 0){
                primeNumberDividers.push(divider);
            }
        }
        if(primeNumberDividers.length === 2){
            primes.push(number);
        }
    }
    return primes;
};

router.get('/blocking', function(req, res, next) {
    return res.json(primCalculator(10000, 100000));
});
Let's create a CPU hog
daniel@khan.io | @dkhan

daniel@khan.io | @dkhan
daniel@khan.io | @dkhan


daniel@khan.io | @dkhan

Thank you!
daniel@khan.io
@dkhan
Slides
http://bit.ly/1E3B4YB