Detecting Memory Leaks in Node.js
Dara Hayes
dara.hayes@redhat.com
@darahayess
@darahayes


That's me!

Let's talk about V8
Resident Set
Code
Stack
Pointers, Primitive types
Heap
Objects, Strings, Closures
Used Heap
V8 Memory Scheme
process.memoryUsage()

{
  rss: 21561344,
  heapTotal: 10522624,
  heapUsed: 4110504
}

Garbage Collection
Heap
Young Space (1-8MB)
Young Space and Old Space in V8 Heap
Old Space
New allocations
Scavenge Garbage Collection
More Frequent, Much Faster GCs
Objects that Survived 2 GCs in Young Space
Mark-Sweep Collection
Less Frequent, Pauses All JS Execution
Scavenge GC
- Occurs in young space.
- Cheney's Algorithm
- Frequent and fast.
Mark-Sweep GC
- Occurs in old space
- Mark, Sweep, Compact
- Less frequent, pauses all JS execution (generally)
node --trace-gc index.js
Let's find a memory leak
aka demo time :)
const http = require('http')

const server = http.createServer((req, res) => {
 for (var i=0; i<1000; i++) {
   server.on('request', function leakyfunc() {})
 }

 res.end('Hello World\n')
}).listen(1337, '127.0.0.1')

server.setMaxListeners(0)
1. Create heap dumps at different time intervals
2. Compare the dumps to see growth areas
It's so Simple!
Tools We Can Use
const memwatch = require('memwatch-next')

memwatch.on('leak', function (info) {
  console.log('Memory leak detected:\n', info)
})
‘A leak event will be emitted when your heap usage has increased for five consecutive garbage collections.’
A fork of the outdated memwatch module.
Last published 2 years ago but it works on Node 8.
--inspect
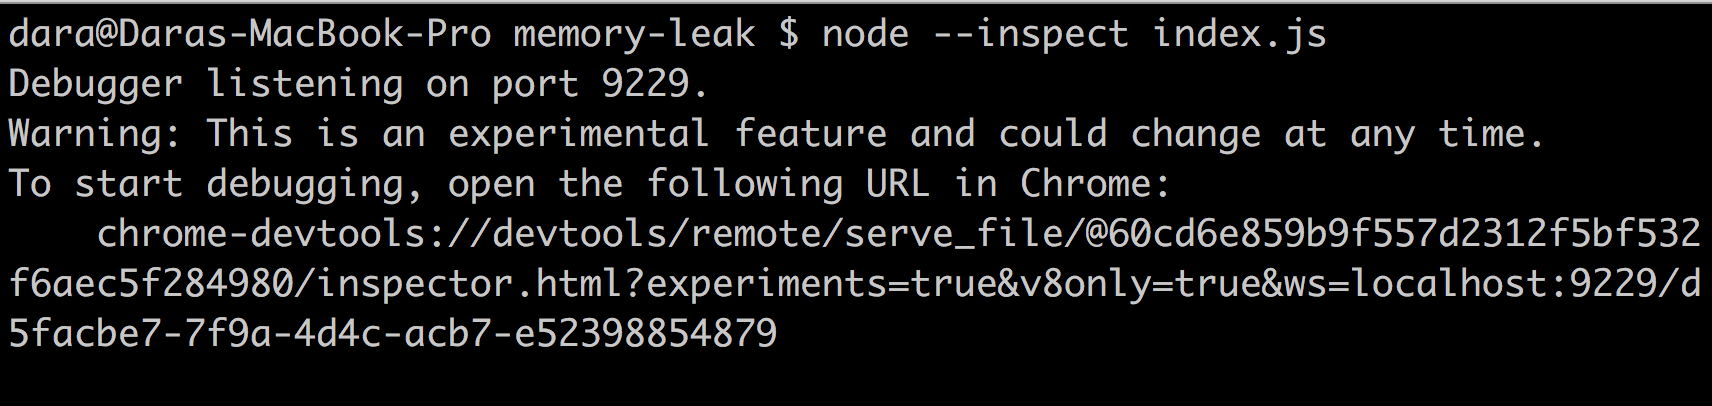
Debug your node process in Chrome dev tools
Create heap dumps
Only available in Node v6+
Otherwise use npm.im/node-inspector
const heapdump = require('heapdump')

heapdump.writeSnapshot((err, filename) => {
  if (err) console.error(err)
  else console.log('Wrote snapshot: ' + filename)
})Snapshots can be opened in dev tools.
Can be triggered by sending SIGUSR2 signal.
demo
Are there low level tools out there?
Take Core Dumps of Your Node Process
--abort-on-uncaught-exception
# Create a core dump when process crashes
gcore <pid>
# Low level tool to create dumps
Inspect Core Dumps with Low Level Debugging Tools
Things to Consider
-
Snapshots are expensive on CPU and Memory.
-
Try to find leaks in a test environment
-
If using something like memwatch in prod, make sure leaks are picked up by alerting tools
-
Consider other ways of tracking memory e.g. process.memoryUsage()
-
Beware of false positives
end ☕️