Protein Prediction 2 - Exercise
Visualizing biological data on the Web


Your Mentors


Tatyana Goldberg
Juan Miguel Cejuela
Student Assistant


David
Seb
Exercise Website
CONTACT US
Resources & Readings
Course Book: Interactive Data Visualization for the Web by Scott Murray (2013)
More useful resources will be posted on the Wiki - stay up to date!
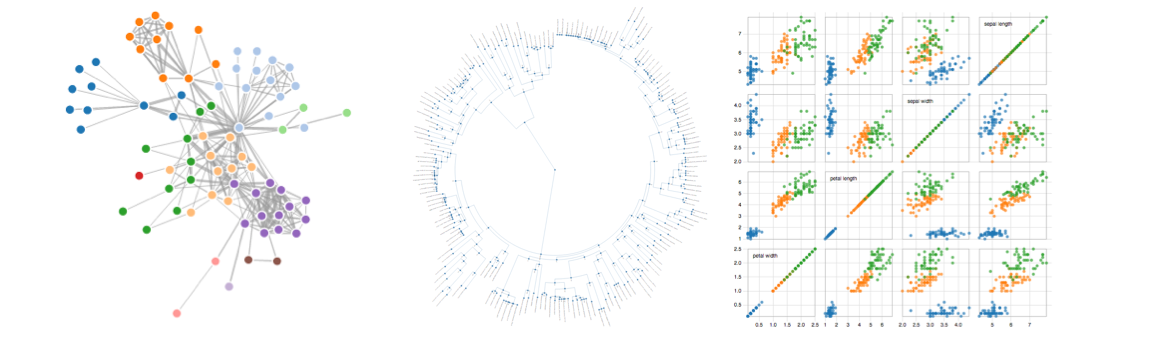
GOAL : Interactive Visualization OF BIOLOGICAL DATA
Schedule
Oct 16 - Introduction, BioJS, Technology Fundamentals (HTML, CSS, SVG)
Oct 23 - Technology Fundamentals (JavaScript, Git)
Oct 30 - Introduction to Interactive Data Visualization with D3
Nov 06 - Visualization: Best Practices
Nov 13 - Project Proposal
Nov 20 - Supervised Team Meeting
Dec 03 - Supervised Team Meeting
Dec 17 - Supervised Team Meeting
Jan 08 - Final Project Presentation (Prof. Rost)
Jan 15 - Submission to BioJS, Documentation
Project Phase
Theory Phase
Grading
Exercise 60 %
Exam 40 %
Criteria FOr EXercise GRADING
Homework and participation in the exercise
Short biweekly update (~5min) of your progress during project phase
The implementation of your final project
Its clear and complete documentation
Final presentation of the component to the group including Prof. Rost (~10min)
Homework ONE (Everyone)
- Create a GitHub Account
- Make a Website (Codecademy)
- Make an Interactive Website (Codecademy)
- Find a Group (2-3 People) and think of a supercool Groupname (otherwise random)
- Fill in this Form
(Optional) Publish your Website (i.e. via GitHub Pages)
Very Good Websites will be presented in the Exercise (Fame!).
Final Project (TEAM)
An Interactive Visualization for Biological Data for the Web
- Hosted on GitHub (Teamwork)
- JavaScript and D3 is the official Framework, but you can use any programming language you like (however no support from us!)
- Project Roadmap
- Biweekly Meetings
- Final Presentation
- Will be submitted to BioJS & the Community
- Very good visualizations will be published in a scientific journal (super good for your CV!)
INtroducing BioJS
Project Coordinator Dr. Manuel Corpas (TGAC)