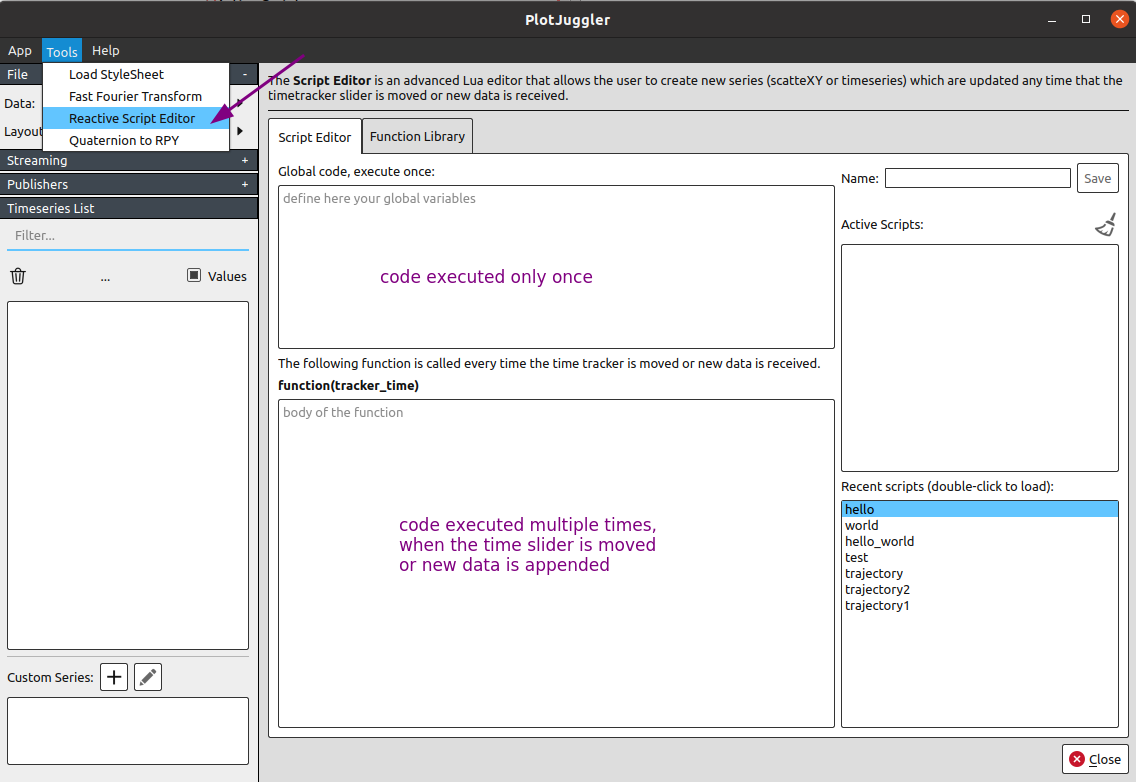
Series from Reactive Scripts in PlotJuggler
Understanding the problem they solve
To use an analogy from databases, we may say that PlotJuggler works with column-oriented series.
Given a message called "position" with theses fields:
The following timeseries will be created when multiple messages are received at time t:
| Field | Value |
|---|---|
| X | ... |
| Y | ... |
| Z | ... |
| position/x | t1; x1 | t2; x2 | t3; x3 | ... |
| position/y | t1; y1 | t2; y2 | t3; y3 | ... |
| position/x | t1; x1 | t2; x2 | t3; x3 | ... |
| position/z | t1; z1 | t2; z2 | t3; z3 | ... |
But what if a single message contain an array of values?
Considered this hypothetical "Trajectory2D" message, that contains an array of X/Y positions.
In this case, we may talk about row-oriented series.
Any single message should create an entire ScatterXY series, using:
- pos/x on the horizontal axis and
- pos/y on the vertical one.
| Field | Value |
|---|---|
| node.0/pos/x | ... |
| node.0/pos/y | ... |
| node.1/pos/x | ... |
| node.1/pos/y | ... |
| node.2/pos/x | ... |
| node.2/pos/y | ... |
| node.3/pos/x | ... |
| node.3/pos/y | ... |
| ... | .... |
Why is this more difficult for PlotJuggler?
- PlotJuggler can not make assumptions about the way the X/Y pairs should be extracted. Any message might be packed in a different way.
- What should we do when a new message is received or when the time-tracker is moved? Overwrite the series or append to it?
- What if you want to apply a specific operation such as "capture only a range" or "downsample and take one every N points"?
Solution: the Reactive Scripts Editor
"Reactive scrips" are Lua script which are executed every time:
- New data is received.
- The time-tracker slider is moved.
Inside these scripts, you can:
- Access any timeseries stored in memory.
- Create or update existing series.
- Reuse helper functions written by you earlier, to make your code more terse and readable.
How to access existing timeseries
-- Get the handle to access a timeseries called "trajectory/node.0/position/x"
series_x = TimeseriesView.find( "trajectory/node.0/position/x" )

-- Very often, you may want to do something like this
node_num = 0
str = string.format("trajectory/node.%d/position/x", node_num)
series_x = TimeseriesView.find( str )

-- If the series doesn't exist, nil is retuned
if series_x == nil then
  print("nope")
end

-- Get the number of elements
n = series_x:size()

-- Access time/value pairs at index i, where the first index is 0
t, x = series_x:at(i)

-- More often, it is useful to find a value by timestamp, instead of index
x = series:atTime(t)
How to create a new ScatterXY series
-- Create a new series or clear its points, if the series exists already
new_series = ScatterXY.new("trajectory_XY")

-- Add data
new_series:push_back(x, y)

-- Clear previous data
new_series:clear()

-- Count number of elements
n = new_series:size()

-- Access x/y  value pairs at index i, where the first index is 0
x, y = new_series:at(i)
Time to write your first script :)

Time to write your first script :)
--- Create a new series or overwite the previous one.
--- Do this once, outside the function
new_series = ScatterXY.new("trajectory_XY")

function( tracker_time )
  index = 0
  while(true) do

    str = string.format("trajectory/node.%d/pos/x", index) -- X
    series_x = TimeseriesView.find( str )
    str = string.format("trajectory/node.%d/pos/y", index) -- Y
    series_y = TimeseriesView.find( str )

    -- stop the loop if any of those series can't be found
    if series_x == nil or series_y == nil then break end

    --- Append points to new_series
    x = series_x:atTime(tracker_time)
    y = series_y:atTime(tracker_time)
    new_series:push_back(x,y)

    index = index + 1
  end -- end loop
end
To save you time, PlotJuggler allows you to create a "library" of reusable helper functions, pre-loaded by all your scripts