Quantification: Why and How-to

Davide Poggiali


Outline:
- What is quantification in PET/SPECT (and why should I care)
- From visive/qualitative to quantitative assessment
- Conclusions
What is quantification in PET/SPECT
PET and SPECT already provide quantitative images in terms of tracer concentration [Bq/ml], corrected for radiotracer decaying.
\[ C(t) = C_0 e^{-\lambda (t-t_0)} \]
where \(\lambda=\frac{log 2}{T_{1/2}}\).
So what do we need more?
By quantification we actually mean the computation of a numerical value per Volume of Interest (VOI) which actually tells us something about the tracer's kinetics and deposition.
Absolute quantification:
- Relies on mathematical modelling
- Requires a timeframe 4D (list mode) image


PROs:
- Accurate
- Reliable
CONs:
- Time consuming
- A bit hard to explain
Semi-quantification:
- Normalized for infra-subject variability
- Requires a static 3D image
PROs:
- Faster
- Easier to understand
CONs:
- Less reliable
- Tracer's kinetics ignored
2. From visive/qualitative to quantitative assessment.
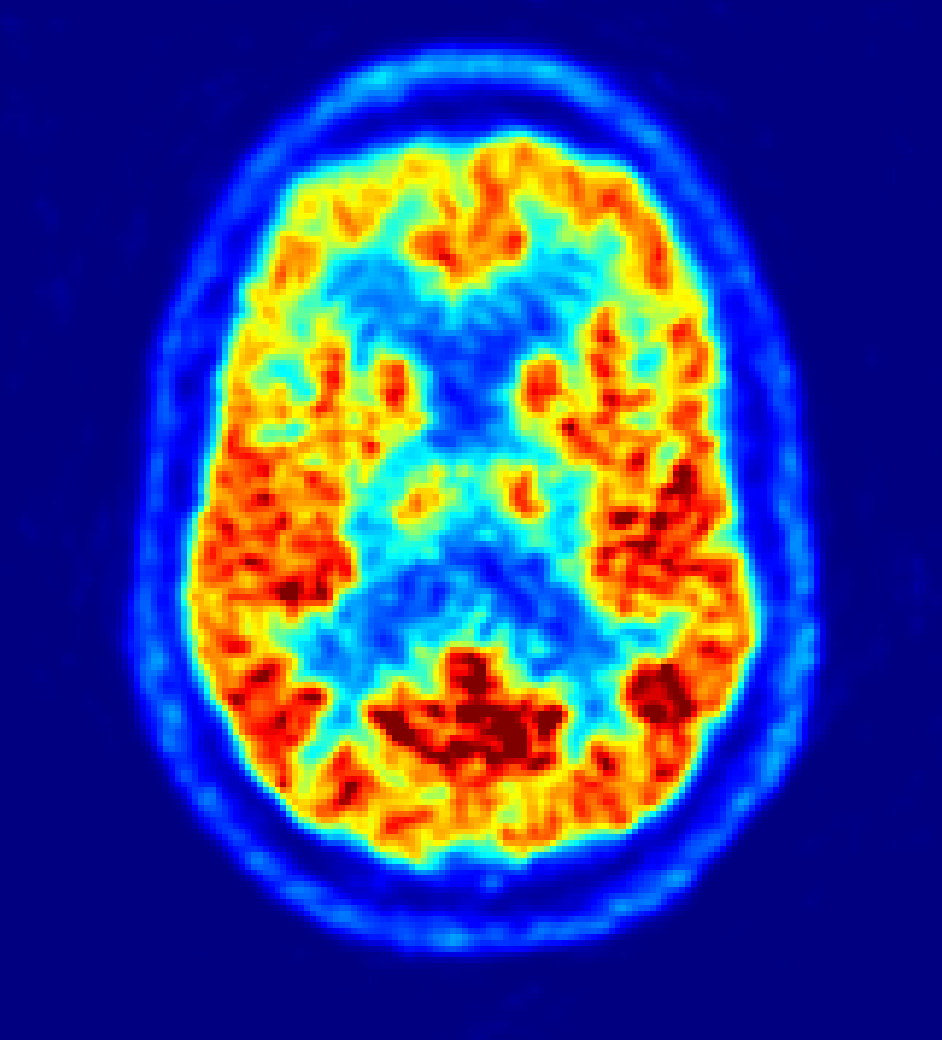
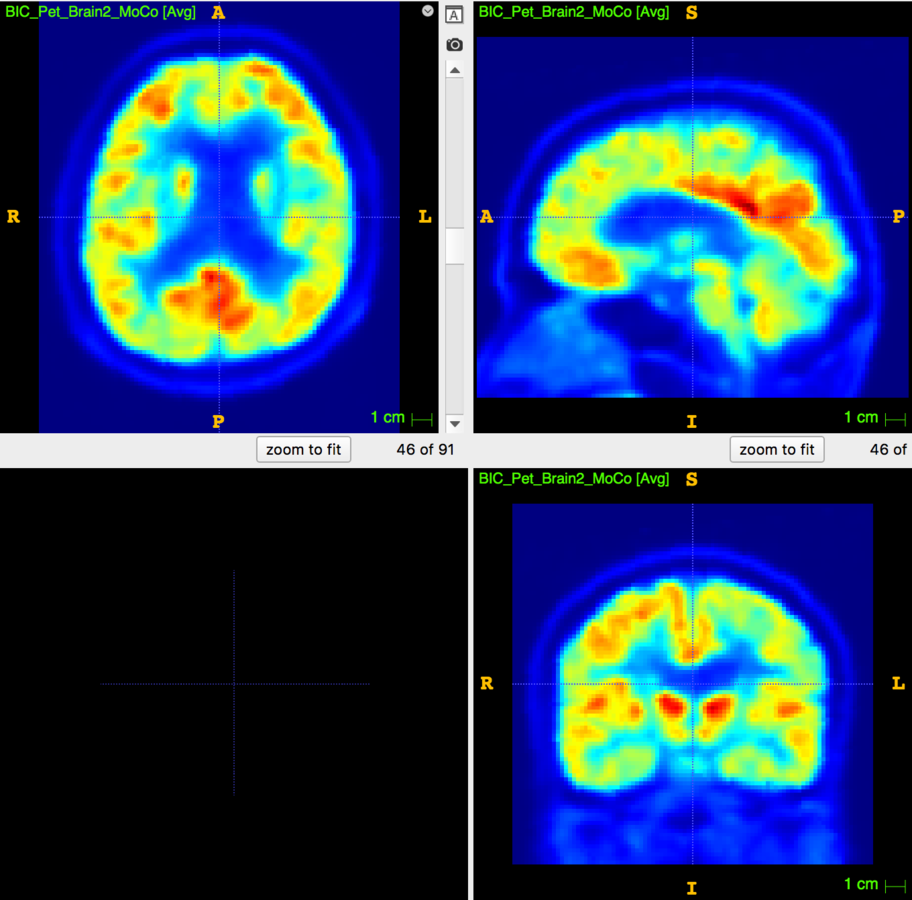
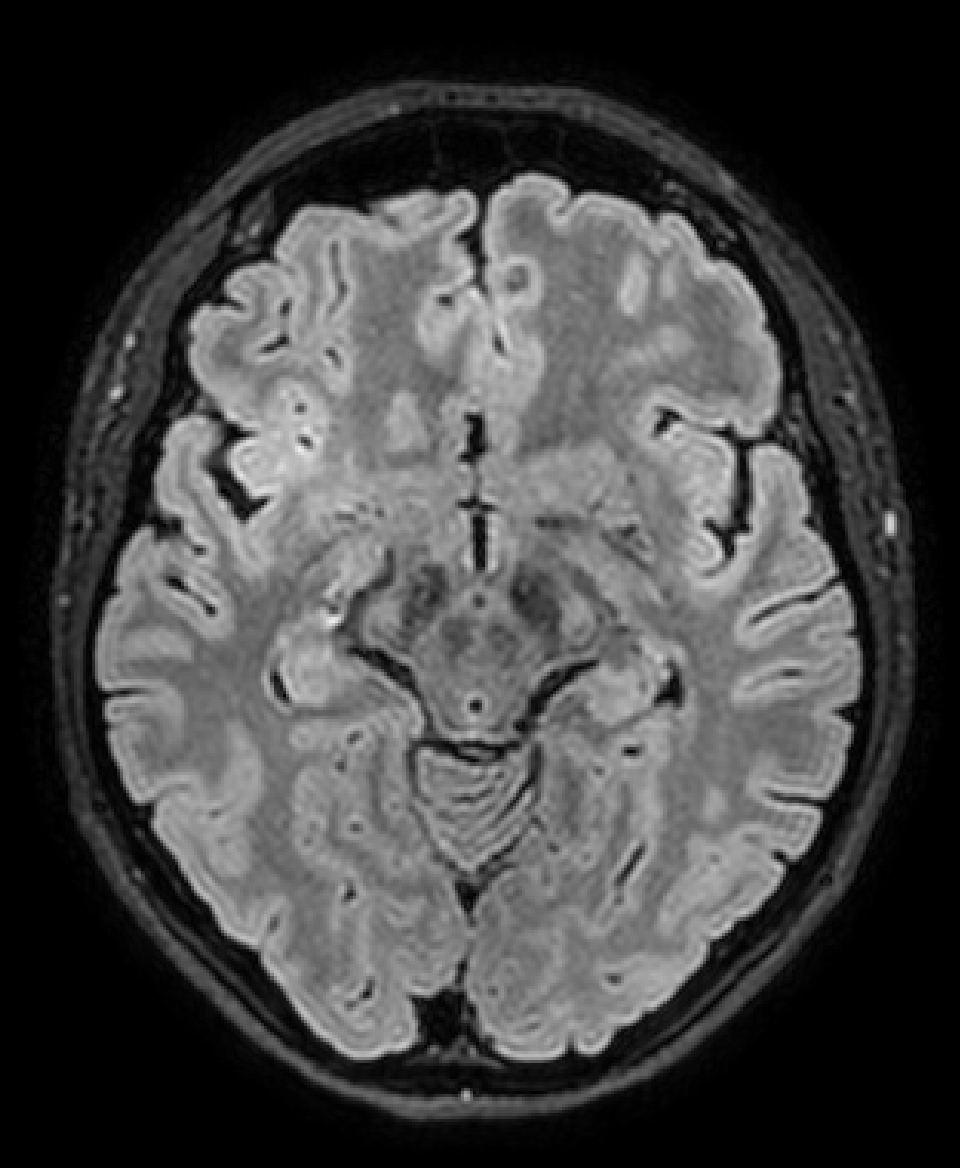
What do we see?
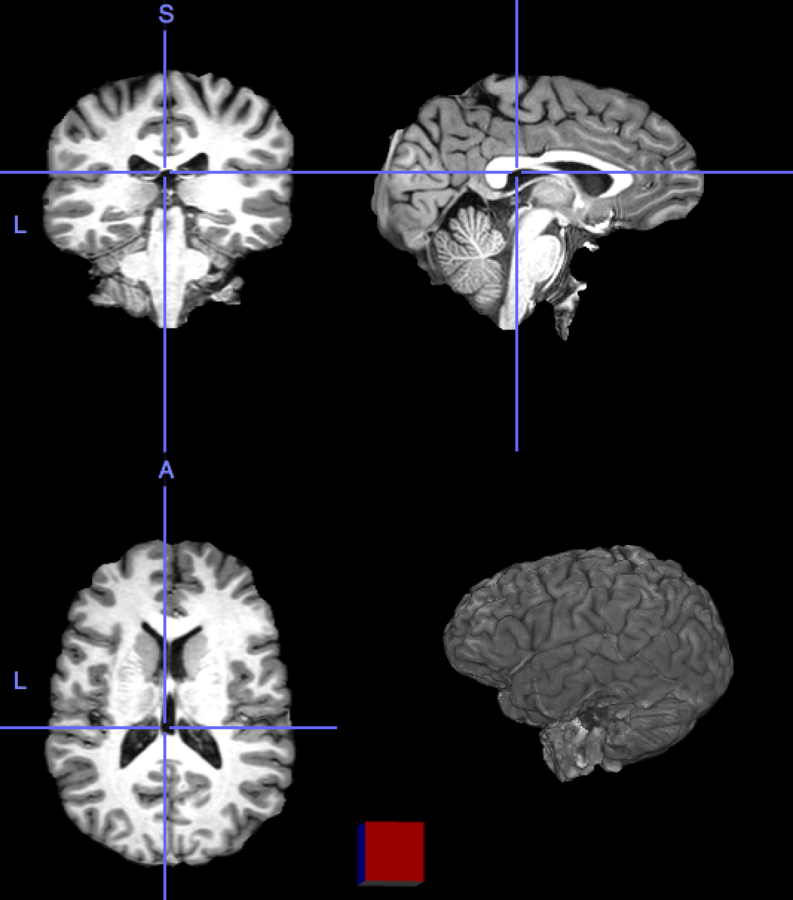
Some low signal on frontal lobe....
- I see that ...
- I heard that ...
- I imagine that ...
- The measures tell me that...
- Statistical analysis says that...
Measurements
Expertise
Experience
Some steps from visual to numerical assessment:
1. Mean per VOI
| VOI | Mean value |
|---|---|
| Frontal L | 121.3 |
| Frontal R | 149.1 |
| Occipital L | 297.1 |
| Occipital R | 279.7 |
| WM | 98.1 |
| Cerebellum GM | 137.3 |
Some steps from visual to numerical assessment:
2. SUVr
| VOI | SUVr |
|---|---|
| Frontal L | 0.88 |
| Frontal R | 1.08 |
| Occipital L | 2.16 |
| Occipital R | 2.04 |
| WM | 0.71 |
| Cerebellum GM | 1.0 (ref.) |
Some steps from visual to numerical assessment:
3. Percentile or z-score of SUVr w/ respect to normal population
| VOI | z-score |
|---|---|
| Frontal L | -3.01 |
| Frontal R | -1.45 |
| Occipital L | 0.43 |
| Occipital R | 0.23 |
| WM | 1.12 |
| Cerebellum GM | --- (ref.) |
Conclusions:
Quantification allows to:
- Objectively compare radiotracer captation on VOIs
- Quantitatively compare subject's image with a reference cohort
- Make predictions, given the data (Machine/Deep Leaning)
- Reduce the grey zone in between diagnotypes for clinical evaluation
Thanks for the attention!