Beautiful Graphs
Made simpler with Jupyter
Daina Bouquin & John DeBlase

Who are we?
An app developer and a librarian working on Data Analytics masters degrees


Problem
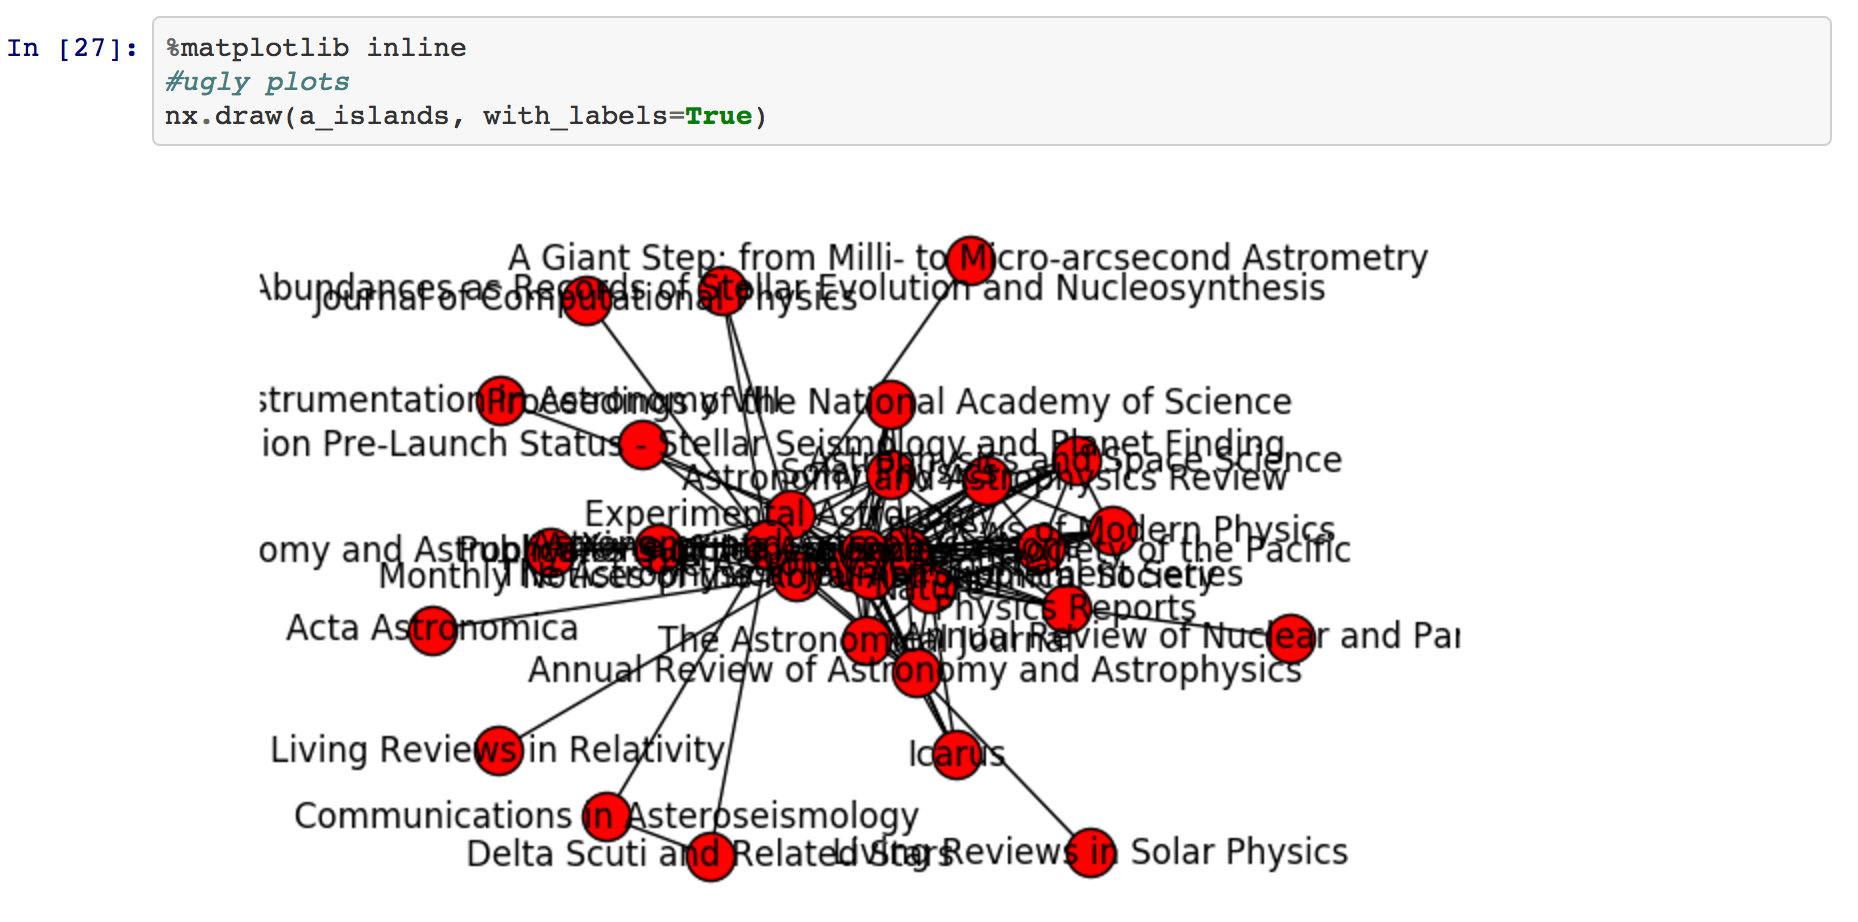
A lot of Python modules for conducting network analytics aren't very helpful in making visualizations
In school we noticed a
Why Focus on Network Visualization?
- Visualization is integral to the data scientist’s ability to use network analytics to effectively derive theories and inferences/ conduct exploratory analysis.
- Interactive graph visualizations foster “theoretical insight”.
- Visualization is essential to improve network analysts work as it allows them to see complex structures that statistics and modeling alone cannot reveal.

network visualization
is important
Data scientists using tools like Jupyter are left trying to work with incredibly messy visualizations or spending time trying to use unfamiliar tools and languages like JavaScript.
They need to completely shift platforms to produce useful and engaging visualizations.
These people do not currently have access to simple interfaces that integrate with tools like Jupyter notebooks (which the rest of their workflows rely on).
We think it's better to leverage tools that are already
optimized for network analytics and to connect them to the notebook
- Great for analytics
- Popular!
- Non-interactive graphics
- Difficult to customize
Not very useful...
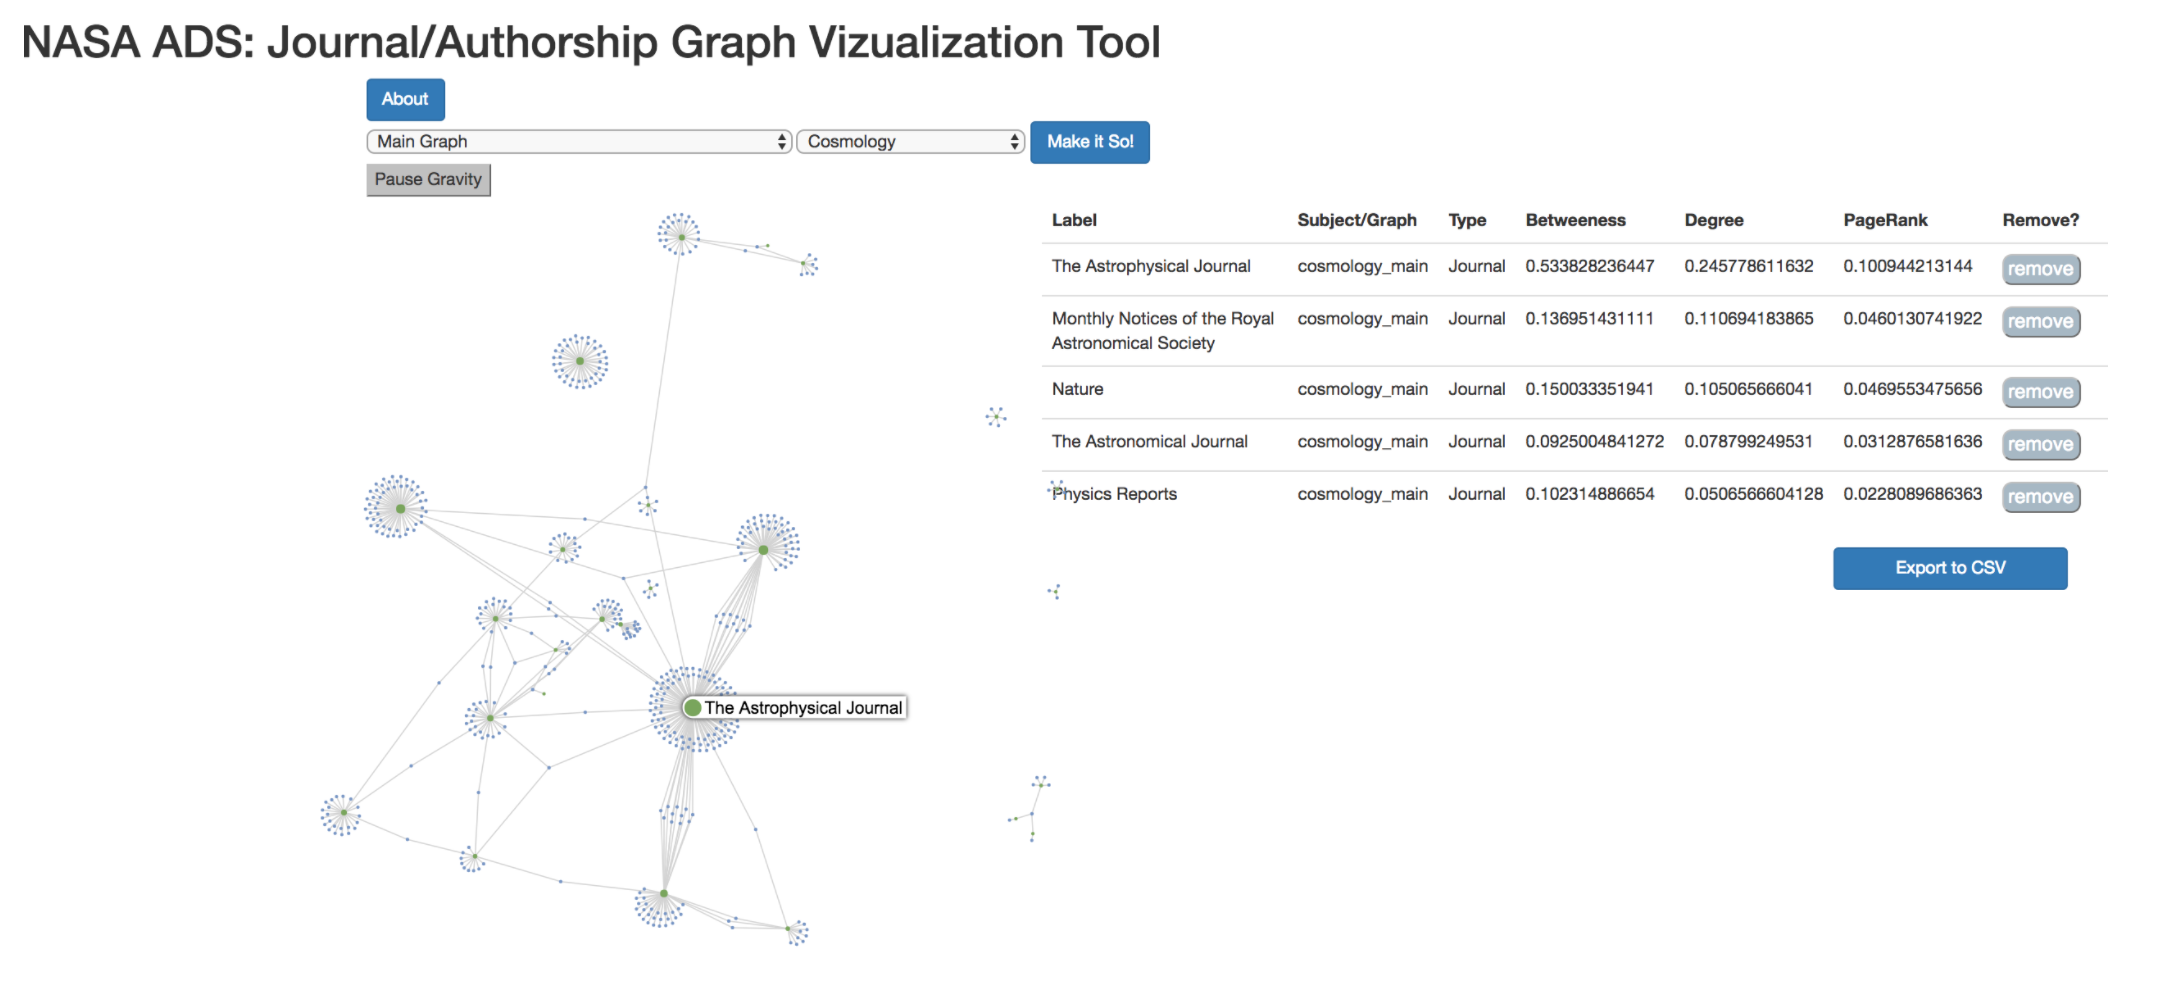
We spent a semester making something that we think is better
An extensible prototype network visualization frontend for Jupyter Notebooks
IPySigma
IPython + SigmaJS
...and last semester we integrated it with Jupyter!
Why Jupyter?
- Jupyter is becoming increasingly important to the data community for sharing and reproducibility
- Tools that integrate with Jupyter are highly valuable
- Reproducibility is also foundationally important to computational science endeavors more broadly (academia and in industry)
Thanks Jupyter!
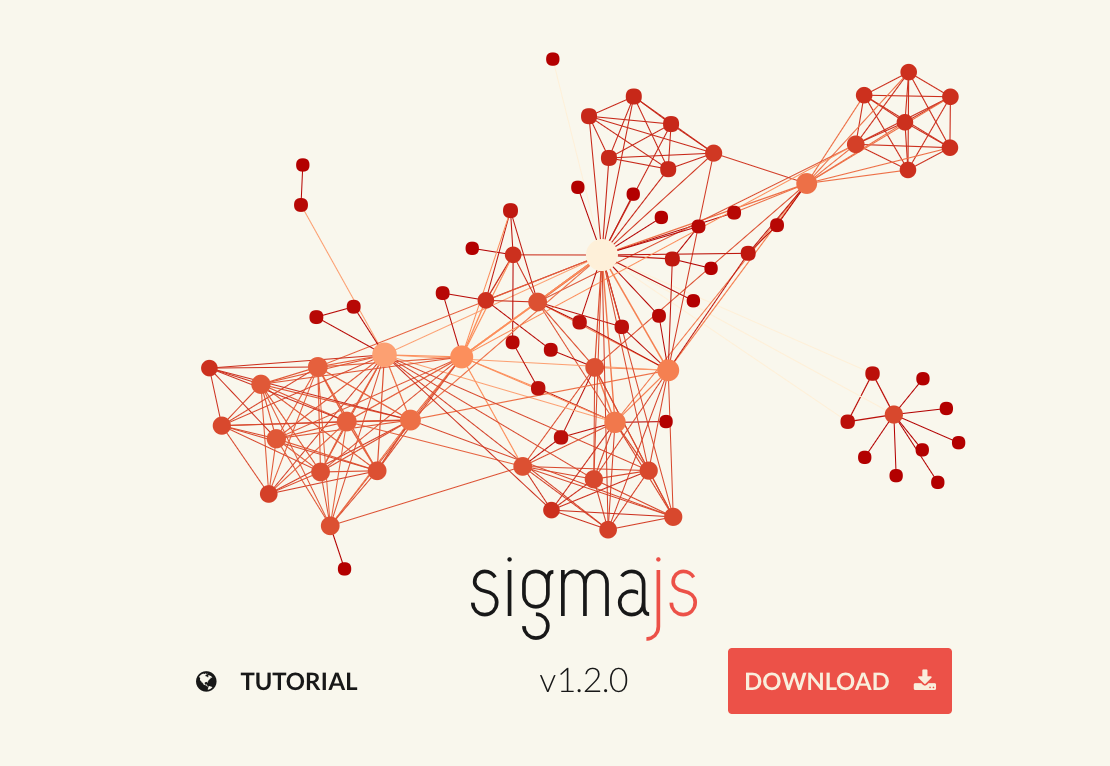
Why SigmaJS?
- SigmaJS is a JavaScript library dedicated to graph drawing.
- Unlike libraries like D3, Sigma is optimized for network visualization.

Getting Started - first clone the repo then install:
Python
- The prototype python package is contained in the ipysig folder.
- From the root directory: Build and activate a clean python environment>=2.7.10 with requirements.txt using virtualenv.
- pip install -r requirements.txt to get the required packages.
Node.js
- The node-express application is contained in the app folder.
- Make sure your node version is >= v6.9.4 and that both npm + bower are installed globally.
- From the root directory: cd ./app
- type npm install to install the node modules locally in the app top-level folder
- From app: cd ./browser
- type bower install to install the bower_components folder
Limitations and Possible Future Work
-
Currently only processes NetworkX graph objects
- Extensible and open protocol - could process any graph format
-
Refreshing the browser can cause problems
- In-browser memory could be explored
-
Did not use a development framework
- It was for a class!
- Ideally would be able to store multiple graphs in single tab
-
Has a few hacks built-in
- contributions from the JupyterCon community much appreciated!
IPySigma in action:
an example from scholarly publishing in
astronomy & astrophysics
Impact Factor
- a measure of the frequency with which the average article in a journal has been cited in a particular year
- Measure of "importance"
- Great disagreement between members of the scholarly community about value of impact factors
Degree Centrality
- identify the most important vertices within a graph
- a measure of the degree to which an individual is near all other individuals in a network
Some definitions: