Methods for dealing with sparse and incomplete environmental datasets
An open source tool-set for obtaining and working with environmental data sets
Ann Gledson, Douglas Lowe, Manuele Reani, Caroline Jay, Dave Topping
The University of Manchester


-
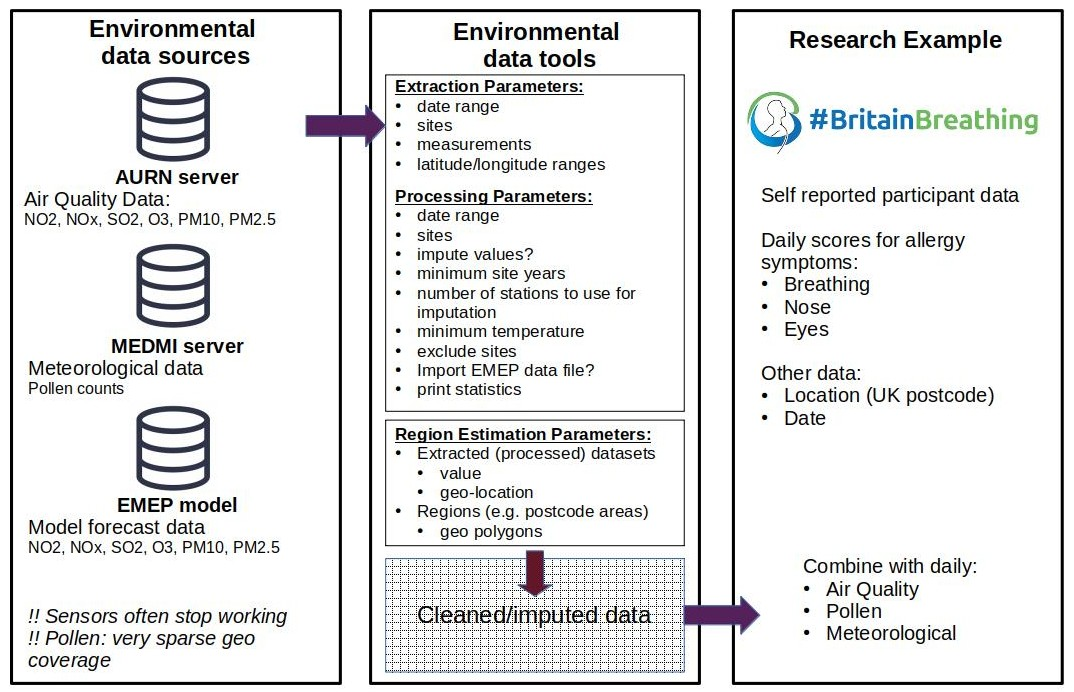
Automatic Urban and Rural Network (AURN)
- NOx, SO2, O3, NO2, PM10, PM2.5 (hourly data)
- Rdata formatted files, available via web API
-
Medical and Environmental Data (Mash-up) Infrastructure (MEDMI)
- Meteorological: air temperature, pressure, relative humidity (hourly)
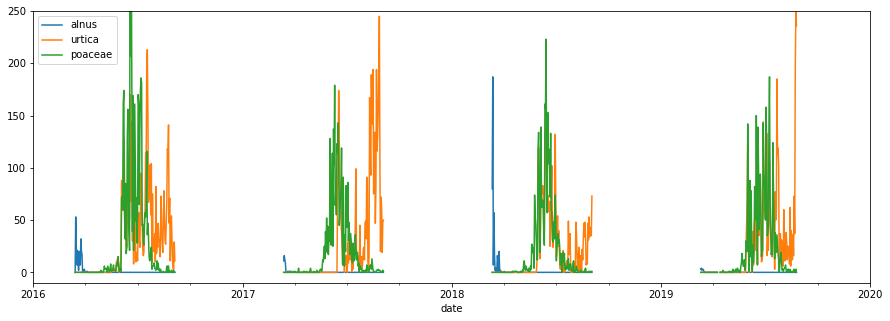
- Pollens (12 species): alnus, ambrosia, artemesia, ..., urtica (daily)
- Accessible to registered users via unix server (ssh access)
Environmental Data Sources
Pollen Data:
50%+ missing (measurements are seasonal)
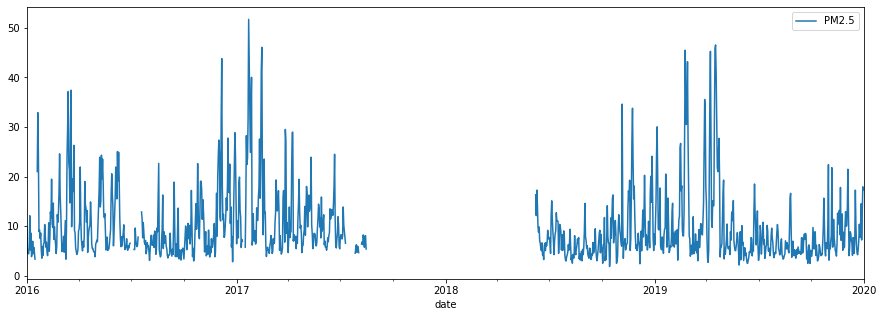
Air Quality Data:
5-12% missing (per pollutant)
Meteorology:
1.5-5.5% missing (per variable)
Missing Data Problem
-
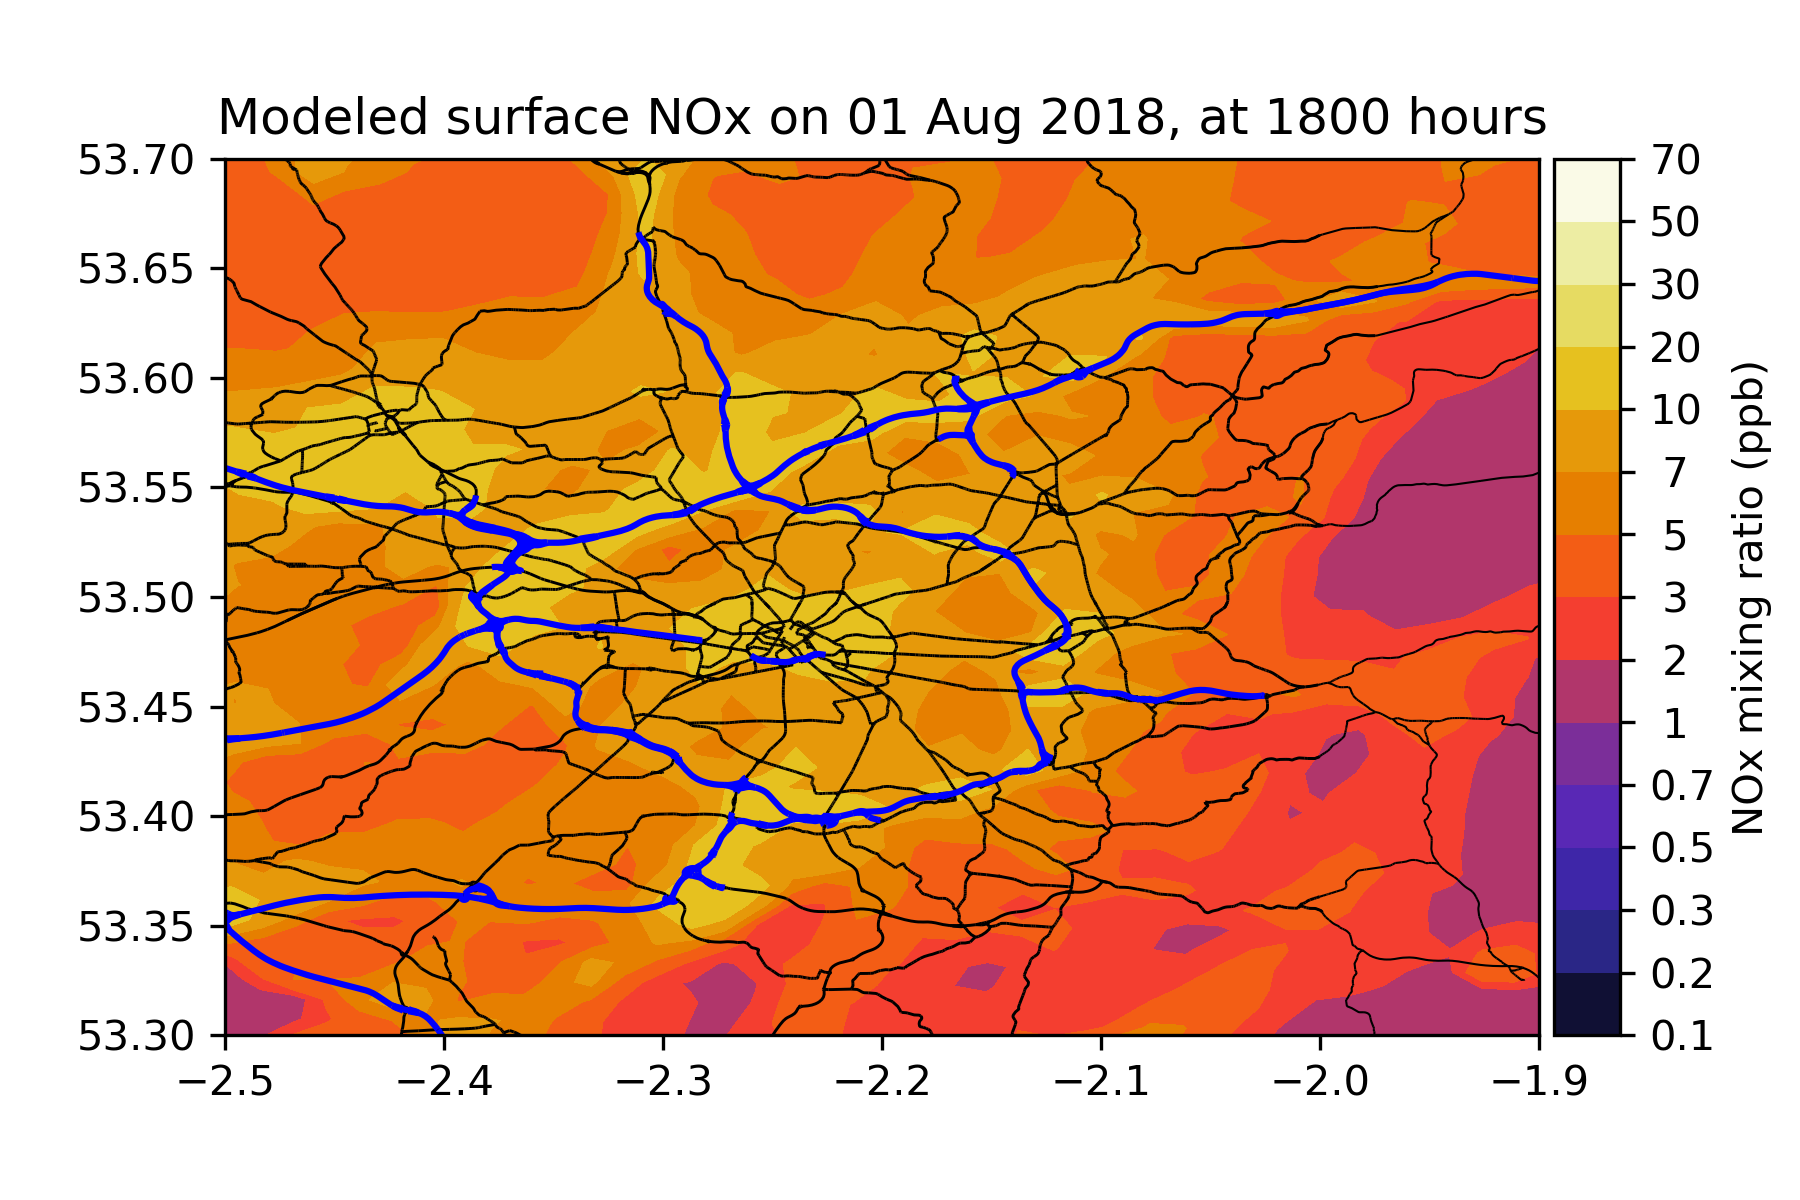
European Monitoring and Evaluation Programme (EMEP)
- NAEI emissions data
- gas: NOx, NO2, SO2, O3
- particulate: PM10, PM2.5
-
Issues:
- Coarse resolution (3km grid)
- Assumed activity cycles - not responsive to environment changes (e.g. cold weather impacts on use of domestic wood-burning stoves)
(Extra) Modelled AQ Data
Use Machine Learning to iteratively fill gaps in timeseries data
Requirements:
- strong correlation between timeseries
- data available in reference datasets for periods of missing data
Use the python based scikit-learn iterative imputation library (not as complete as the R MICE library, but easier to integrate into our python workflow)
Solution: Multivariate Imputation
(default imputation method in scikit-learn)
- Ridge regression methods ensure stability of solution when working with highly-correlated variables
- Bayesian approach uses an (assumed) prior probability distribution to aid regression.
Assumptions:
- data probability distribution is normal
Bayesian Ridge Regression
Meteorological Data
- remove duplicate measurements
- remove sites with only single daily readings
- data reality checking:
- site 117 (Cairngorm mountains) removed - RH too unreliable (>110%)
- remove all data points (11) where T < -20degC
Pollution Data
- Remove all zero & negative datapoints (<2% of total data)
- sample EMEP (3km) gridded data at every AURN measurement site
Data Preparation: Cleaning
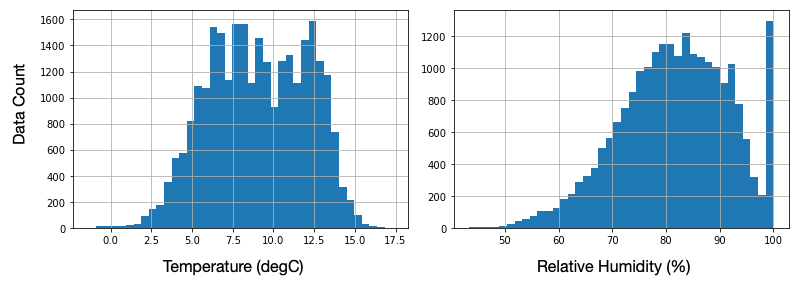
Raw Probability Distributions are not necessarly normal
e.g. temperature / RH for Kirkwall (Orkney Islands)
Solution: QuantileTransformer(output_distribution='normal')
Data Preparation: Preprocessing
Extreme bi-modal distribution impervious to transformation
Solution: Don't impute RH data - impute Temperature and Dew-point Temperature, then derive RH from these
(metpy.calc.relative_humidity_from_dewpoint)
Data Preparation: Preprocessing
- Retain only sites with >2 years of data
- Use sites with >3.5 years of data as reference sites
- Impute site of interest along with (closest) 5 reference sites
- Meteorological variables imputed separately (6 timeseries per imputation process)
- Pollution variables for a given site imputed together, along with EMEP data for the site (7-42 timeseries per imputation process)
Assumptions:
- Spatially closest sites are likely to have the strongest correlations
- For imputation, "it is expedient to select a suitable subset of data that contains no more than 15 to 25 variables" (van Buuren, S., & Groothuis-Oudshoorn, K.; JSS; 2011; doi:10.18637/jss.v045.i03)
Processing Method
- Use only reference sites
- Data removal for a given fraction of total period
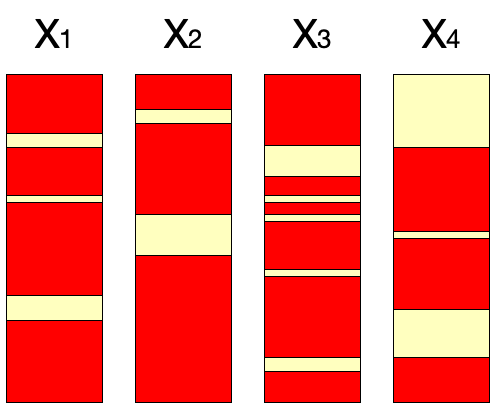
- Data removal can be:
- random (non-contiguous)
- contiguous, either start/middle/end of period
Tools are provided with the processing toolkit for users to carry out these tests for themselves
Testing Imputation Methods
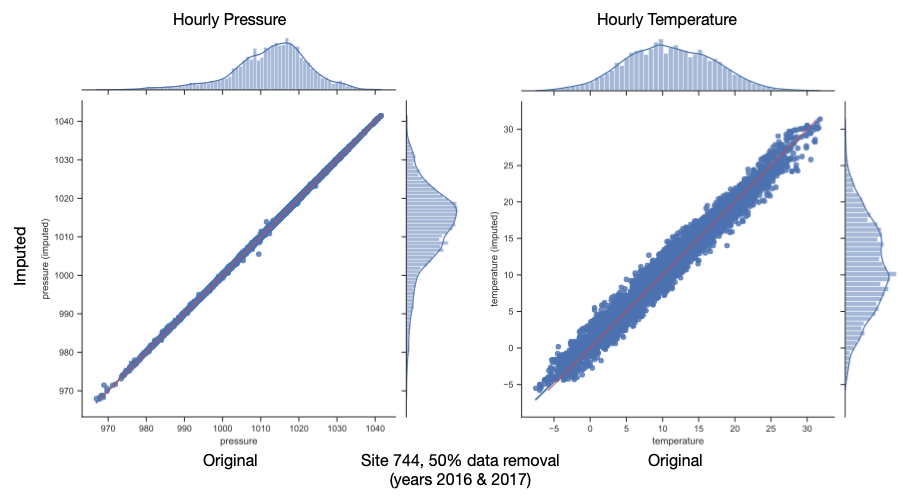
Test Results (Pressure & Temp)
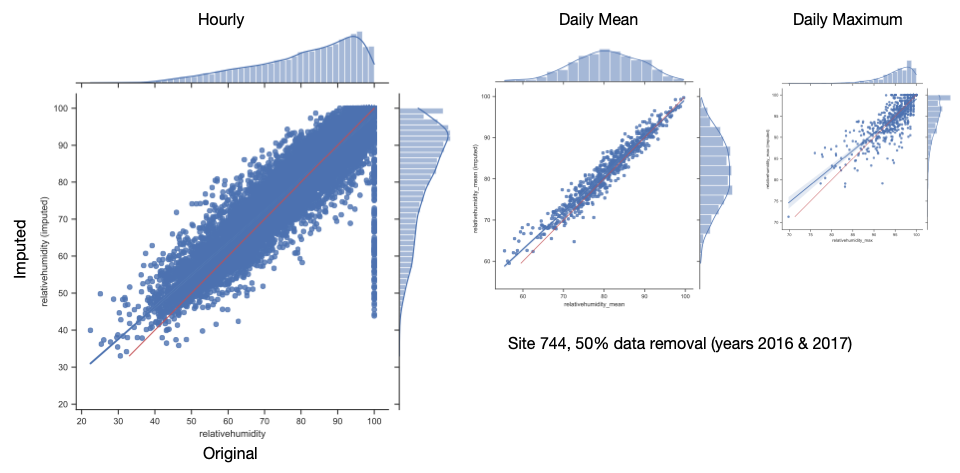
Test Results (Relative Humidity)
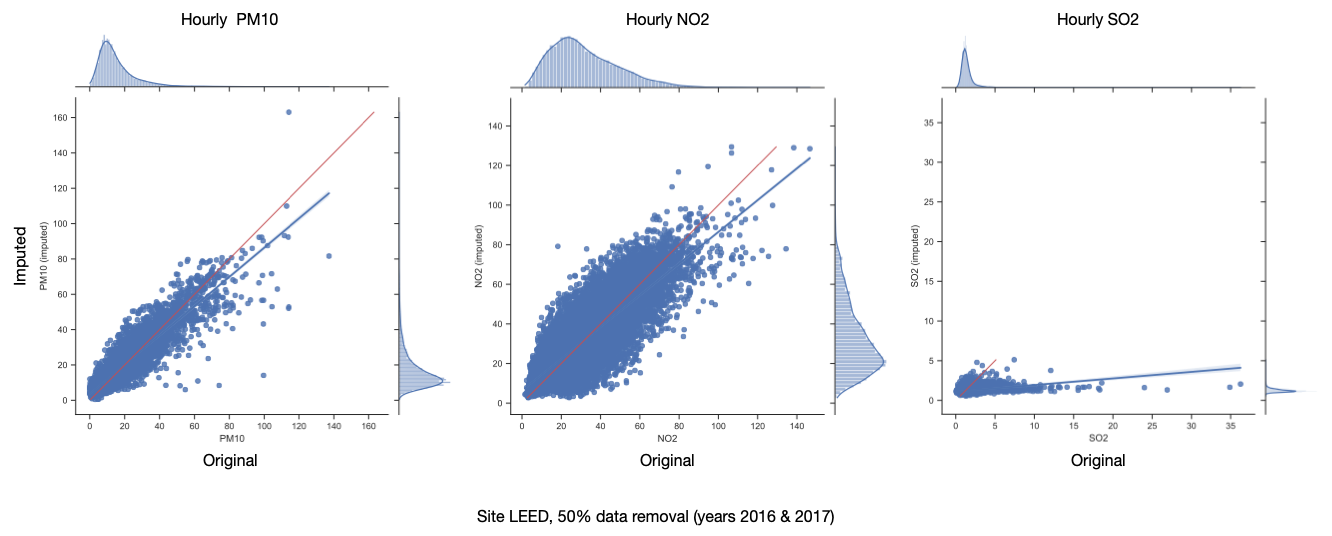
Test Results (Air Quality)
Test Results (RH Stats)
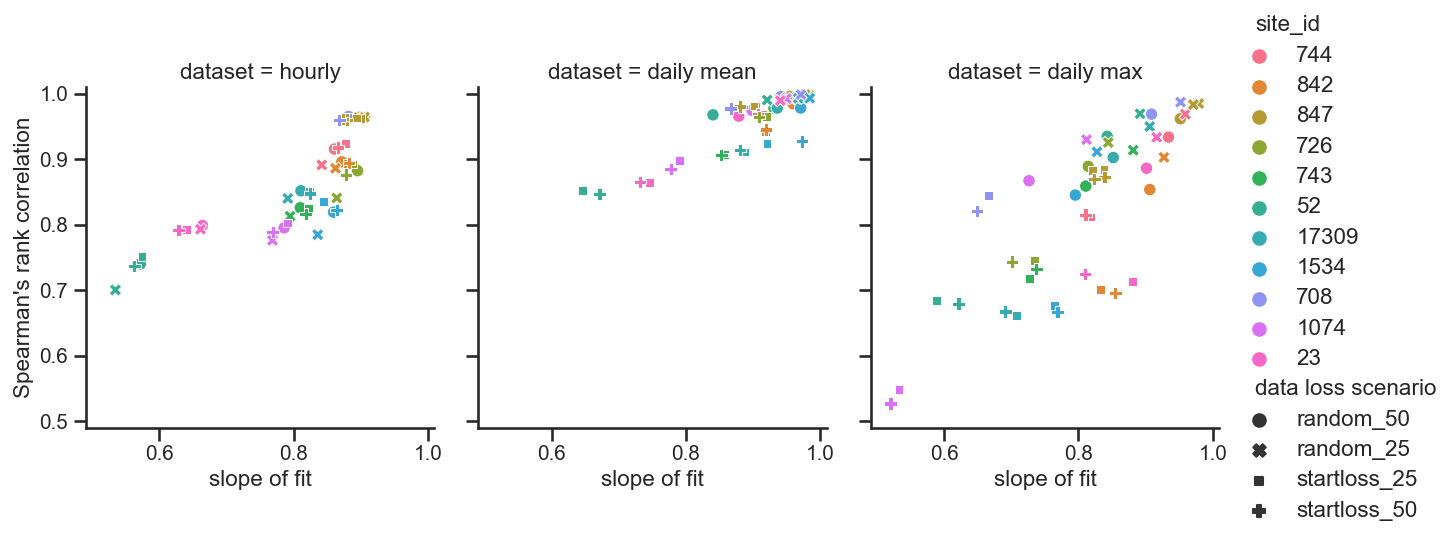
- for hourly data, scenarios cluster by site
- for daily mean/max data, scenarios clump by site and the contigiousness of data removal
Test Results (AQ Stats)
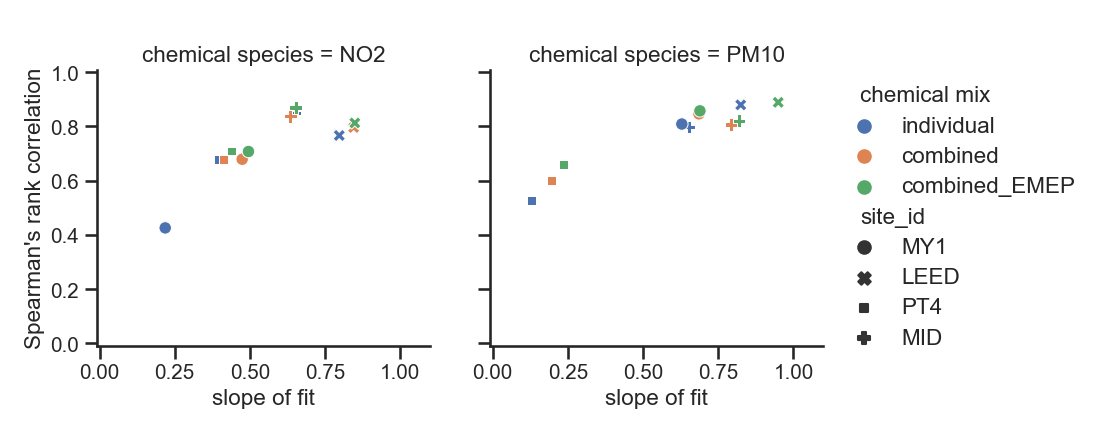
50% data removal (2016 & 2017)
- imputing pollutants together (and adding EMEP data) generally improves performance
Data Imputation Conclusions
- Unfortunately can't use imputation to fill gaps in pollen data
- Imputation of pressure and temperature data is very reliable / gives a good fit
- Imputation of relative humidity and (most) air quality data sets gives reasonable results
- SO2 imputation is not reasonable enough to provide in final dataset
- Imputing all air quality datasets for a given site together, and including EMEP data, gives better results than imputing these individually