Binary Instrumentation
Source Practical Binary Analysis
What is Binary Instrumentation?
Inserting new code at any point in an existing binary to observe or modify
the binary’s behavior in some way is called instrumenting the binary.

Static Binary Instrumentation
Involves modifying the binary on disk, such that all instrumented code is contained in the binary.
- + Fast
- + Single stand-alone binary
- - No dynamically generated code
- - Error prone
- - Symbols recommended
- - Libraries must be instrumented individually

SBI in theory
We can't insert code anywhere otherwise all the addresses for code and data will be jumbled and broken.
One approach may be to 1) overwrite an instruction to jump to instrumented code, 4) execute the overwritten instruction, and 6) jump back to original code.

The issue here is that jump instructions usually need 5 bytes. Too many edge cases to account for when shoving 5 bytes in a binary arbitrarily.
SBI - INT3
With the int3 approach, you can write 0xCC anywhere and an attached process (using ptrace) will be signaled when a SIGTRAP occurs. The attached process can then inspect at what location the SIGTRAP occurred and fix the byte while performing any instrumentation. This method is slower since software interrupts have excessive overhead.

SBI - Trampoline
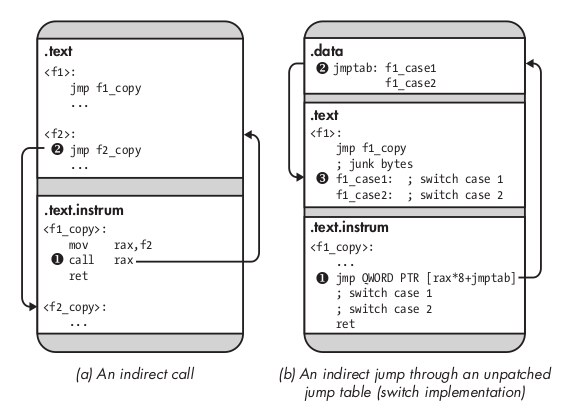
Makes copies of original code into instrumented code sections, in an attempt to preserve addresses and offsets.
Requires special consideration for indirect control flow

Dynamic Binary Instrumentation
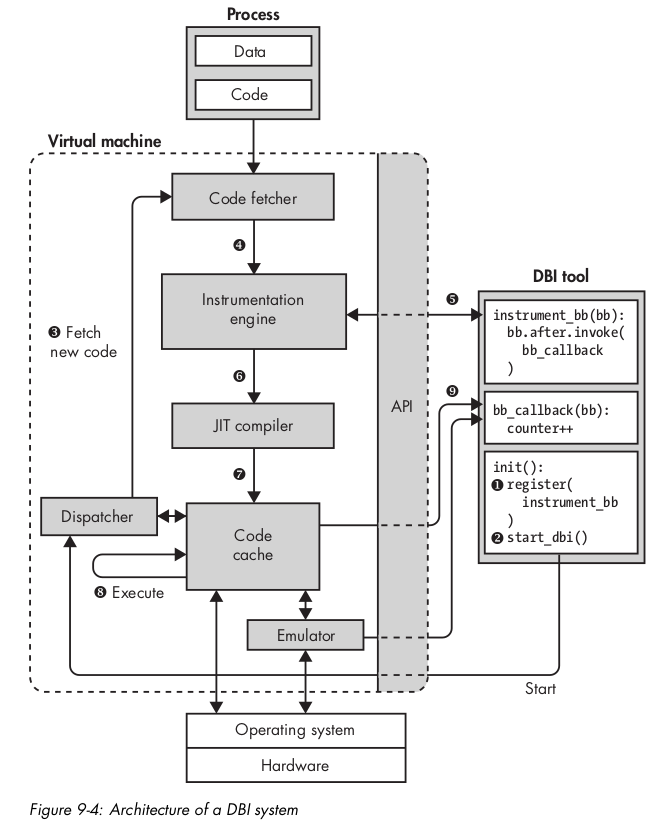
Attaches to a running process to instrument at run time. The DBI engine runs code in a code cache and uses a JIT compiler to compile instrumented code into the code cache. The JIT compiler also rewrites control flow instructions to maintain control over the process.
Intel Pin
Free-to-use (not open source) DBI platform by Intel.
Can instrument at different levels of granularity: Instruction, Basic Block, Trace (similar to BB, but larger), Function, and Image (complete exe or lib)
Analysis/Instrumenting tools that use the Pin platform are referred to as Pintools.

Implementing Pintools
First initialize Pin.
Two type of functions: Instrumentation and Analysis.
Instrumentation functions will perform the instrumentation at a point if it has not been modified yet to execute an Analysis function.
int main(int argc, char * argv[])
{
    // Initialize pin
    if (PIN_Init(argc, argv)) return Usage();

    OutFile.open(KnobOutputFile.Value().c_str());

    // Register Instruction to be called to instrument instructions
    INS_AddInstrumentFunction(Instruction, 0);

    // Register Fini to be called when the application exits
    PIN_AddFiniFunction(Fini, 0);

    // Start the program, never returns
    PIN_StartProgram();

    return 0;
}
Instrumentation Function
// Pin calls this function every time a new instruction is encountered
VOID Instruction(INS ins, VOID *v)
{
    // Insert a call to docount before every instruction, no arguments are passed
    INS_InsertCall(ins, IPOINT_BEFORE, (AFUNPTR)docount, IARG_END);
}
Analysis Function
// The running count of instructions is kept here
// make it static to help the compiler optimize docount
static UINT64 icount = 0;

// This function is called before every instruction is executed
VOID docount() { icount++; }
Post program hook
ofstream OutFile;

KNOB<string> KnobOutputFile(KNOB_MODE_WRITEONCE, "pintool",
    "o", "inscount.out", "specify output file name");

// This function is called when the application exits
VOID Fini(INT32 code, VOID *v)
{
    // Write to a file since cout and cerr maybe closed by the application
    OutFile.setf(ios::showbase);
    OutFile << "Count " << icount << endl;
    OutFile.close();
}
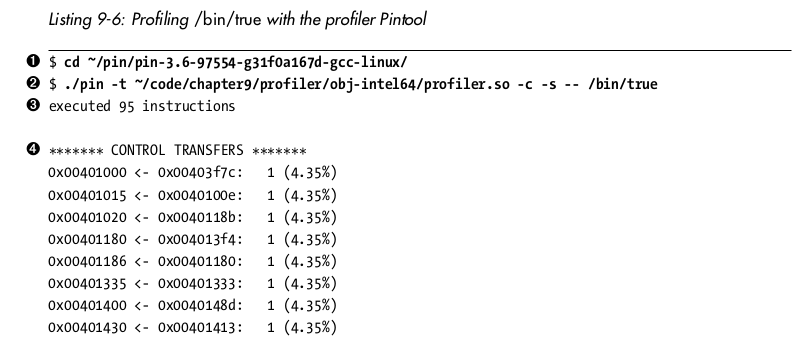
Most Pintools write to an *.out files
Basic usage examples - Profiler
Automatic Binary Unpacker
