Mortality statistics
(Cause-of-death)data
Mortality statistics capture a vital dynamic in a population system.
It measures how frequently individuals leave the system through death, who leaves and how do they leave.
Mortality statistics is of 3 types
1. Crude death rate
2. Mortality by population groups
3. Mortality by cause
1. Crude death rate
Crude death rate measures the frequency of deaths in a population over a specified period of time, usually a year. It is defined as the ‘Number of deaths per 1000 population in a year’
2. Mortality by population groups
-
Deaths can be grouped by specific characteristics like age, gender, ethnicity etc, to generate mortality rates specific to such groups. They are usually expressed per 1000 individuals in a specific group
-
Special cases of group mortality rates include:
a. Infant mortality rate
b. Under five mortality rate and
c. Maternal mortality rate
3. Mortality by cause
-
Deaths can also be grouped by their causative factors to yield cause-specific mortality fractions (CSMF). Their use permits the study of the contribution of individual diseases and conditions to mortality in a population in general and in specific population groups
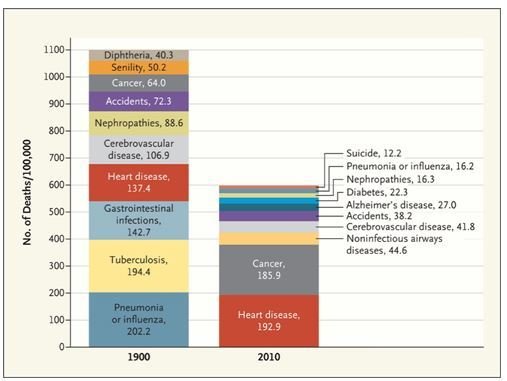
Leading Causes of Death in the US
A comparison of cause specific mortality fractions in the USA between 1900 and 2010 is illustrative of the changes in society that have occurred in the course of the century.The mortality burden of infectious diseases, more than a third of all deaths in 1900 has decreased considerably, while that due to heart diseases and cancers have increased.
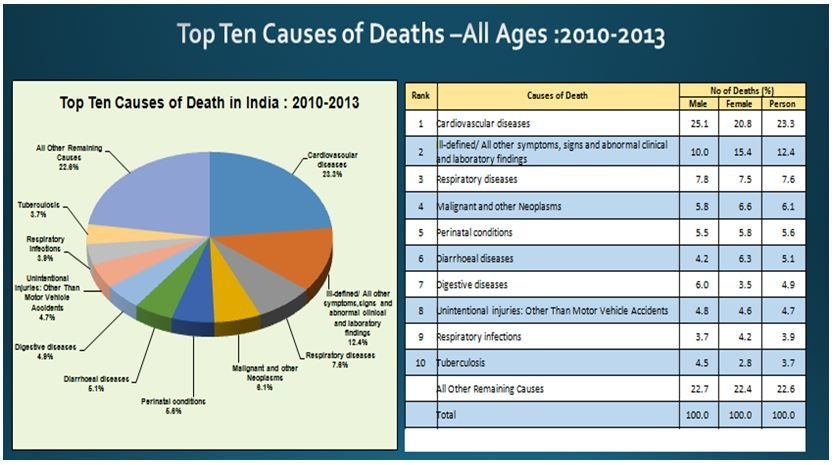
Leading Causes of Death in India
Causes of death in 21st century India have some diseases (eg cardiovascular diseases) in common with those seen in contemporary USA as well as those that were common in USA over a hundred years back (eg. infectious diseases)
You have now come to the end of this learning activity.
Move on to your next learning activity.