Cerealization II
The Crunch Redux
but first!
a message from our sponsors:
CEREAL KILLLER CAFE
"Claims in the talk are suspect.
all cereals are healthy
- just add more fruit"
CAN YOU TELL
WHAT'S INSIDE
JUST LOOKING
ON THE OUTSIDE
CODE & DATA
EMPOWER
YOU TO GO
A → B
some cereals, no good
what data to get?
and features?
preparing the data
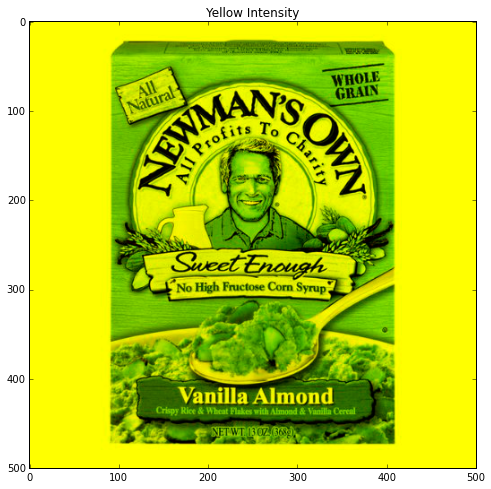
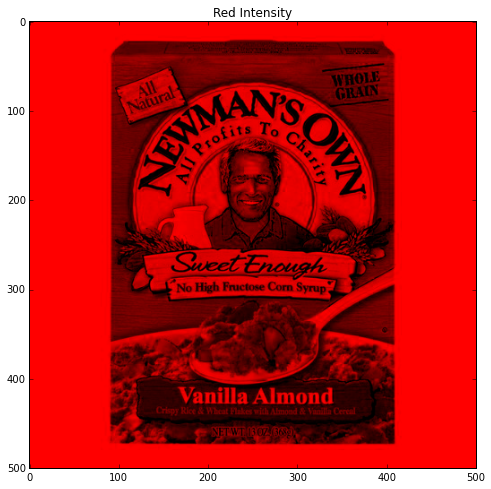
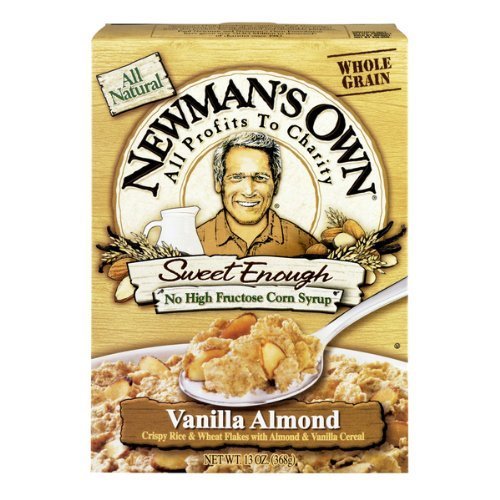
Image Feature Vector
import cv2

cv2.imread('cerealbox.png')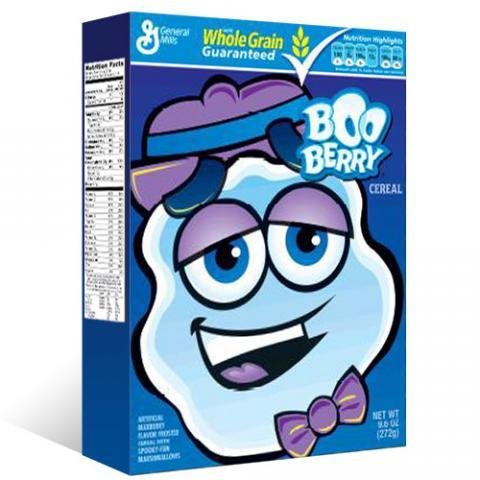
img = cv2.imread('../img/img_042_gmbooberry.jpg', 0)

ret,thresh1 = cv2.threshold(img,33,255,cv2.THRESH_BINARY)
ret,thresh2 = cv2.threshold(img,33,255,cv2.THRESH_BINARY_INV)
ret,thresh3 = cv2.threshold(img,33,255,cv2.THRESH_TRUNC)
ret,thresh4 = cv2.threshold(img,33,255,cv2.THRESH_TOZERO)
ret,thresh5 = cv2.threshold(img,33,255,cv2.THRESH_TOZERO_INV)

thresh = ['img','thresh1','thresh2','thresh3','thresh4','thresh5']


for i in xrange(6):

    plt.subplot(2,3,i+1),plt.imshow(eval(thresh[i]),'gray')

    plt.title(thresh[i])

plt.show()
THRESHOLD @ 33
THRESHOLD @ 128
THRESHOLD @ 233
img = cv2.imread('../img/img_042_gmbooberry.jpg')

imgray = cv2.cvtColor(img,cv2.COLOR_BGR2GRAY)
ret, thresh = cv2.threshold(imgray, 180,255,cv2.THRESH_BINARY_INV)
contours, hierarchy = cv2.findContours(thresh, cv2.RETR_EXTERNAL, cv2.CHAIN_APPROX_SIMPLE)

cv2.drawContours(img, contours, -1, (0,0,255), 2)

plt.figure(figsize=(20,10))
plt.axis("off")
plt.imshow(cv2.cvtColor(img, cv2.COLOR_BGR2RGB));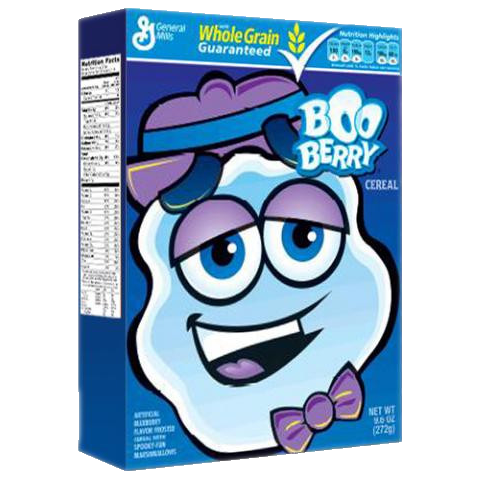
reading values
>>> img.shape
(500,700)

>>> img.size
350000
Image Dimensions
(Interstellar can't touch this)
array([ 181.12238527,  199.1831504 ,
        206.51429651,   80.67819854,
         65.41130384,   77.77899992])
Colour Mean,
Colour Standard Deviation
climbing up the ladder
defining your palette
Newborns are nearly color-blind. For the first few months they can see only the brightest colors. Everything else is just shades of gray. By age three their vision is pretty normal, but by then they may have been spoiled on brightly-colored things because those things are often designed specifically for children. Almost as if young children inhabit a separate universe, color-coded so they know what's for them.
colour, for humans
cv2.cvtColor(img, BGR2HSV)- Saturation / Intensity +

# Simplified Code

img_hsv = cv2.cvtColor(img, BGR2HSV)

# Extract the Hue values
s = img_hsv[:,:,1]
v = img_hsv[:,:,2]

# Intensity metric
i = s * v
Colour Blends
# Simplified Code

img_hsv = cv2.cvtColor(img, BGR2HSV)

# Extract the Hue values
h = img_hsv[:,:,0]

# Distance from Primary colours

primary = h % 40
secondary = abs(primary - 40)
blend = max(primary,secondary)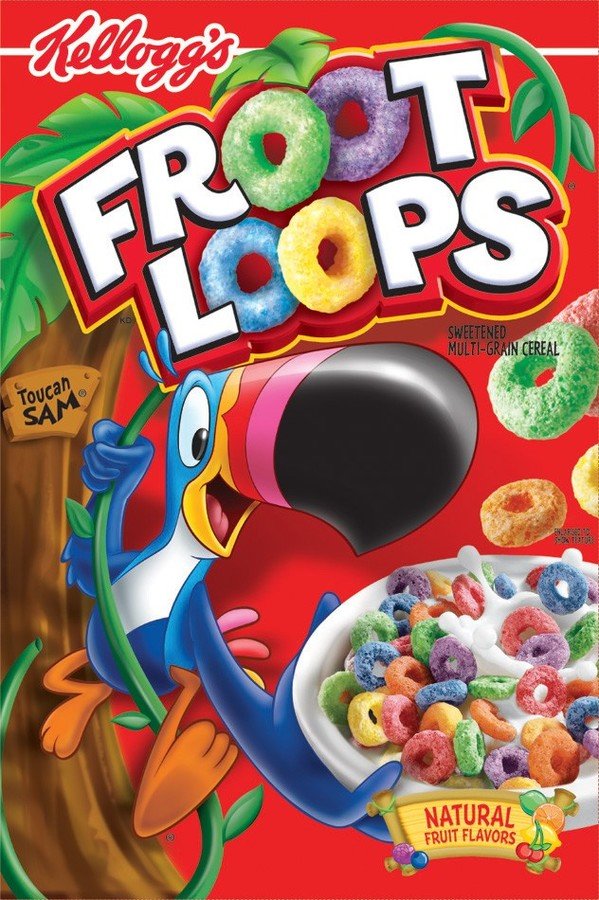


Most Frequent Colour vs Dominant Colour Cluster
def closest_colour(requested_colour):
    pri_color = ['Red', 'Orange', 'Yellow', 'Green', 'Blue',
                 'Violet', 'Brown', 'Black', 'Grey', 'White']
    pri_color = [x.lower() for x in pri_color]
    min_colours = {}
    #for key, name in webcolors.css3_hex_to_names.items():
    for key, name in [x for x in itertools.ifilter(lambda x: x[1] in pri_color,
                                                    webcolors.css3_hex_to_names.items())]:
        r_c, g_c, b_c = webcolors.hex_to_rgb(key)
        rd = (r_c - requested_colour[0]) ** 2
        gd = (g_c - requested_colour[1]) ** 2
        bd = (b_c - requested_colour[2]) ** 2
        min_colours[(rd + gd + bd)] = name

    return min_colours[min(min_colours.keys())]
closest_colour([123, 134, 255])
>>> 'violet'White for Lightness
machine learning
spokes-characters
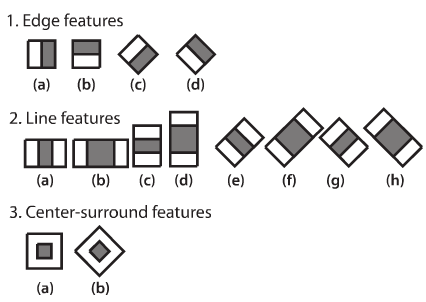
Haar Features
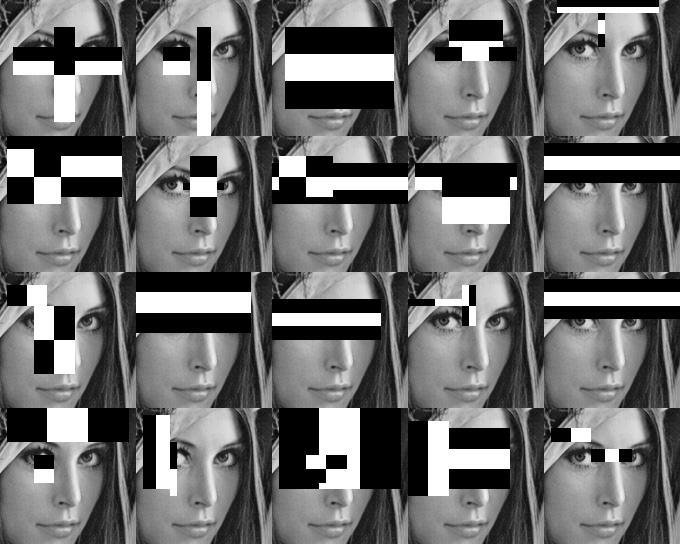
Haar Cascades
Haar Cascades
even a 24x24 window results
over 160 000 features
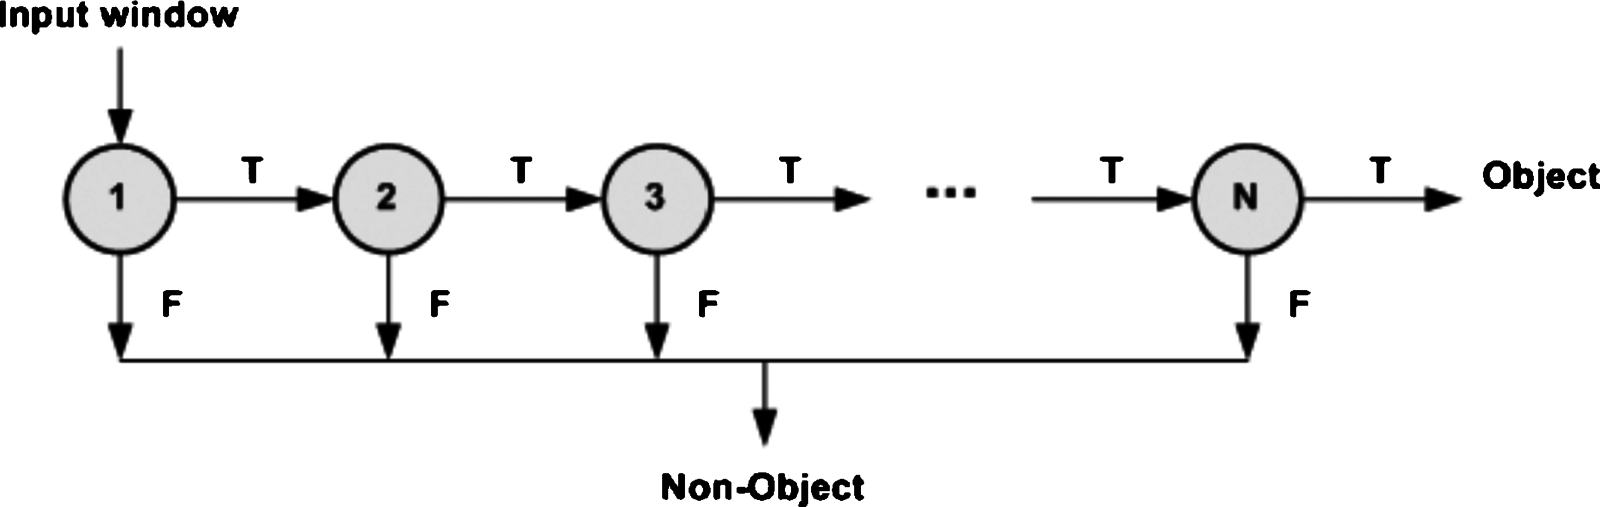
Object Detection
Sorry, Leprechauns, with those marshmallows,
it probably isn’t good for you
gaze recognition
Our Features
mean colour, std color
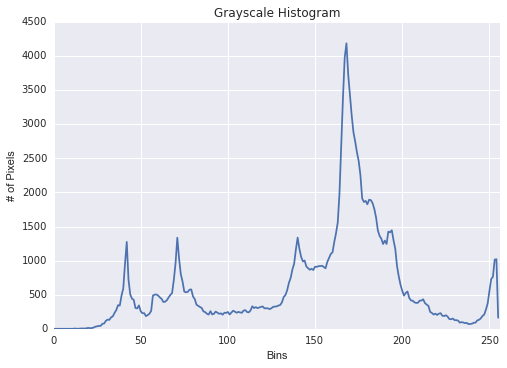
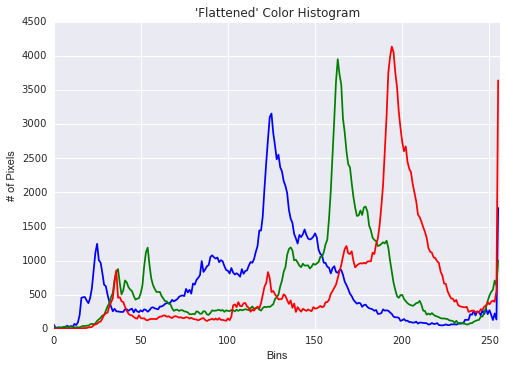
histograms
downsampled image
dominant colours
degree of colour relationship
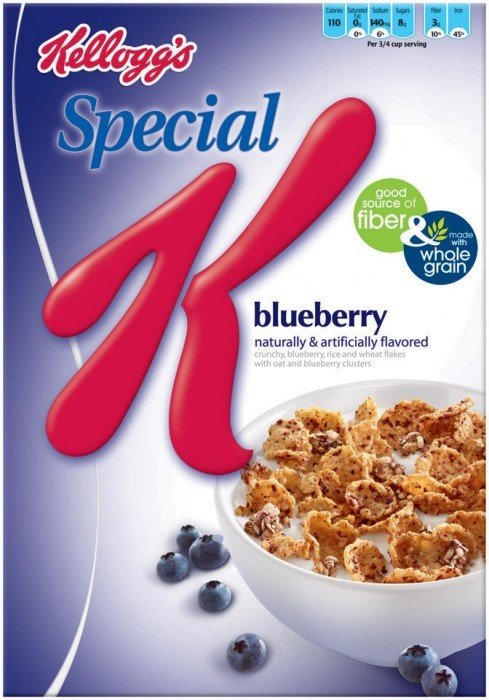
has white background
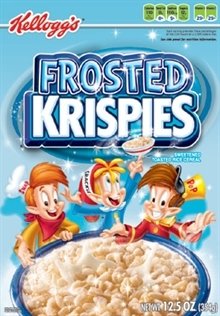
has spokes-character
has downward gaze
VS
cereals.cf_score.hist(bins=25)sns.barplot(x="has_character", y="cf_score",
hue='cf_target_market', data=cereals)sns.stripplot(x="cf_target_market", y="cf_score", data=cereals)sns.barplot(x="has_white_bg", y="cf_score", data=cereals)sns.barplot(x="has_character", y="cf_score", data=cereals)sns.barplot(x="has_downard_gaze", y="cf_score", data=cereals)sns.barplot(x="most_dominant_colour", y="cf_score", data=cereals);PARAGON
AWARD
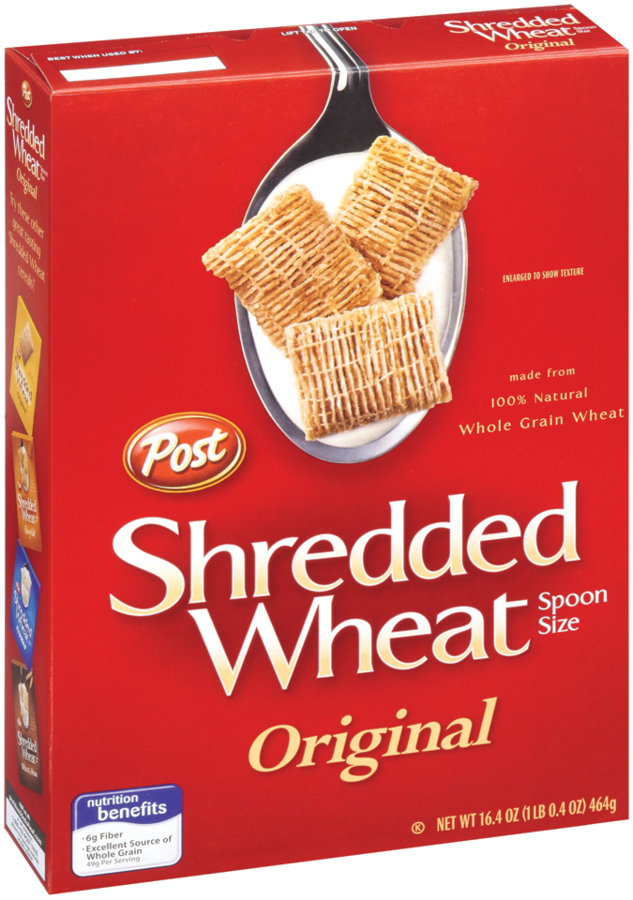
| cf_score | dominant_colour | has_character |
|---|---|---|
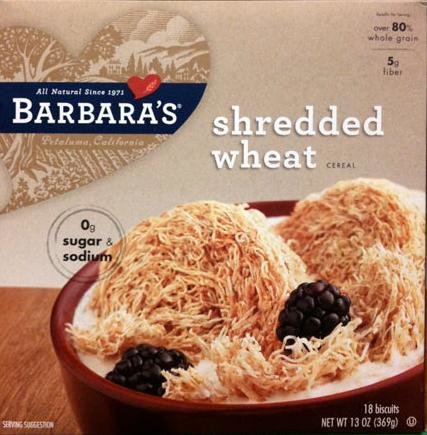
| 82 | grey | no |
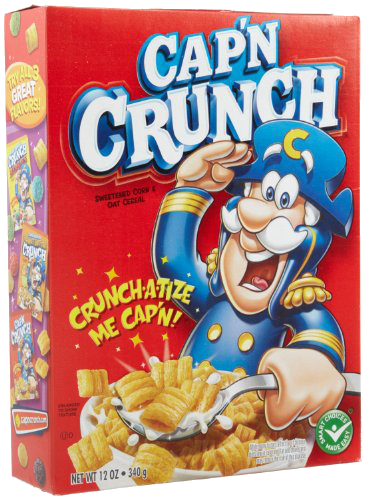
DUKE NUKEM
AWARD
| cf_score | dominant_colour | has_downward_gaze |
|---|---|---|
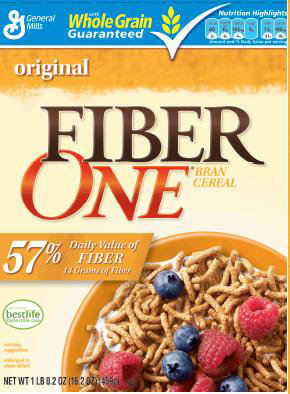
| 46 | yellow | yes |
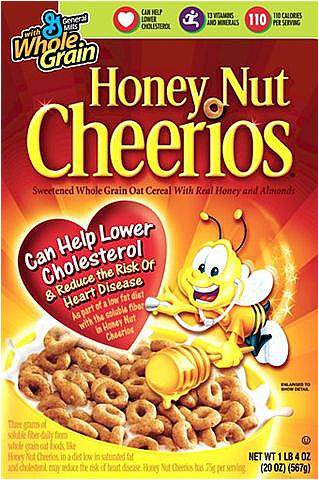
CROSSED WIRES
AWARD
| cf_score | dominant_colour | has_downward_gaze |
|---|---|---|
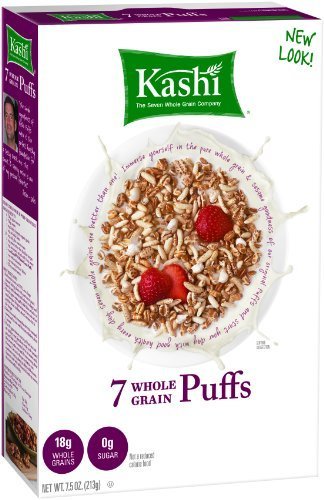
| 64 | grey | yes |
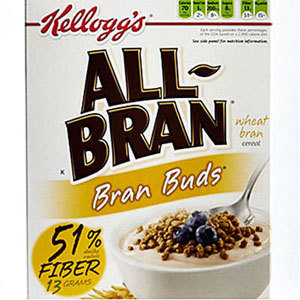
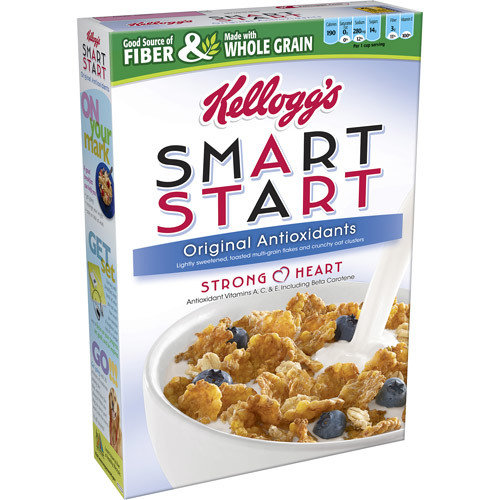
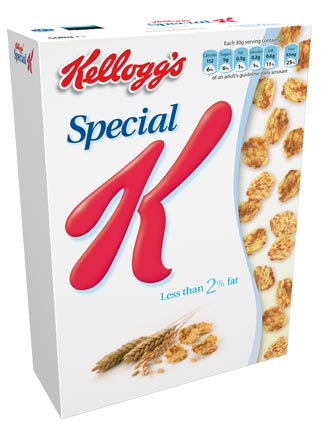
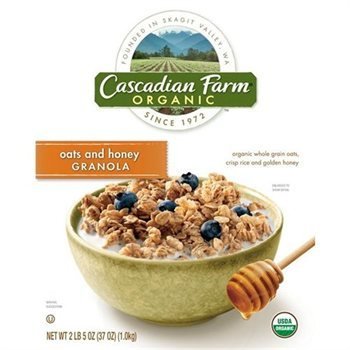
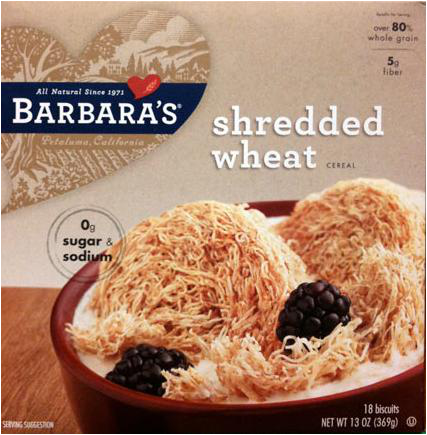
honestly good
| cf_score | dominant_colour | has_character |
|---|---|---|
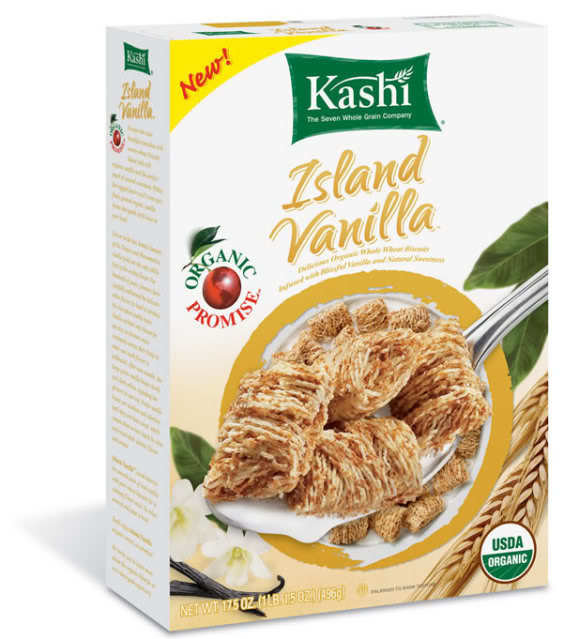
| 36 | white | no |
secretly terrible
We're Hiring!
apply@droste.hk
m@droste.hk
gh : @tijptjik
mart van de ven