GIS for energy simulation and analysis 2 : using skills in complex models, analyses and visualisations.
Analysing the air pollution at schools and nurseries.
-
In the last lecture I introduced a case study about roadside pollution.
-
As a recap
- DEFRA provide estimates of roadside air pollution, estimated from traffic counts and emissions factors as well as measured pollution and dispersion modelling.
-
This dataset was combined with data on schools to identify establishments within 150 m of roads exceeding the EU limit value of 40 µg/m3 of NO2.
- Used in the poisoned playgrounds campaign
- A GIS was used to calculate euclidean distances to all roads in the dataset
- Results presented in a web GIS
- Today we'll dive into that case study, looking in more detail at the data and methods used, extending it to a new use case and also look at how this could become the basis of a commercial project.
-
I also have some advanced visualisations to show you, demonstrating how I moved beyond GIS.
-
None of these are about energy, but the process and methods are directly transferable

NO2 / Pm2.5 and schools
- Background
- ClientEarth had seen some similar analysis and wanted to commission some work to underpin a campaign about children's exposure to air pollution in schools
- They didn't have the technical skills so reached out to our research group
- They wanted to quantify the schools exposed to pollutant levels exceeding EU limits of 40 µg/m3 of NO2.
- As an output they wanted a spreadsheet of all schools with pollutant exposure.
- An academic project, so there was also lots of scope for analysis
- Air pollution
- Data describing annual mean concentrations of NO2 and other pollutants 4 metres from major roads was obtained from Defra
- 2015 pollution levels and spatial road data https://uk-air.defra.gov.uk/data/gis-mapping
- UK NO2 concentration in 1km2 grid square https://uk-air.defra.gov.uk/data/laqm-background-maps?year=2013
- Data describing annual mean concentrations of NO2 and other pollutants 4 metres from major roads was obtained from Defra
- Schools - to cover whole UK multiple datasets necessary
- England and Wales - http://www.education.gov.uk/edubase/home.xhtml
- Scotland - http://www.gov.scot/Topics/Statistics/Browse/School-Education/Datasets/contactdetails
- Northern Ireland - http://data.nicva.org/dataset/school-locations, http://apps.education-ni.gov.uk/appinstitutes/default.aspx
Data
-
Some Additional data was necessary
- OS Code-Point Open dataset provided coordinates of Scottish postcode unit (the full, most detailed postcode), used to geolocate schools
- Northern Irish postcode unit coordinates were obtained from FreeMapTools10, as above
- Basemap data for use in static maps was obtained from ESRI11
- Local Authority polygons were obtained from InFuse
-
Data manipulation
- Removed columns
- The remaining columns were harmonised so that establishment name, address andcontact details were described as a minimum.
- School types were derived from multiple columns
- A consistent unique reference number was given to all establishments.
- OSGB 1936, used as the standard
- Where spatial data was missing derived from postcode.
- Northern Irish coordinates have been projected from Irish National Grid coordinate system the before the calculation of proximity.
-
Pollutant concentrations were assigned to educational establishments in four ways:
- The closest road in the roads database to each establishment was identified and the concentration of all pollutants at that road assigned to the establishment, as well as distance in metres (m),
- The closest road to each establishment which exceeded 40μg/m3 of NO2 was identified and the concentration of all pollutants at that road assigned to the establishment, as well as distance in metres (m),
- The grid square within which each establishment is located was identified and the 2013 NO2 concentration in that square was attributed to the establishment
- all roads from the roads database within1 km of each establishment were identified and all pollutants and distance in metres recorded.
- Analysis using ArcGIS
Schools and limit values
Using 2015 data and a distance of 150 m or less to roads exceeding the EU limit value. Schools within 150 m of roads exceeding the limit value by type:
- 1020 Educational establishment in GB
- 981 in England
- 12 in Wales
- 11 in Scotland
- 16 in Northern Ireland
|
Rank |
Local Authority Name |
Number Of Pupils |
|
1 |
Hackney, London Borough of |
18323 |
|
2 |
Camden, London Borough of |
15955 |
|
3 |
Tower Hamlets, London Borough of |
14977 |
|
4 |
Lambeth, London Borough of |
14780 |
|
5 |
Kensington & Chelsea, Royal Borough of |
14274 |
|
6 |
Wandsworth, London Borough of |
13162 |
|
7 |
Southwark, London Borough of |
12517 |
|
8 |
Islington, London Borough of |
10705 |
|
9 |
Westminster, London Borough of |
10673 |
|
10 |
Newham, London Borough of |
9870 |
|
11 |
Hammersmith & Fulham, London Borough of |
9774 |
|
12 |
Haringey, London Borough of |
9516 |
|
13 |
Lewisham, London Borough of |
8000 |
|
14 |
Birmingham City Council |
7250 |
|
15 |
Hounslow, London Borough of |
6899 |
|
16 |
Enfield, London Borough of |
6515 |
|
17 |
Ealing, London Borough of |
6009 |
|
18 |
Barnet, London Borough of |
5907 |
|
19 |
Stockport Metropolitan Borough Council |
5660 |
|
20 |
Merton, London Borough of |
4312 |
Text


Excellent visual outcomes and a national campaign ...
- http://samkallen.co.uk/poisoned_playgrounds.html
- But terrible mapping ......... Back to that at the end
NO2 and Nurseries
- Background
- UCL IEDE researchers and PhD students had some funding to retrofit a London nursery with mechanical ventilation and carry out a longitudinal study of the indoor air quality.
- They were aware of my previous analysis and wanted to repeat this with a different set of data
- I approached this differently having improved my knowledge of the data and coding skills
- All code and links to data available https://github.com/ucesres/no2_nurseries
- I will go through the steps to carry out this analysis, feel free to follow along - downloading the data should only take a couple of minutes
- Simpler than previous analysis, less data and more knowledge
NO2 and Nurseries
- Step 1: Identify and filter up to data air quality data
- In this case I was only interested in concentrations
- For London there is a dataset which includes modelled 2016 ground level concentrations of annual mean NOx, NO2, PM10 and PM2.5 in µg/m3 at 20m grid resolution. For PM10, it also includes the number of daily means exceeding 50 µg/m3. https://data.london.gov.uk/dataset/london-atmospheric-emissions-inventory--laei--2016
- Load them into a python native format
# Load them into a pandas table
no2 = pandas.read_csv('../data/CSV/LAEI2016_2016_NO2.csv')
pm25 = pandas.read_csv('../data/CSV/LAEI2016_2016_PM25.csv')
NO2 and Nurseries
- Step 2: Identify and filter up to data nursery data
- The previous project identified educational establishment data, from https://get-information-schools.service.gov.uk/Downloads
- Again load into pandas - this dataset, unusually is not utf8 encoded, so needs some wrangling
edub = pandas.read_csv('../data/edubasealldata20190816.csv', encoding = "ISO-8859-1", low_memory = False)-
There are several ways of filtering edubase to show only nurseries
- By incorporating ancillary data in this case a list of London boroughs from wikipedia https://en.wikipedia.org/wiki/List_of_London_boroughs. The data shows that there are 5598 educational establishments in London.
- In Python ...
bors = ['Barking and Dagenham', 'Barnet' ,'Bexley','Brent', 'Bromley','Camden','Croydon','Ealing',
'Enfield','Greenwich','Hackney', 'Hammersmith and Fulham','Haringey','Harrow','Havering','Hillingdon'
,'Hounslow','Islington', 'Kensington and Chelsea','Kingston upon Thames', 'Lambeth', 'Lewisham',
'Merton', 'Newham', 'Redbridge', 'Richmond upon Thames', 'Southwark', 'Sutton', 'Tower Hamlets',
'Waltham Forest','Wandsworth','Westminster']

len(edub.loc[edub["LA (name)"].isin(bors)])- The EstablishmentTypeGroup (name) field has a "local authority nursery school" option, but there are only 95 of these in London
len(edub.loc[(edub["LA (name)"].isin(bors) & (edub["PhaseOfEducation (name)"] == "Nursery"))])- PhaseOfEducation (name) has a "nursery" option these are the same as the local authority option. Common sense suggests this is a low figure.
len(edub.loc[(edub["LA (name)"].isin(bors) & (edub["TypeOfEstablishment (name)"] == "Local authority nursery school"))])- A better filter are establishments which have nursery classes, where there are 2316, this doesn't include all of the nursery labelled establishment
len(edub.loc[(edub["LA (name)"].isin(bors) & (edub["NurseryProvision (name)"] == "Has Nursery Classes"))])
# 2316
len(edub.loc[(edub["LA (name)"].isin(bors) & (edub["NurseryProvision (name)"] == "Has Nursery Classes")  &
(edub["TypeOfEstablishment (name)"] == "Local authority nursery school"))])
# 81- So both filters are used and the dataframe cleaned up
nurseries =nurseries.append(edub.loc[(edub["LA (name)"].isin(bors) &
(edub["TypeOfEstablishment (name)"] == "Local authority nursery school"))])

nurseries = nurseries.drop_duplicates('URN')

nurseries = nurseries.loc[nurseries.Easting !=0]

nurseries.to_csv("../data/london_nurseries_edubase_2019.csv")
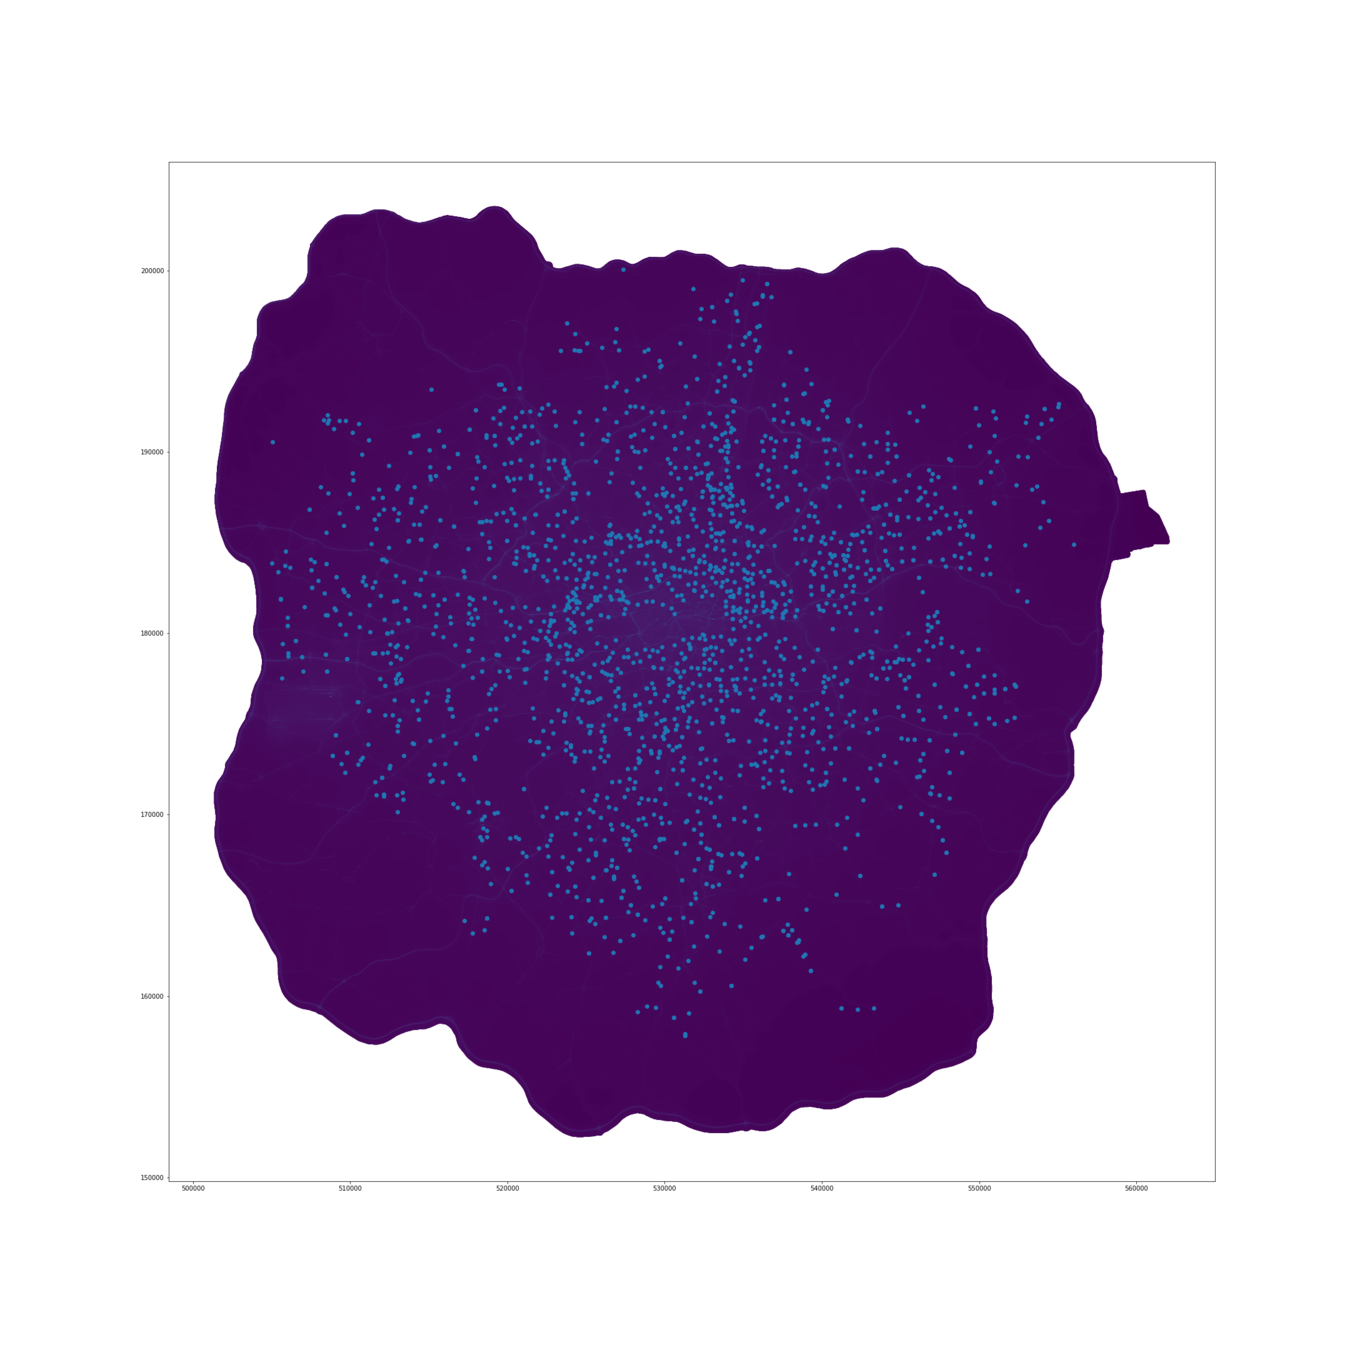
- To establish that the schools data extraction is complete, the coordinates are OK and the projections similar - plot them on top of each other
plt.figure(figsize=(30,30))
plt.scatter(no2.x.values, no2.y.values,c = no2.conc.values )
plt.scatter(nurseries.Easting.values, nurseries.Northing.values)
- Use KD nearest neighbours from scipy to calculate the closest points, as a position in a list of points
from scipy.spatial import KDTree
from shapely.geometry import Point

nursery_pts = nurseries[["Easting", "Northing"]].values

no2_tree = KDTree(no2[['x','y']].values)

nearest_no2 = no2_trees.query(nursery_pts)

pm25_tree = KDTree(pm25[['x','y']].values)

nearest_pm25 = pm25_tree.query(nursery_pts)- Extract into a neat form
no2_x = []
no2_y = []
no2_concs = []
for i in nearest_no2[1]:
    no2_x.append(no2.loc[i]["x"])
    no2_y.append(no2.loc[i]["y"])
    no2_concs.append(no2.loc[i]["conc"])
nurseries["no2_x"] = no2_x
nurseries["no2_y"] = no2_y
nurseries["no2_µg/m3"] = no2_concs

pm_x = []
pm_y = []
pm_concs =[]

for i in nearest_pm25[1]:
    pm_x.append(pm25.loc[i]["x"])
    pm_y.append(pm25.loc[i]["y"])
    pm_concs.append(pm25.loc[i]["conc"])
nurseries["pm_x"] = pm_x
nurseries["pm_y"] = pm_y
nurseries["pm25_µg/m3"] = pm_concs- Test that the difference is less that 1/2 of the grid square (10 m)
max(nurseries["pm_x"] - nurseries["Easting"])

max(nurseries["pm_y"] - nurseries["Northing"])

max(nurseries["no2_y"] - nurseries["Northing"])

max(nurseries["no2_x"] - nurseries["Easting"])

nurseries.to_csv("../data/london_nurseries_edubase_2019_with_concs.csv")- Project complete
Web GIS and advanced vis examples
To convert data to geojson
lats = []
lons = []
for i in nurs.index:
    r = requests.get("https://www.bgs.ac.uk/data/webservices/CoordConvert_LL_BNG.cfc?method=BNGtoLatLng&easting="
    +str(nurs.loc[i]["Easting"])+"&northing="+str(nurs.loc[i]["Northing"]), verify=False)
    rr = json.loads(r.text)
    lats.append(rr["LATITUDE"])
    lons.append(rr["LONGITUDE"])

nurs["x"] = lons
nurs["y"] = lats

def data2geojson(df):
    features = []
    insert_features = lambda X: features.append(
            geojson.Feature(geometry=geojson.Point((X["X"],
                                                    X["Y"],
                                                    0)),
                            properties=dict(URN=X["URN"],
                                            NO2_conc=X['no2_µg/m3'],
                                            PM25_conc=X['pm25_µg/m3'],
                                            EstablishmentName= X['EstablishmentName'],
                                            NumberOfPupils=X['NumberOfPupils'],
                                            Address=X['Street']
                                           )))
    df.apply(insert_features, axis=1)
    with open('nursery.geojson', 'w', encoding='utf8') as fp:
        geojson.dump(geojson.FeatureCollection(features), fp, sort_keys=True, ensure_ascii=False)

 data2geojson(nurs)