from supervised learning ...
to unsupervised learning
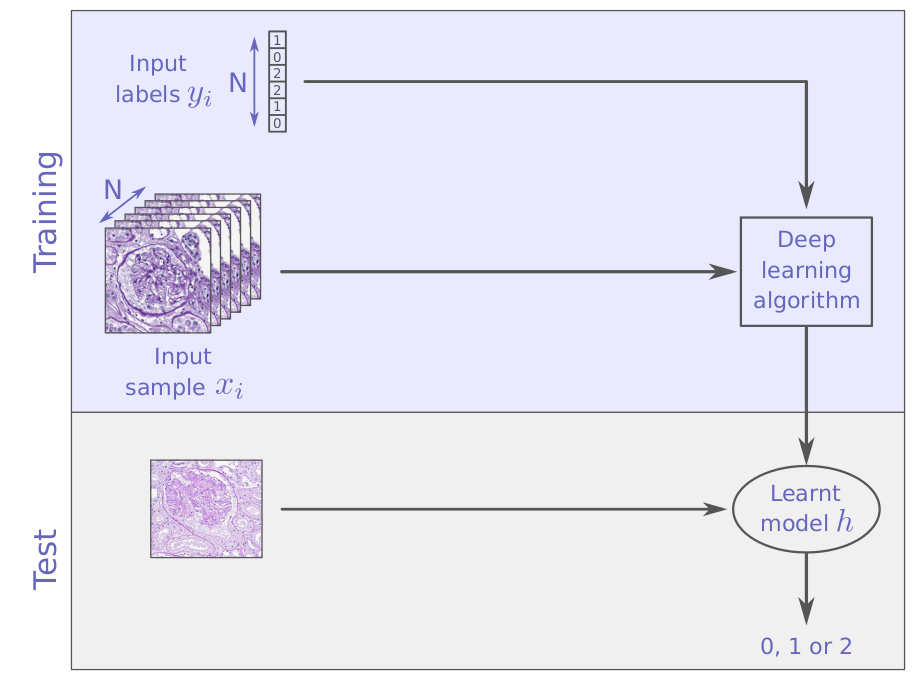
supervised learning
unsupervised learning
unsupervised learning
unsupervised learning
unsupervised learning
unsupervised learning
unsupervised learning
... efficient representations (embedding, interpret)
... estimations of your data distribution (generate new samples)
... groups of similar samples (free labels, fill blanks)
... outliers (anomaly detection, de-noising)
with unsupervised learning you can find
unsupervised learning
Dimension reduction
Clustering
How to ?
unsupervised learning
Dimension reduction
"the curse of dimensionality"
To avoid redundancy and unnecessary computational load
To visualize the data
To improve data representation
(supervised task pre-processing: semi-supervised learning)
unsupervised learning
Dimension reduction
Feature selection
Feature extraction
unsupervised learning
Feature selection
| feat1 | feat2 | feat3 | feat4 | feat5 | |
|---|---|---|---|---|---|
| x1 | 1 | 2 | 2 | 6 | 3 |
| x2 | 2 | 4 | 4 | 12 | 7 |
| x3 | 3 | 6 | 8 | 24 | 9 |
| ... | |||||
| xn | 4 | 8 | 16 | 48 | 11 |
unsupervised learning
Feature selection
| feat1 | feat2 | feat3 | feat4 | feat5 | |
|---|---|---|---|---|---|
| x1 | 1 | 2 | 2 | 6 | 3 |
| x2 | 2 | 4 | 4 | 12 | 7 |
| x3 | 3 | 6 | 8 | 24 | 9 |
| ... | |||||
| xn | 4 | 8 | 16 | 48 | 11 |
unsupervised learning
| feat1 | feat2 | feat3 | feat4 | feat5 | |
|---|---|---|---|---|---|
| x1 | 1 | 2 | 2 | 6 | 3 |
| x2 | 2 | 4 | 4 | 12 | 7 |
| x3 | 3 | 6 | 8 | 24 | 9 |
| ... | |||||
| xn | 4 | 8 | 16 | 48 | 11 |
Feature selection
unsupervised learning
| feat1 | feat3 | feat5 | |
|---|---|---|---|
| x1 | 1 | 2 | 3 |
| x2 | 2 | 4 | 7 |
| x3 | 3 | 8 | 9 |
| ... | |||
| xn | 4 | 16 | 11 |
Feature selection
unsupervised learning
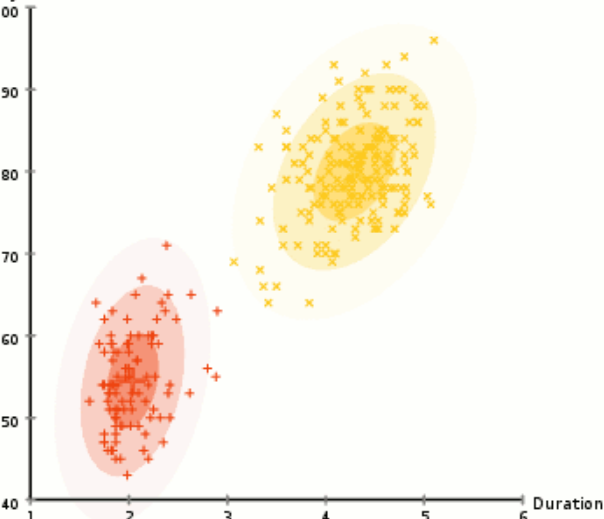
Feature selection example with the Breast Cancer dataset
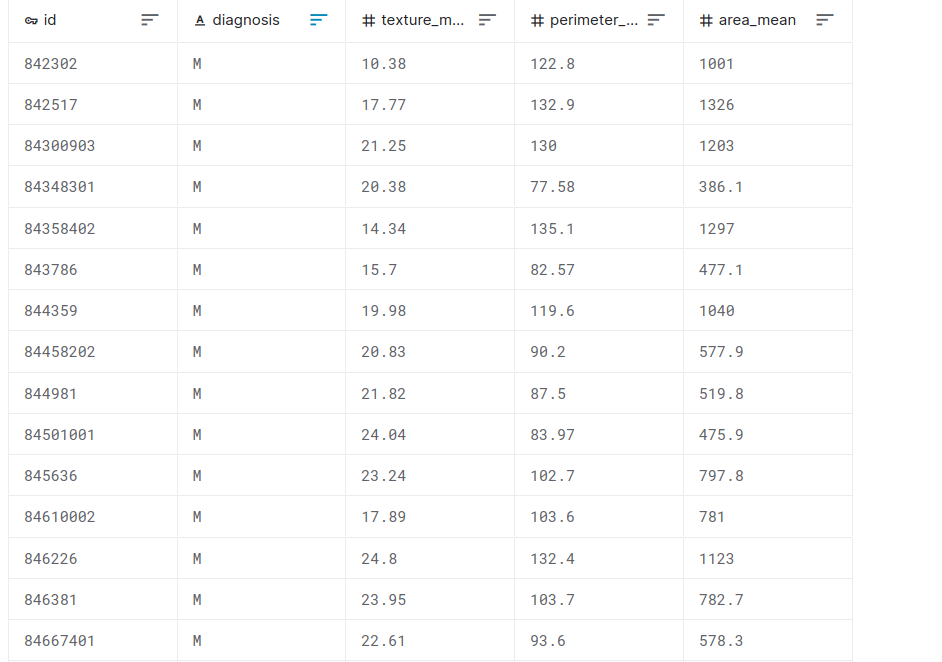
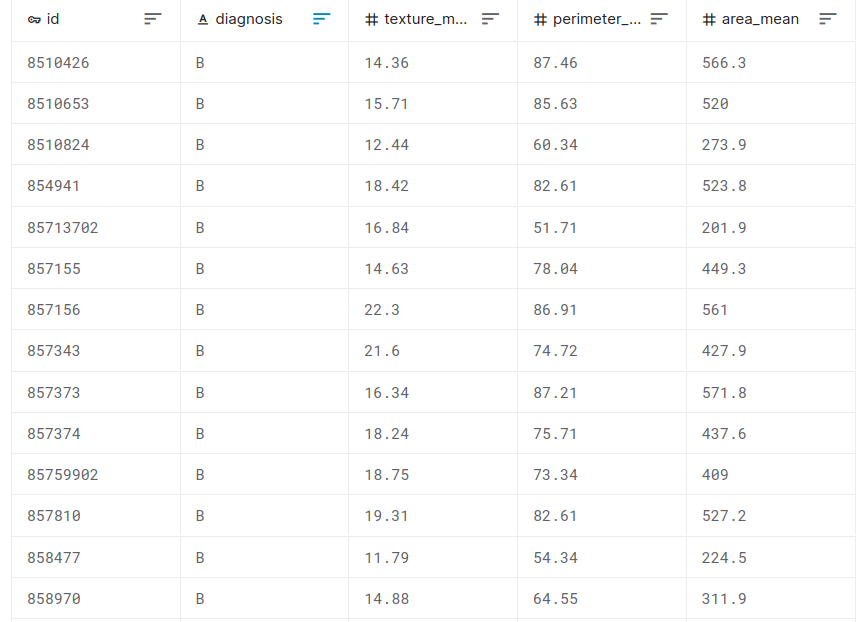
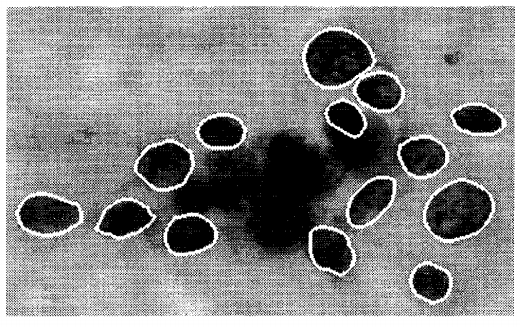
malignant breast fine needle aspirates
unsupervised learning
Feature selection example with the Breast Cancer dataset
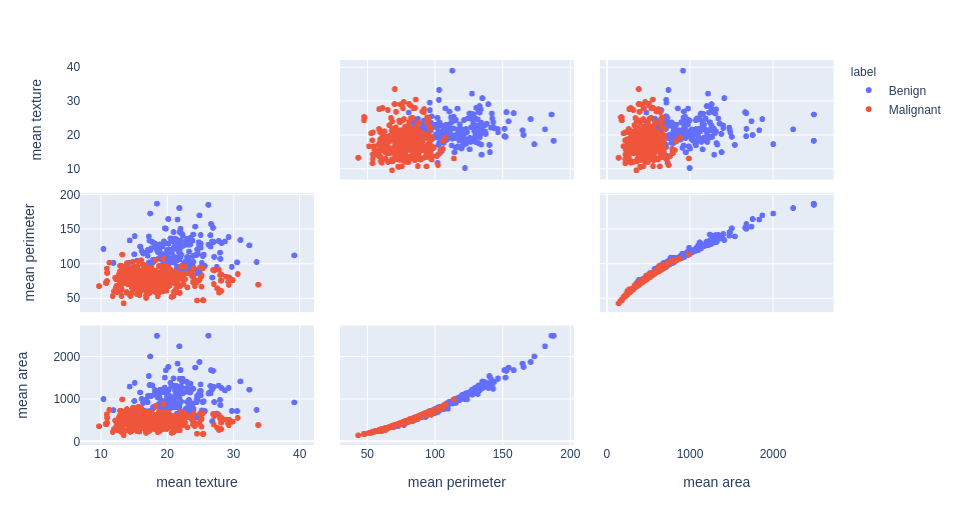
unsupervised learning
Feature selection example with the Breast Cancer dataset
unsupervised learning
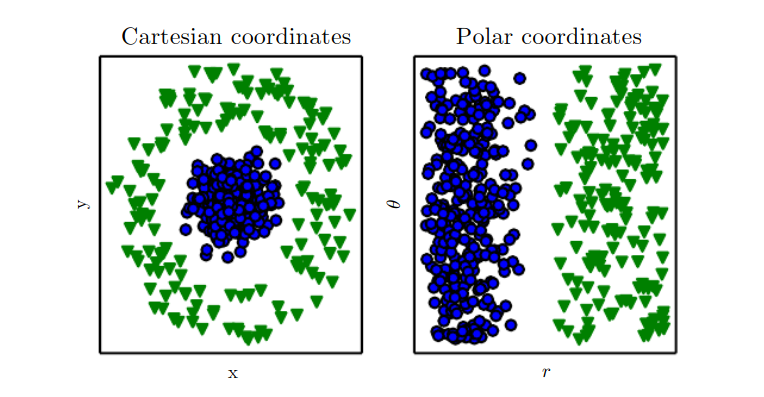
e.g. Principal Component Analysis (PCA)
Feature extraction
unsupervised learning
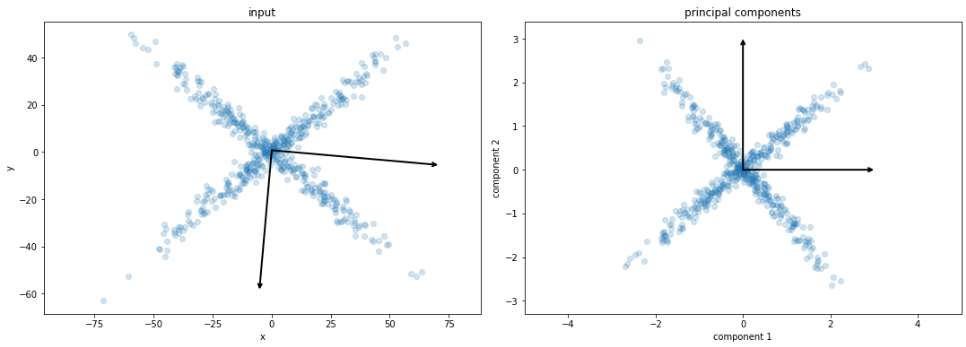
e.g. Principal Component Analysis (PCA)
Feature extraction
linearly combine features to find mutually orthogonal components
the (principal) components are ranked from
the most "significant" to least "significant"
projecting the data on the first components maximize its spread (variance)
dimension reduction: select the d first components
unsupervised learning
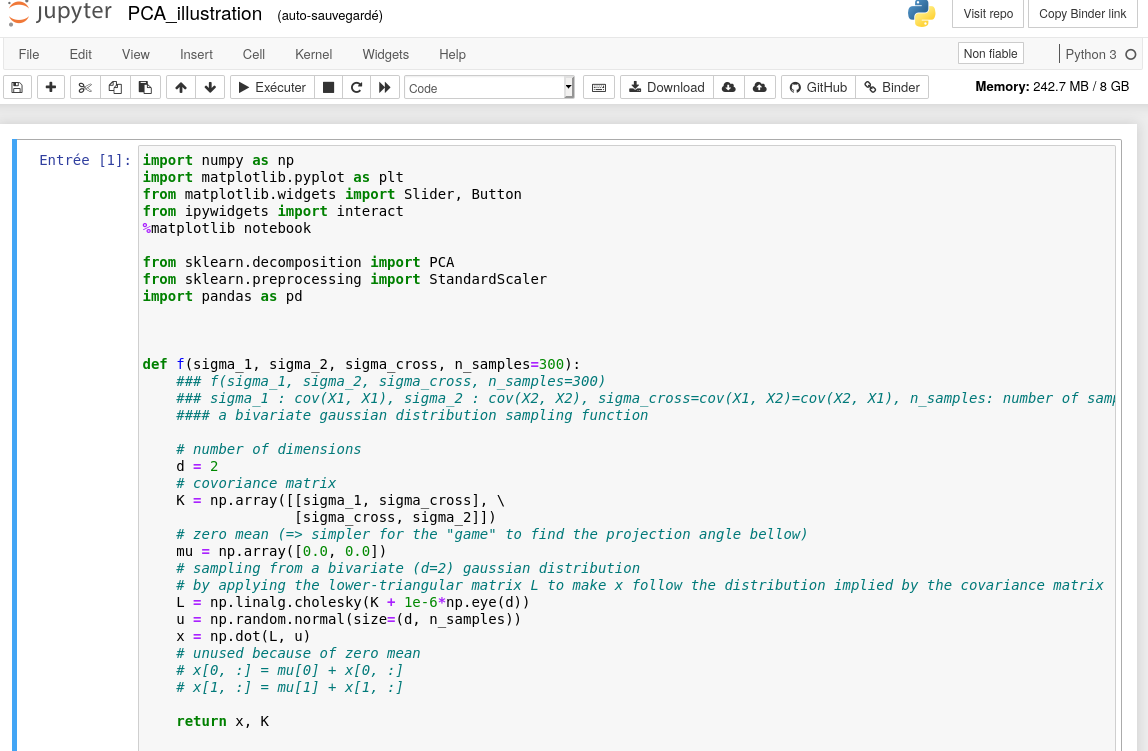
demo with PCA
Feature extraction
unsupervised learning
demo with PCA
Feature extraction
unsupervised learning
PCA
Feature extraction
unsupervised learning
PCA
Feature extraction
unsupervised learning
PCA
Feature extraction
unsupervised learning
PCA
Feature extraction
unsupervised learning
PCA
Feature extraction
unsupervised learning
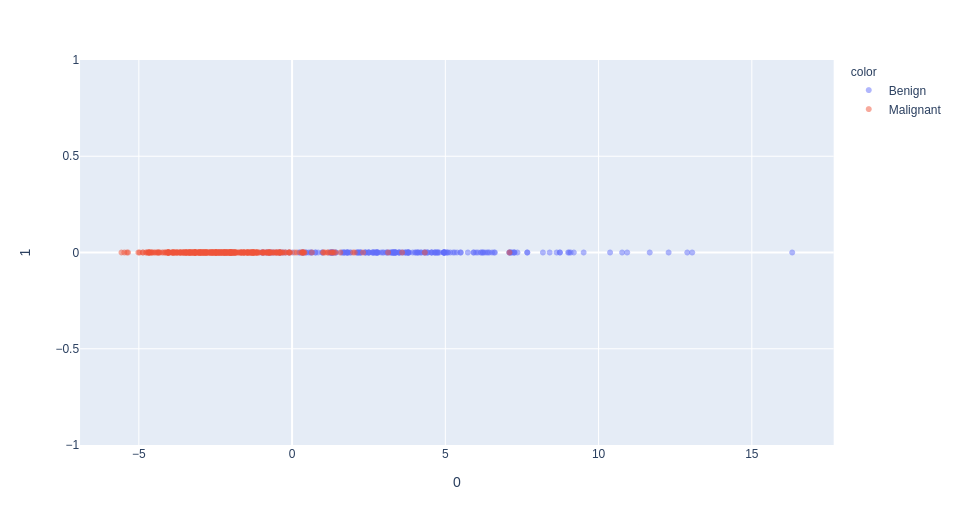
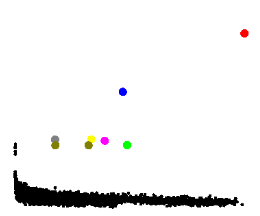
1st dimension of PCA
selection of the "mean texture" feature (normalized)
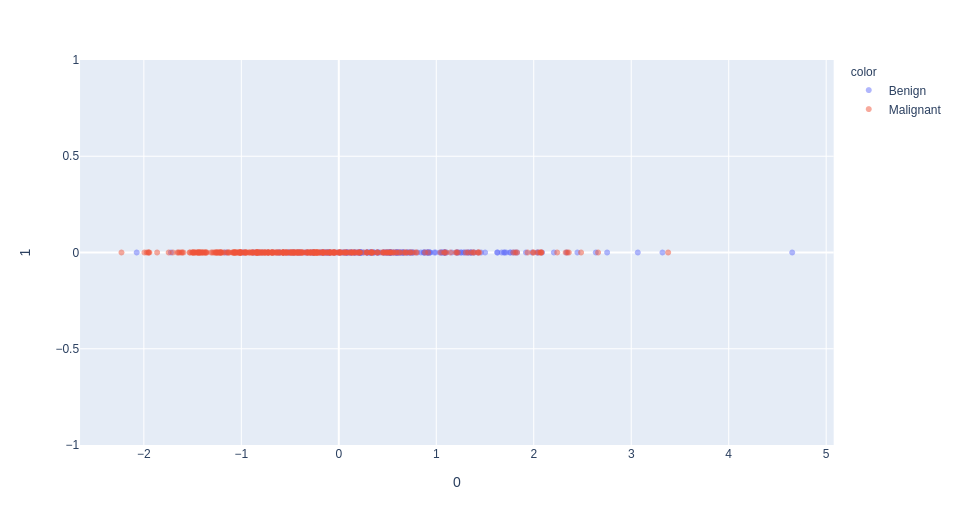
unsupervised learning
Dimension reduction (linear)
ICA
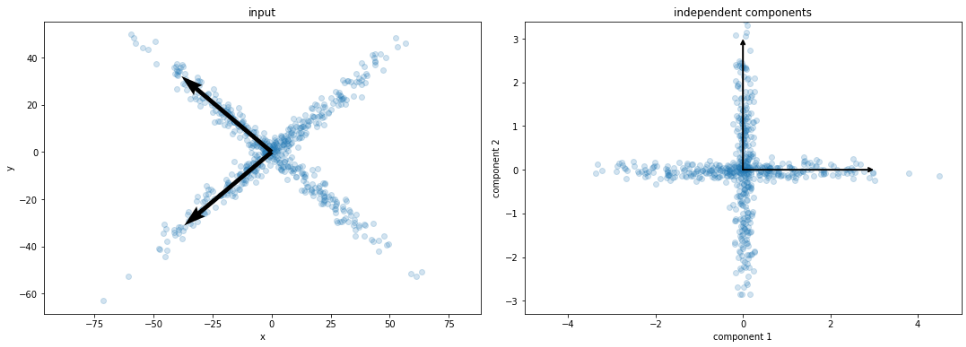
PCA
ICA
unsupervised learning
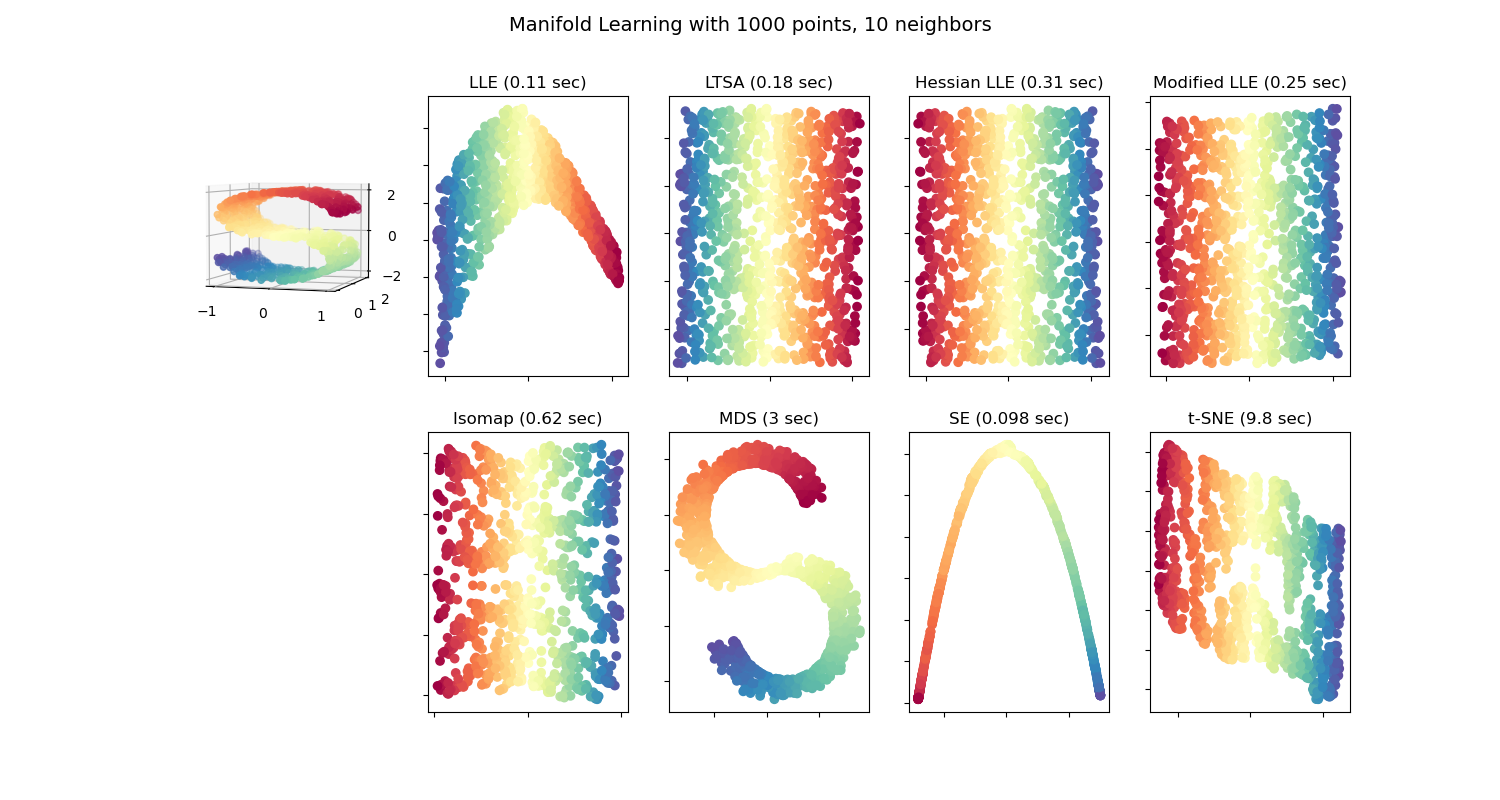
ISOMAP
Locally Linear Embedding
Hessian Eigenmapping
Local Tangent Space Alignment
t-distributed Stochastic Neighbor Embedding (t-SNE)
UMAP
(deep) auto-encoders...
non-linear
dimension reduction
unsupervised learning
Dimension reduction (non-linear)
| 0.9 | |||||||||
similarity matrix in input space
t-distributed Stochastic Neighbor Embedding (t-SNE)
unsupervised learning
Dimension reduction (non-linear)
| 0.2 |
similarity matrix in input space
t-distributed Stochastic Neighbor Embedding (t-SNE)
unsupervised learning
Dimension reduction (non-linear)
| 0.9 | |||||||||
| 0.2 |
| 0.8 | |||||||||
| 0.3 |
similarity matrix in input space
similarity matrix in lower space
t-distributed Stochastic Neighbor Embedding (t-SNE)
unsupervised learning
Dimension reduction (non-linear)
similarity matrix in input space
similarity matrix in lower space
t-distributed Stochastic Neighbor Embedding (t-SNE)
unsupervised learning
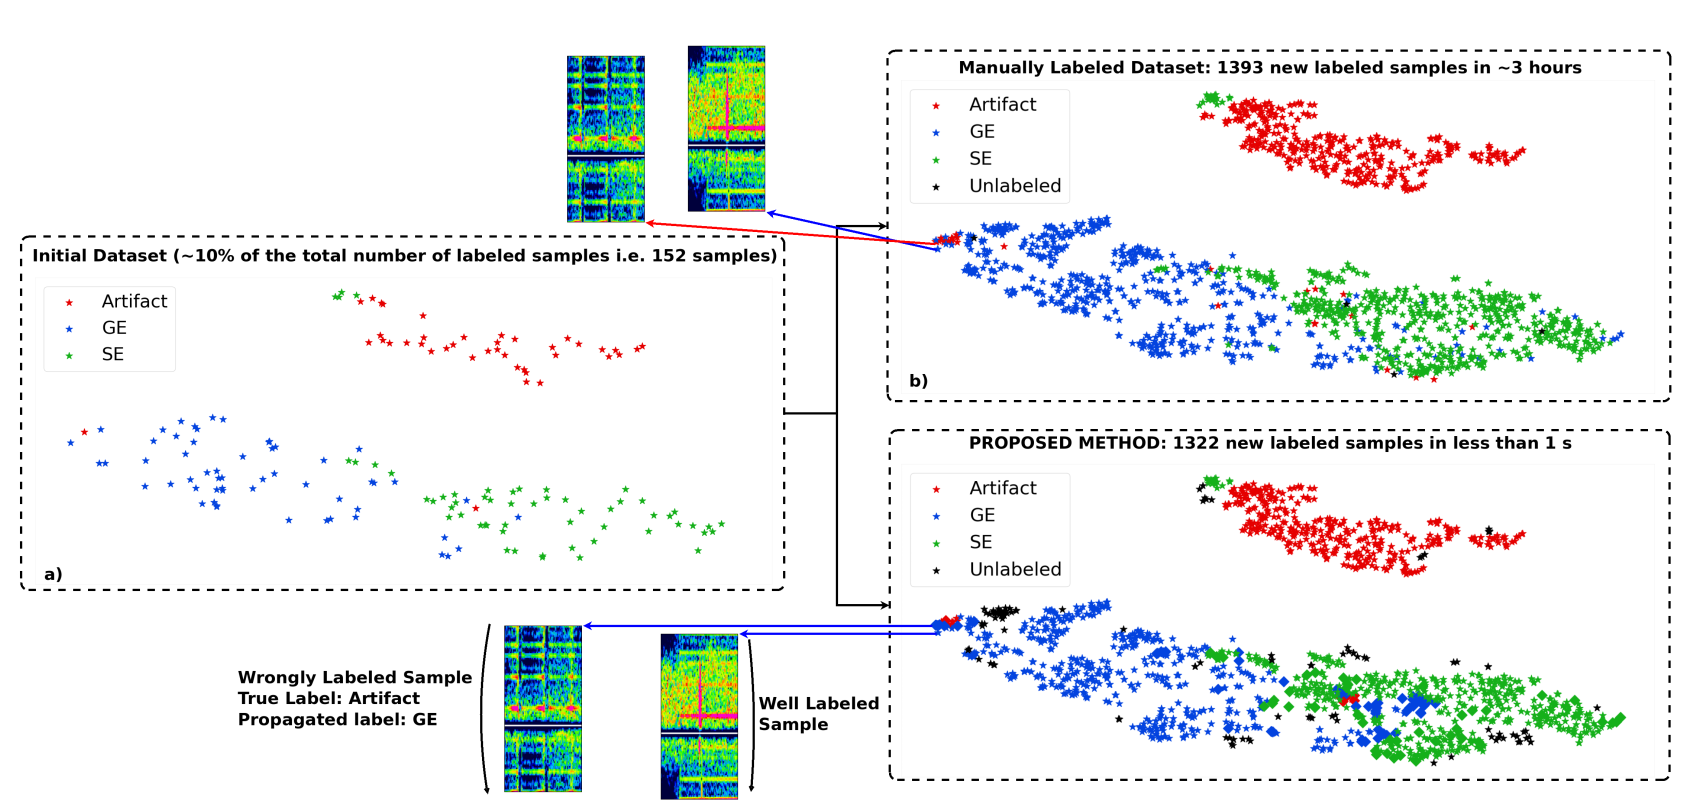
(Vindas et al. 2021, IEEE IUS 2021 submitted)
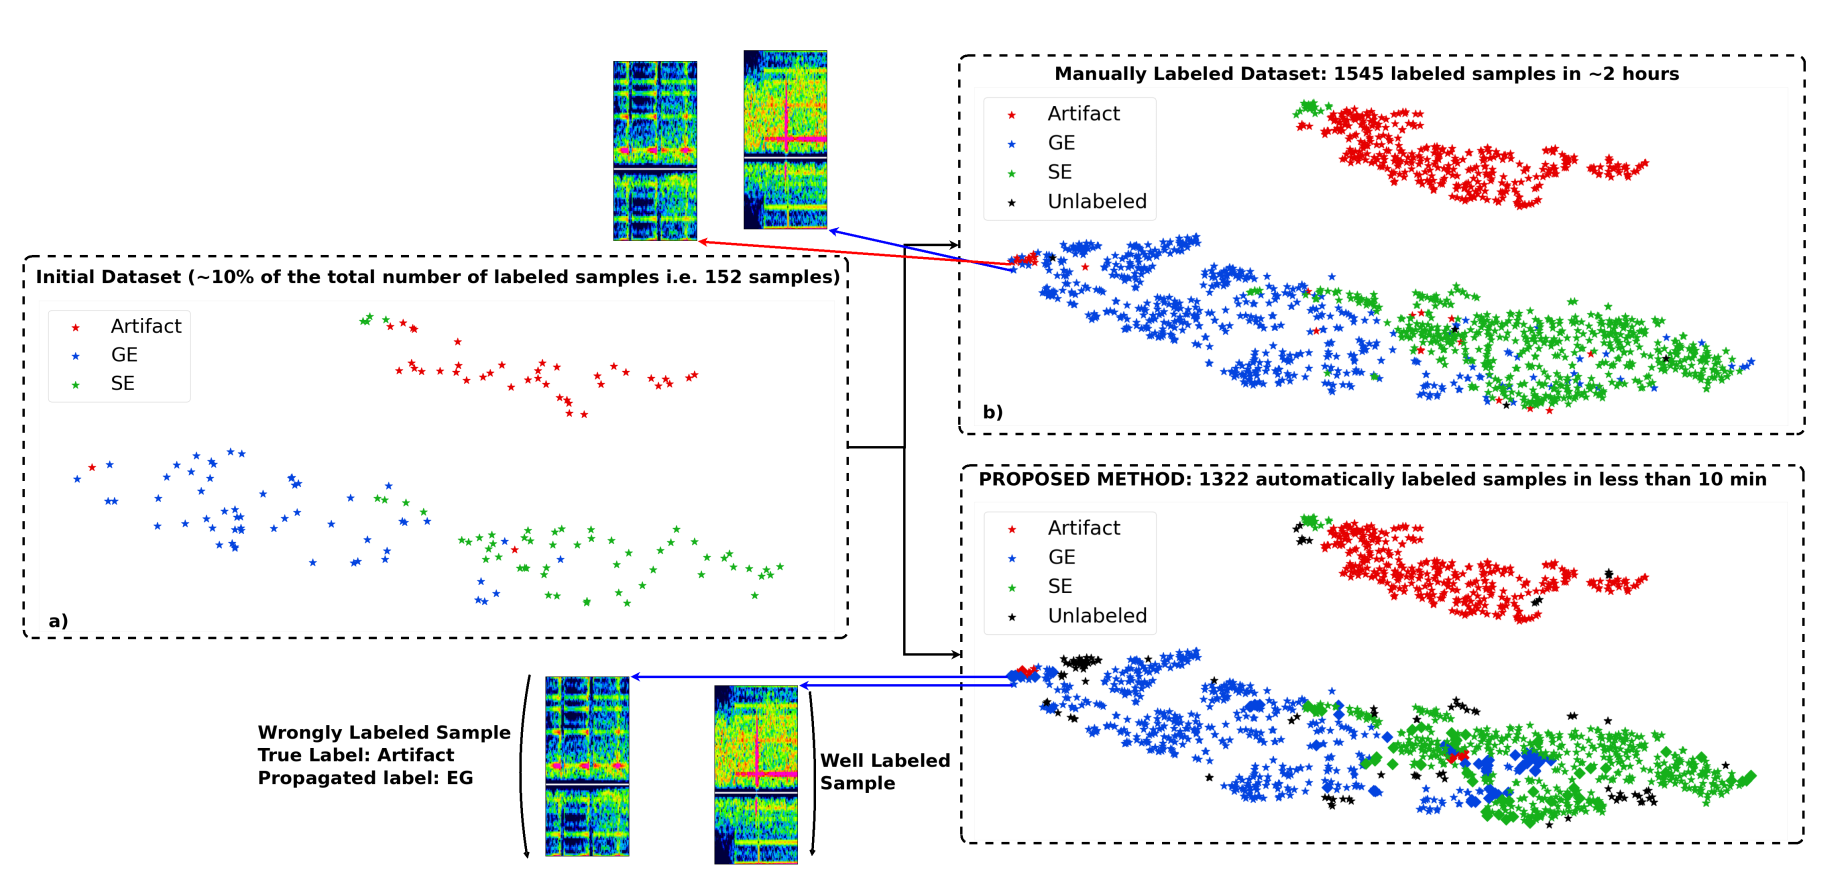
example of t-SNE application
accelerating the annotation of a
Transcranial Doppler ultrasound micro-embolic dataset
unsupervised learning
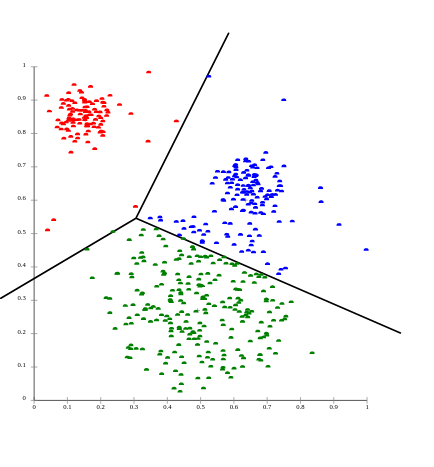
Find groups of similar examples (clusters)
clustering
unsupervised learning
what is a cluster ?
clustering
unsupervised learning
clustering
d
what is a cluster ?
- distance-based definition
unsupervised learning
clustering
what is a cluster ?
- distance-based definition
- density-based definition
unsupervised learning
clustering
what is a cluster ?
- distance-based definition
- density-based definition
- distribution-based definition
unsupervised learning
clustering
what is a cluster ?
- distance-based definition
- density-based definition
- distribution-based definition
- path-based distribution (graphs)
unsupervised learning
clustering
K-means (distance-based method)
unsupervised learning
clustering
- initialize k samples as centers *
K-means (distance-based method)
unsupervised learning
clustering
- initialize k samples as centers
- for each sample associate the label of its closest center
K-means (distance-based method)
unsupervised learning
clustering
- initialize k samples as centers *
- for each sample associate the label of its closest center
- update the centers (mean position of its group)
K-means (distance-based method)
unsupervised learning
clustering
- initialize k samples as centers *
- for each sample associate the label of its closest center
- update the centers (mean position of its group)
- repeat steps 2. and 3. until no update in the clusters
K-means (distance-based method)
unsupervised learning
clustering
- initialize k samples as centers *
- for each sample associate the label of its closest center
- update the centers (mean position of its group)
- repeat steps 2. and 3. until no update in the clusters
K-means (distance-based method)
unsupervised learning
clustering
- initialize k samples as centers *
- for each sample associate the label of its closest center
- update the centers (mean position of its group)
- repeat steps 2. and 3. until no update in the clusters
K-means (distance-based method)
unsupervised learning
clustering
- initialize k samples as centers *
- for each sample associate the label of its closest center
- update the centers (mean position of its group)
- repeat steps 2. and 3. until no update in the clusters
K-means (distance-based method)
unsupervised learning
clustering
- initialize k samples as centers *
- for each sample associate the label of its closest center
- update the centers (mean position of its group)
- repeat steps 2. and 3. until no update in the clusters
K-means (distance-based method)
unsupervised learning
clustering
- initialize k samples as centers *
- for each sample associate the label of its closest center
- update the centers (mean position of its group)
- repeat steps 2. and 3. until no update in the clusters
K-means (distance-based method)
unsupervised learning
clustering
+ fast (O(n))
- need to know / find k (number of clusters)
- can detect only circular clusters
alt. k-median (more computation because need to sort...)
K-means (distance-based method)
unsupervised learning
clustering
hierarchical clustering (distance-based method)
agglomerative (bottom up) or divisive (top-down)
use of an appropriate metric d (between samples a and b)
and
a linkage criterion (dissimilarity between sets)
example: single-linkage clustering
unsupervised learning
clustering
hierarchical clustering (distance-based method)
unsupervised learning
clustering
hierarchical clustering (distance-based method)
unsupervised learning
clustering
hierarchical clustering (distance-based method)
unsupervised learning
clustering
hierarchical clustering (distance-based method)
unsupervised learning
clustering
hierarchical clustering (distance-based method)
unsupervised learning
clustering
hierarchical clustering (distance-based method)
unsupervised learning
clustering
hierarchical clustering (distance-based method)
unsupervised learning
clustering
hierarchical clustering (distance-based method)
unsupervised learning
clustering
hierarchical clustering (distance-based method)
unsupervised learning
clustering
hierarchical clustering (distance-based method)
unsupervised learning
clustering
hierarchical clustering (distance-based method)
unsupervised learning
clustering
hierarchical clustering (distance-based method)
unsupervised learning
clustering
hierarchical clustering (distance-based method)
unsupervised learning
clustering
hierarchical clustering (distance-based method)
unsupervised learning
clustering
hierarchical clustering (distance-based method)
unsupervised learning
clustering
unsupervised learning
clustering
unsupervised learning
clustering
unsupervised learning
clustering
hierarchical clustering (distance-based method)
+ does not need to know the number of clusters before.
+ does not depend on the chosen distance metric (source?)
+ sub-groups discovery
- lower efficiency, O(n^3)
unsupervised learning
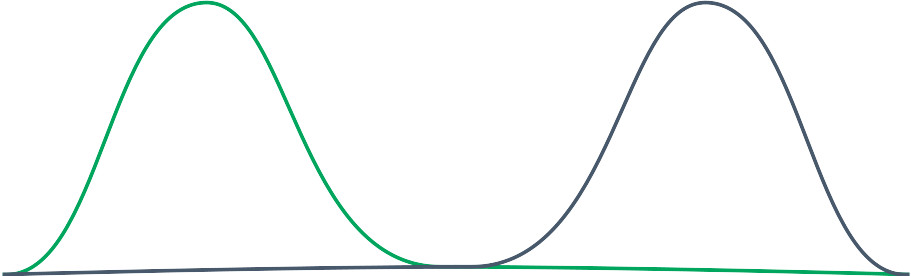
Gaussian Mixture Model with Expected-Maximization
(distribution-based method)
k-means with probability of assignment (instead of closest point assignment)
unsupervised learning
Gaussian Mixture Model with Expected-Maximization
(distribution-based method)
initialize the k = 2 distribution (*several strategies)
unsupervised learning
Gaussian Mixture Model with Expected-Maximization
(distribution-based method)
Expectation (E) step
find the probability for each point to be generated by each mixture
unsupervised learning
Gaussian Mixture Model with Expected-Maximization
(distribution-based method)
Expectation (E) step
find the probability for each point to be generated by each mixture
unsupervised learning
Gaussian Mixture Model with Expected-Maximization
(distribution-based method)
maximization (M) step:
fit the mixture to the samples
unsupervised learning
Gaussian Mixture Model with Expected-Maximization
(distribution-based method)
ready for a new E step ?
check the colors in the squares...
unsupervised learning
Gaussian Mixture Model with Expected-Maximization
(distribution-based method)
unsupervised learning
Gaussian Mixture Model with Expected-Maximization
(distribution-based method)
unsupervised learning
Gaussian Mixture Model with Expected-Maximization
(distribution-based method)
no more move ? assign the labels => clusters
or keep the multiple labels ...
unsupervised learning
clustering
Gaussian Mixture Model with Expected-Maximization
(distribution-based method)
+ not restricted to circular clusters... possibly ellipses !
+ support mixed membership labeling
+ you can generate new samples (probabilistic model)
- need to fix the number of Gaussians (expected number of clusters) as in k-means
unsupervised learning
clustering
All points within the cluster are mutually density-connected
If a point is "density-reachable" from some point of the cluster, it is also part of the cluster
: neighborhood radius
minPts: minimum number of neighbors to be a core point
DBSCAN (density-based method)
unsupervised learning
DBSCAN (density-based method)
minPts = 2
core point
neighborhood radius
theses are not core points
unsupervised learning
DBSCAN (density-based method)
minPts = 2
not core points but reachable!
unsupervised learning
DBSCAN (density-based method)
minPts = 2
the rest is "noise"
unsupervised learning
DBSCAN (density-based method)
minPts = 2
different results with smaller epsilon ...
unsupervised learning
DBSCAN (density-based method)
minPts = 2
different results with greater epsilon ...
unsupervised learning
clustering
DBSCAN (density-based method)
+ Does not assume any predefined shape on data clusters
- data defined by set of coordinates (not capable of handling arbitrary feature spaces)
- computationally costly... (...)
- not robust to clusters of varying density
=> OPTICS (density-based method)
unsupervised learning
clustering
Performance Metrics ?
Calinski-Harabaz index
Davies-Bouldin Index
Rand index
Mutual Information based scores
Homogeneity, completeness and V-measure
Fowlkes-Mallows scores
Contingency Matrix
Pair Confusion Matrix
unsupervised learning
clustering
with aa the mean distance between a sample and all other points in the same cluster
with ab the mean distance between a sample and all other points in the next nearest cluster
Silhouette coefficient (between -1 and 1)
for each sample
the higher its value, the more similar the sample is within its cluster (and not to neighboring clusters).
If most samples have a low or negative value, then the clustering configuration is not appropriate.
unsupervised learning
clustering
Performance Metrics ?
Calinski-Harabaz index
The higher the Calinski-Harabaz index s(k)s(k) the more dense and well separated the s(k)k-th cluster is.
with $B_k$ the inter-cluster dispersion matrix
and $B_k$ the intra-cluster dispersion matrix
unsupervised learning
unsupervised learning
Dimension reduction
Clustering