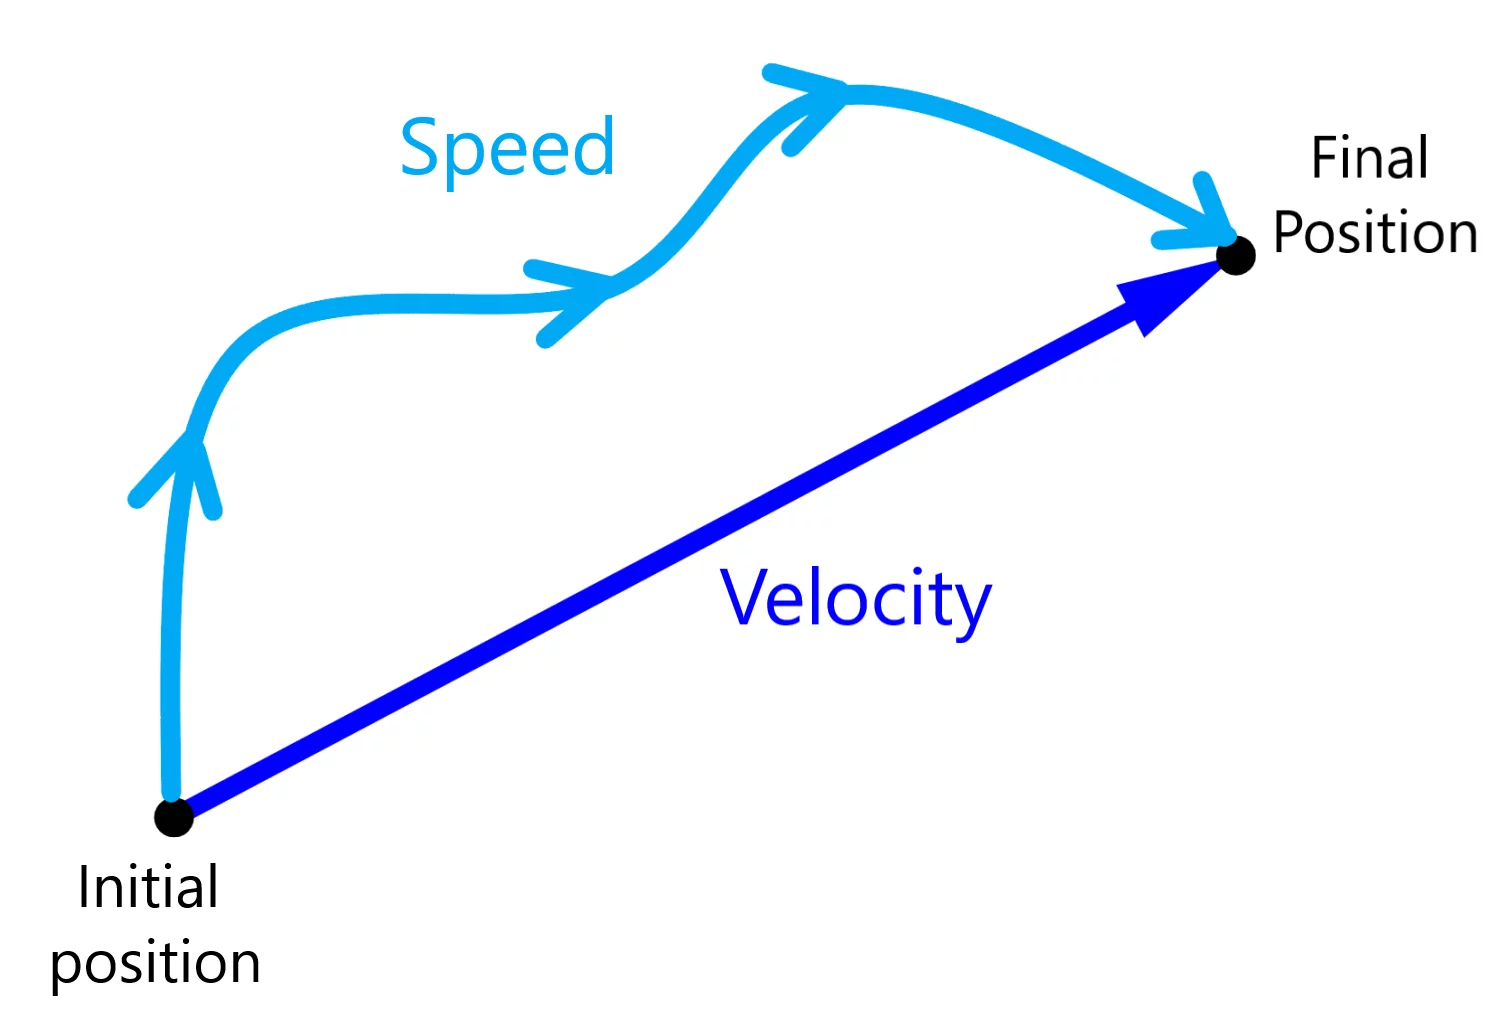
Velocity & Burndown Chart Patterns
Burndown charts are visual representations of work remaining over time in Agile project management. Recognizing different patterns in these charts helps teams identify potential risks, inefficiencies, or deviations from the planned progress.
Charles Darwin
Burndown charts
Default view
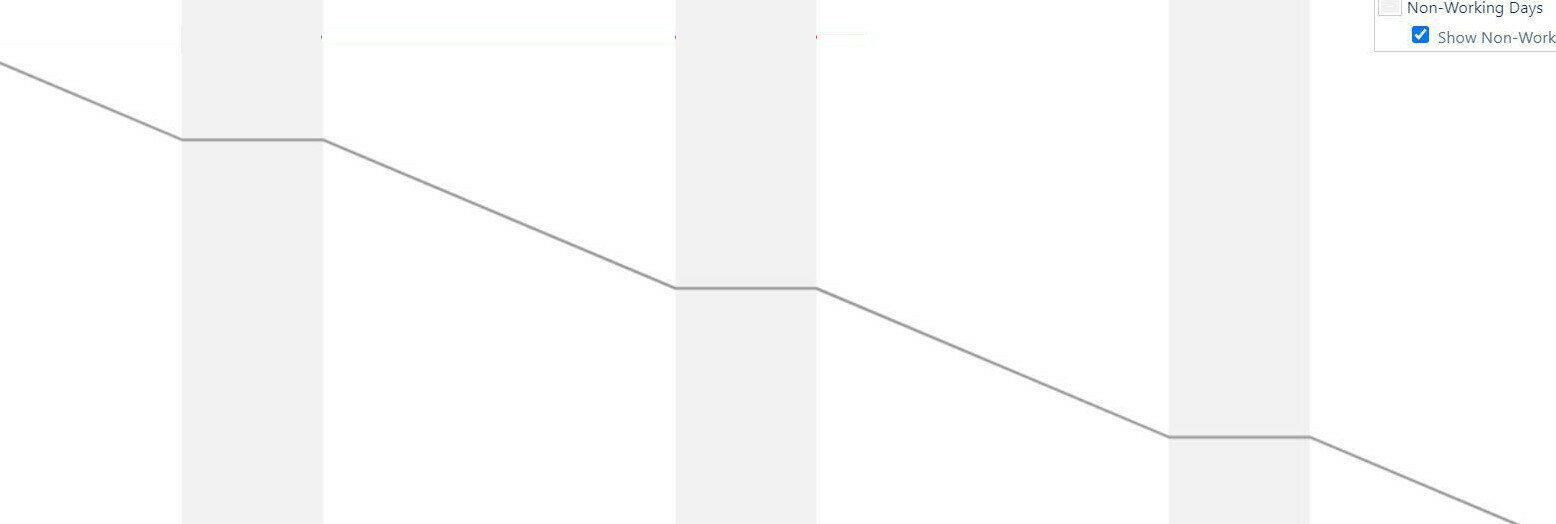
The gray colums account for the weekends
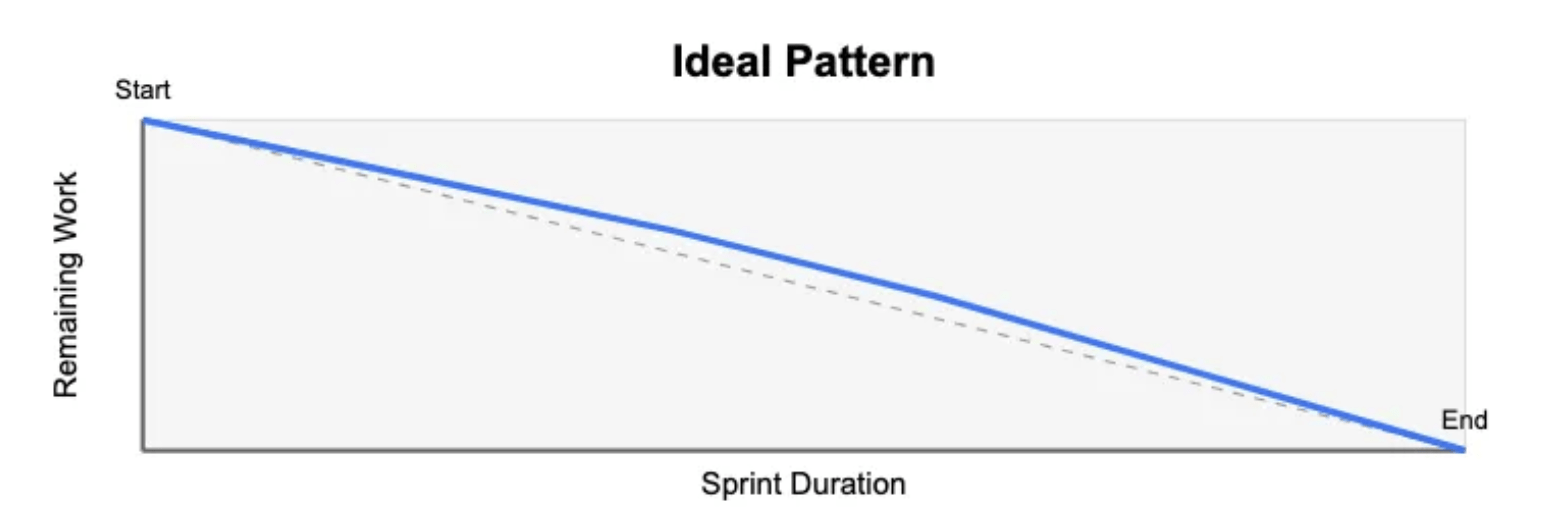
Ideal Pattern (Smooth Decline)
Text
- The team is making steady, consistent progress.
- Tasks were estimated accurately.
- Work is being completed at a predictable pace.
- No significant blockers or scope changes occurred
- It never happends
Late Start Pattern
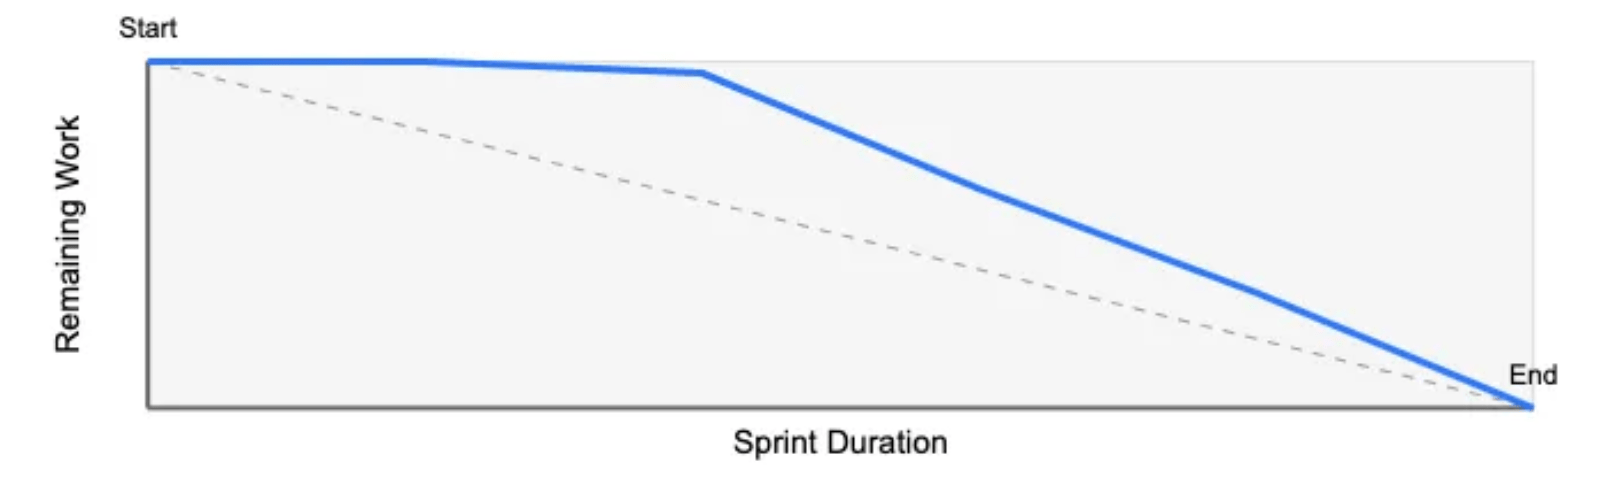
What is means
- Team delayed starting work on sprint tasks
- Initial tasks may have been blocked
- Team might be procrastinating or has planning issues
- Could indicate "student syndrome" - waiting until deadlines approach
Ways to overcome it
- Break tasks into smaller ones - mini-deadlines
- Set personal deadlines
- Identify blockers
- Start with easy tasks to build momentum
- Hold yourself accountable
Scope Creep Pattern
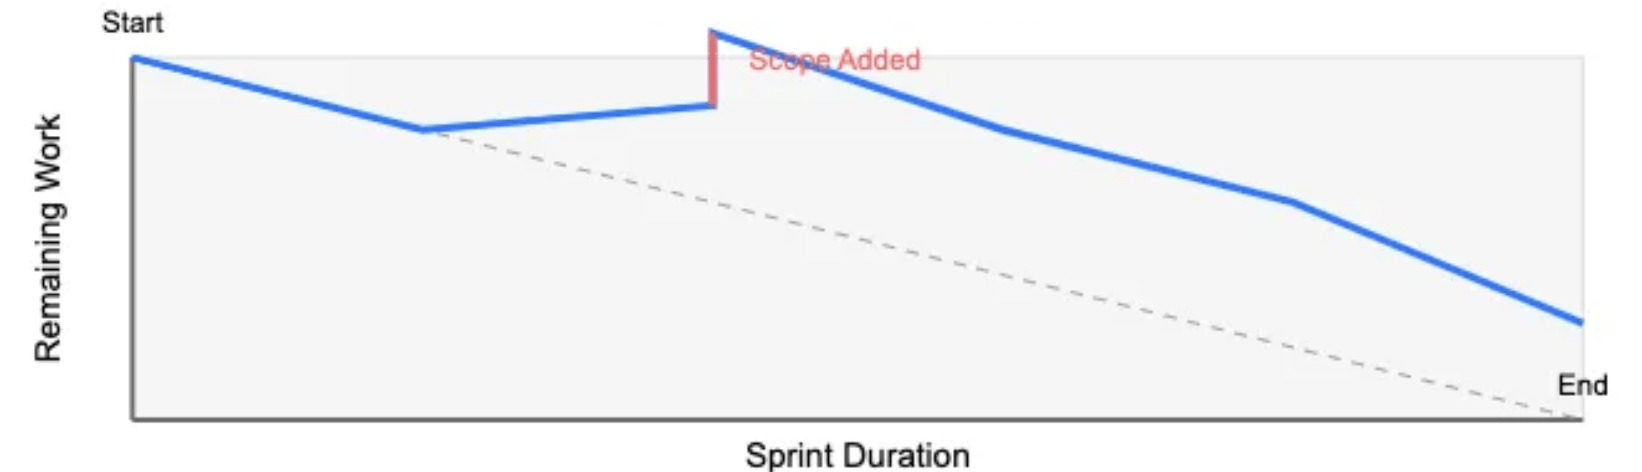
What is means
- New requirements or stories were added mid-sprint
- Stories were underestimated in complexity
- Poor sprint planning or changing priorities
- May result in incomplete sprint with stories carrying over
Ways to overcome it
- Better grooming
- Better sprint planing
- Better backlog prioritization
Early Completion Pattern
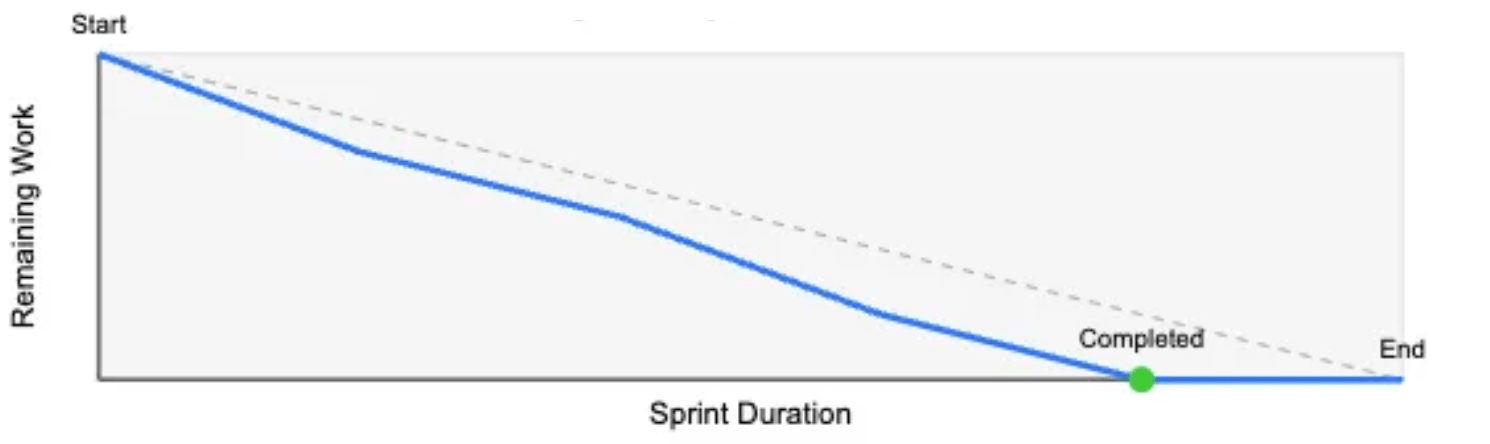
What is means
- Team overestimated the work required
- Team was more productive than expected
- Some planned stories were simplified or removed
- Team might not be challenging themselves enough
Ways to overcome it
- Plan more effectively by refining estimations and adding valuable tasks
Struggling Team Pattern
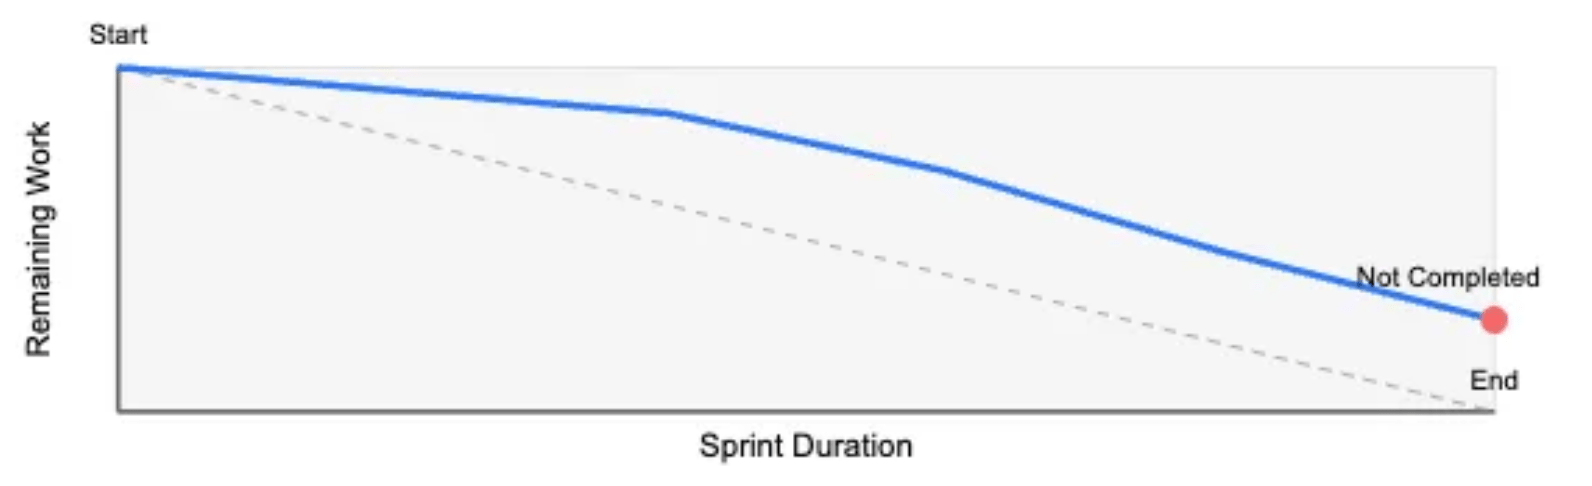
What is means
- Team underestimated complexity or effort
- Technical challenges or blockers emerged
- Team may be understaffed or facing skill gaps
- Sprint planning may have been overly optimistic
Start - Stop Pattern
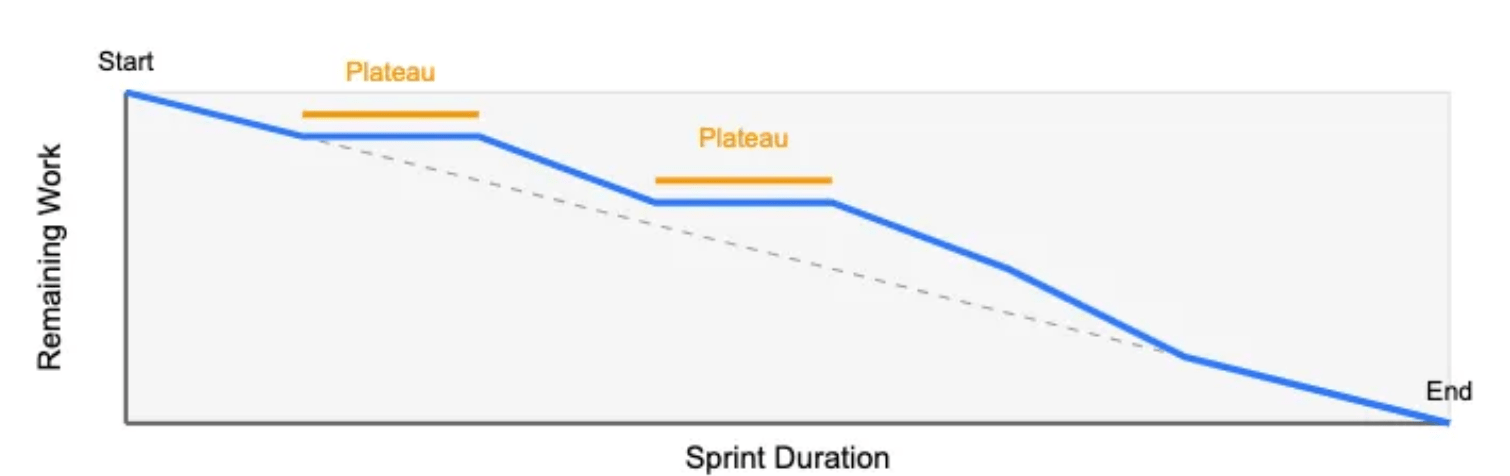
What is means
- Team is context-switching between projects
- Temporary blockers are halting progress
- Team may be waiting for external dependencies
- Bottlenecks in the workflow or uneven distribution of work
Velocity Chart
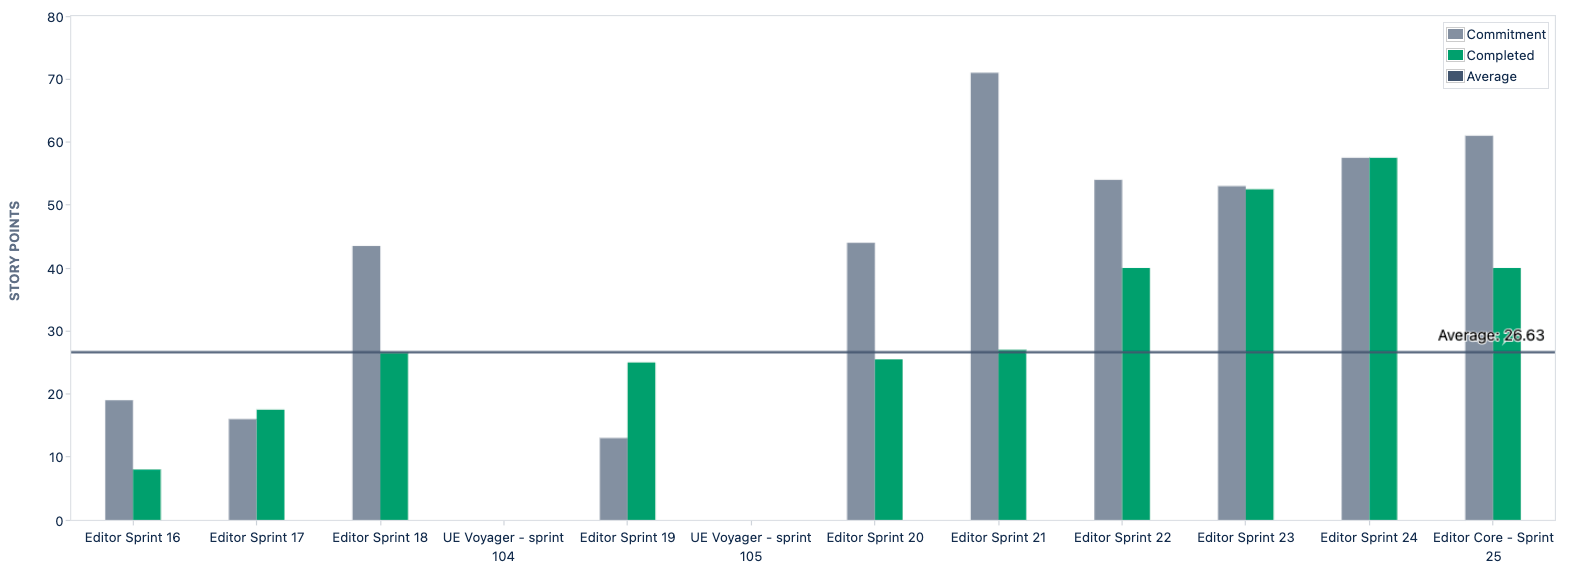
The What
A team's average sum of story points (or any other work units) completed per sprint
The what for
- Helps estimate the amount of work a team can complete in a sprint
- Makes sprint planning realistic, creates predictability
- Less “gut feeling” - putting data into the process Shows team performance trends over time
Common Pitfalls
- Velocity !== Capacity (calendar days)
- Comparing velocity across teams
- Expecting velocity to increase constantly—it stabilizes over time
- Using velocity as a performance metric for individuals