Web Mapping and Geovisualisation (ENVS456)
Introduction
Gabriele Filomena &
Elisabetta Pietrostefani
- Module Overview
- What is a Web Map?
- Building Blocks of a Web-Map
- Logistics
Agenda
Module Overview
-
W1: What's Web Mapping? -
W2: Map Design & Statistical Visualisation -
W3: Data Architectures -
w4: Web Architectures & API -
W5: Interactive Maps -
W6: Assignment I -
W7: Retrieving Data From OpenStreetMap -
W8: Dashboards -
W9: Animations? -
W10: Assignment II (due w11)
Content
To master:
- The design and generation of web-based mapping and geographical information tools.
- The use of software to access, analyse and visualize web-based geographical information.
Module's aim
- Two pieces of coursework (50%, 50%)
- Equivalent to 2,500 words each (= 1000 words + code)
- Due on W-6 and W-11
- Description on module webpage + lab clinics
- Submission in .HTML
Assignments
Web Maps
From Static Maps..
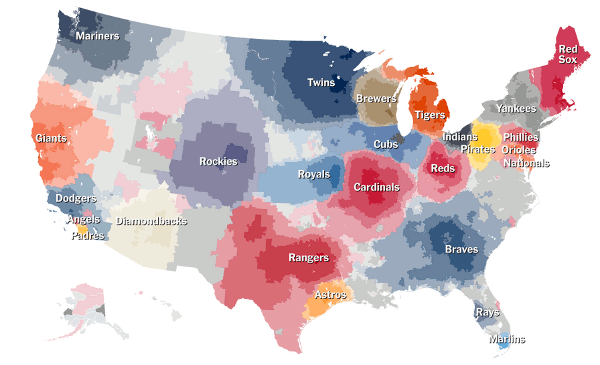
https://www.nytimes.com/interactive/2014/04/23/upshot/24-upshot-baseball.html
To.. Interactive Maps
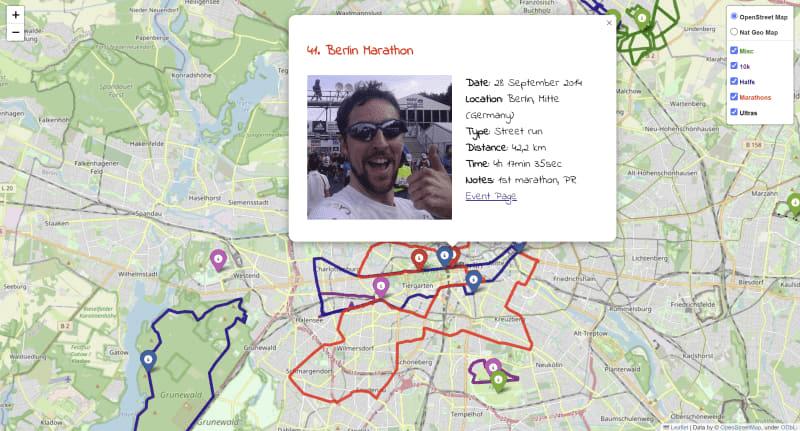
https://dev.to/alexdjulin/my-runing-map-using-python-and-folium-2h2m
Animated (Web) Maps
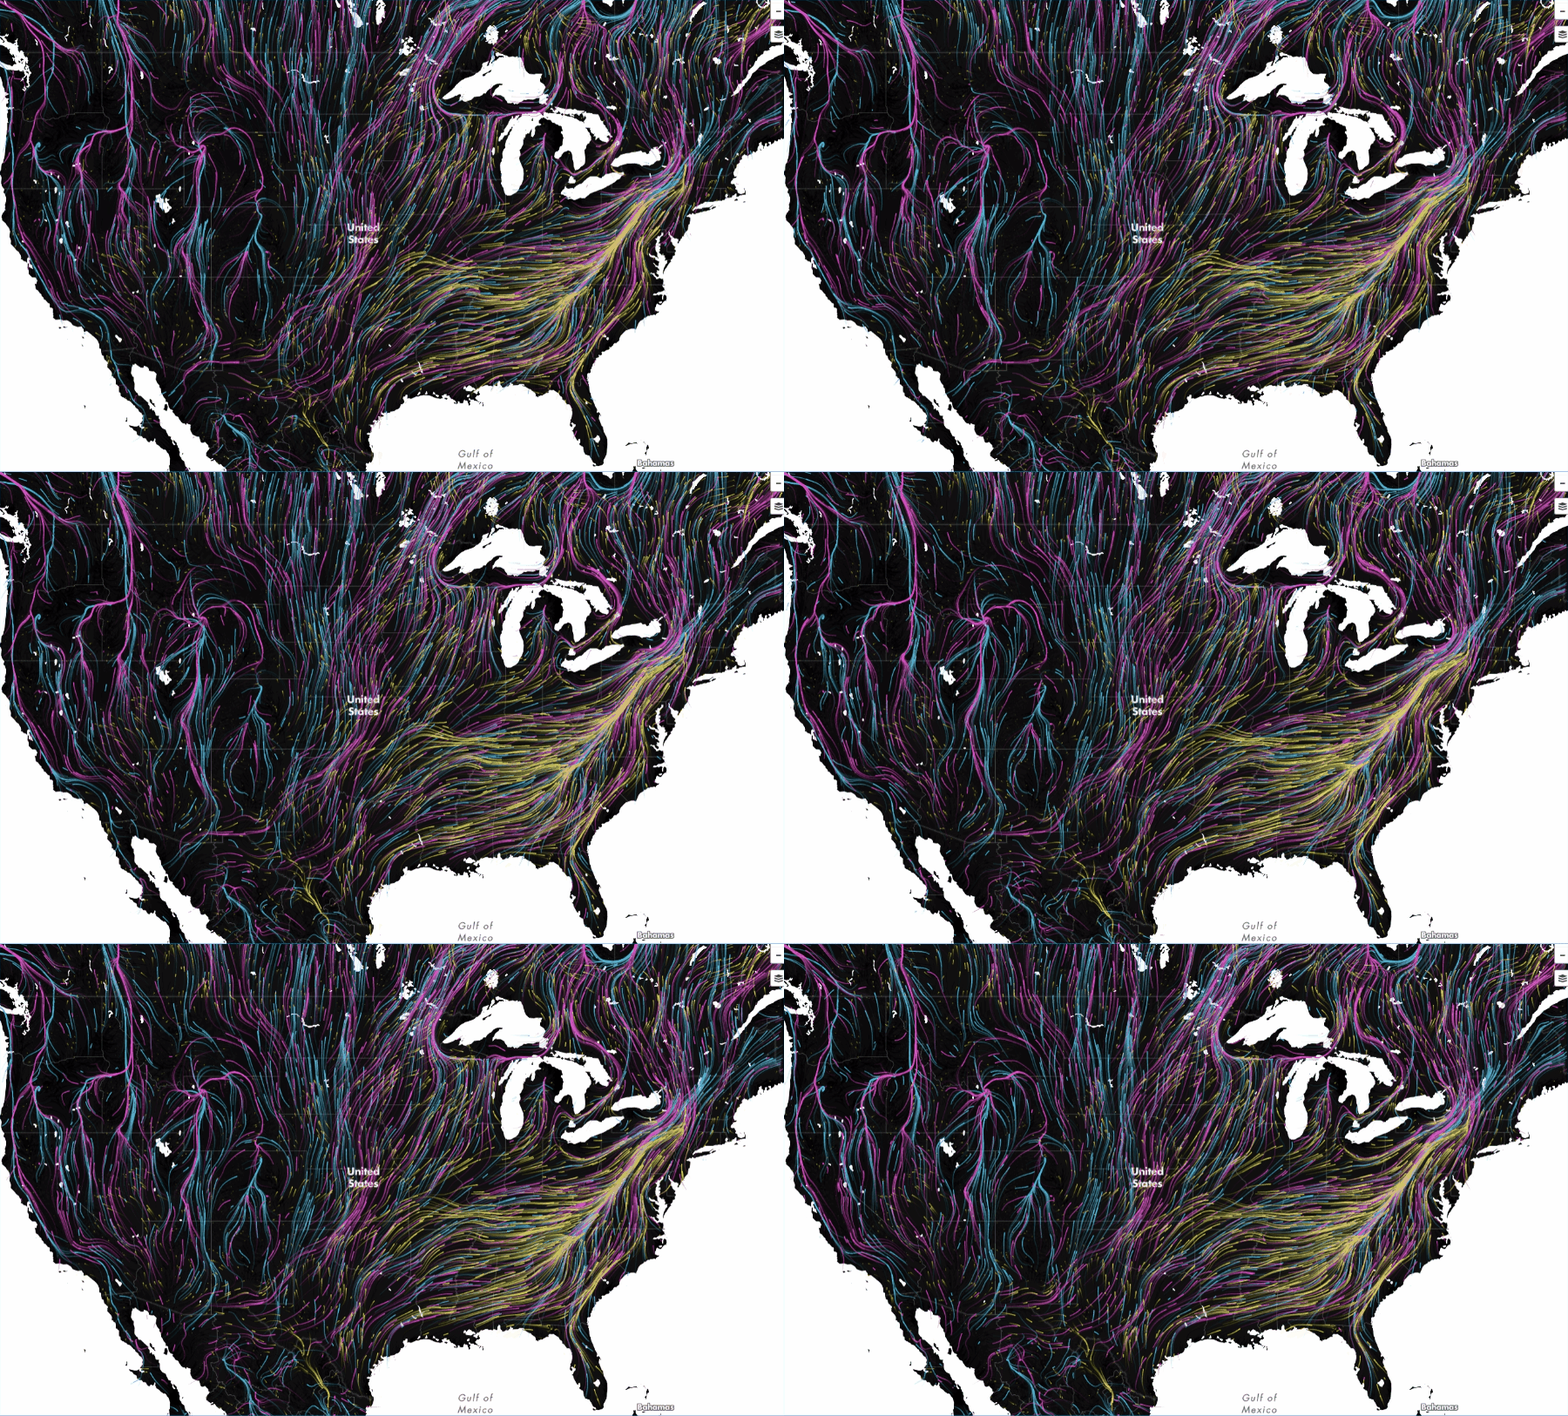
https://www.maps.tnc.org/migrations-in-motion
Animated (Web) Maps
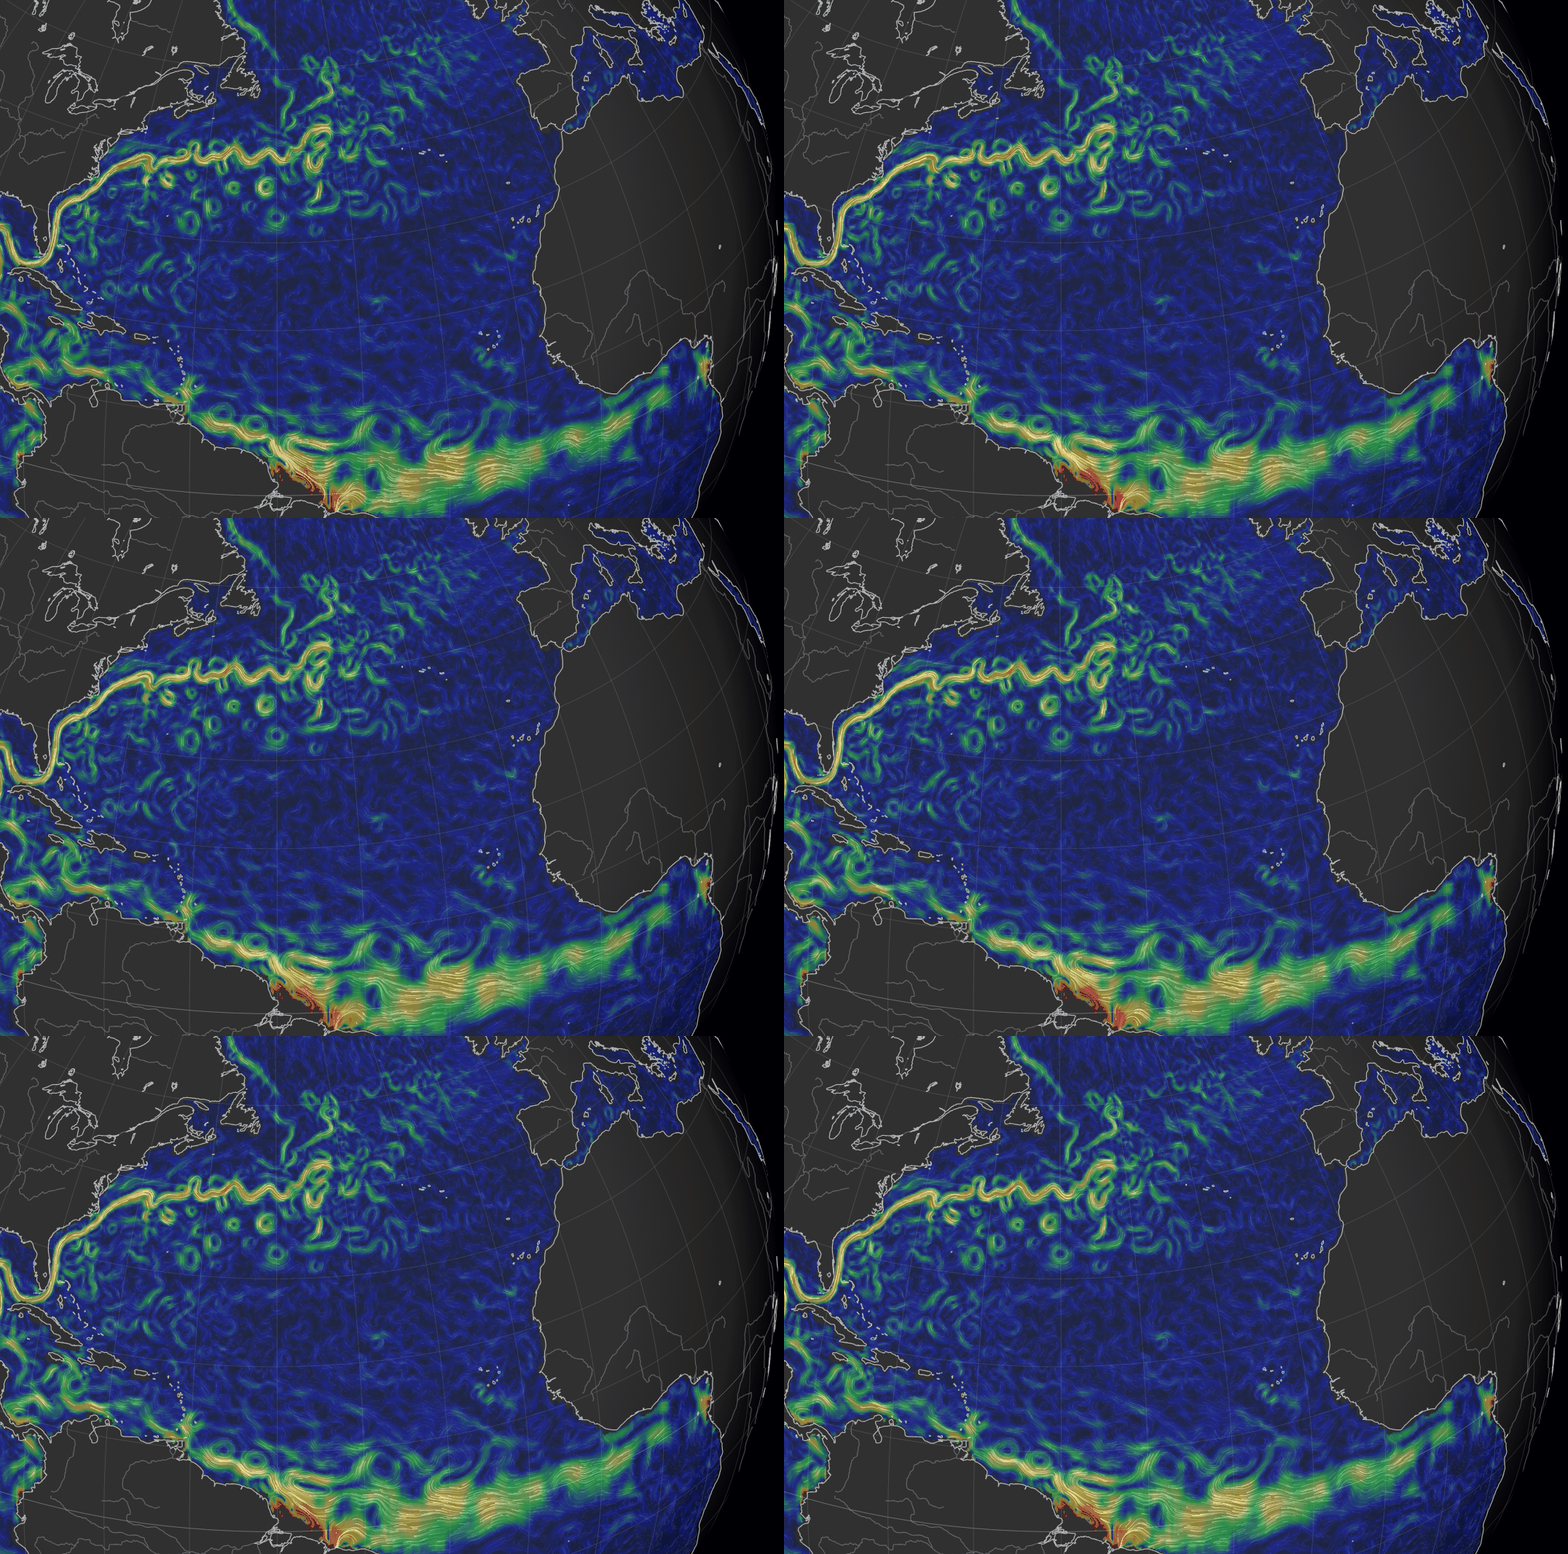
https://earth.nullschool.net/
Web Maps
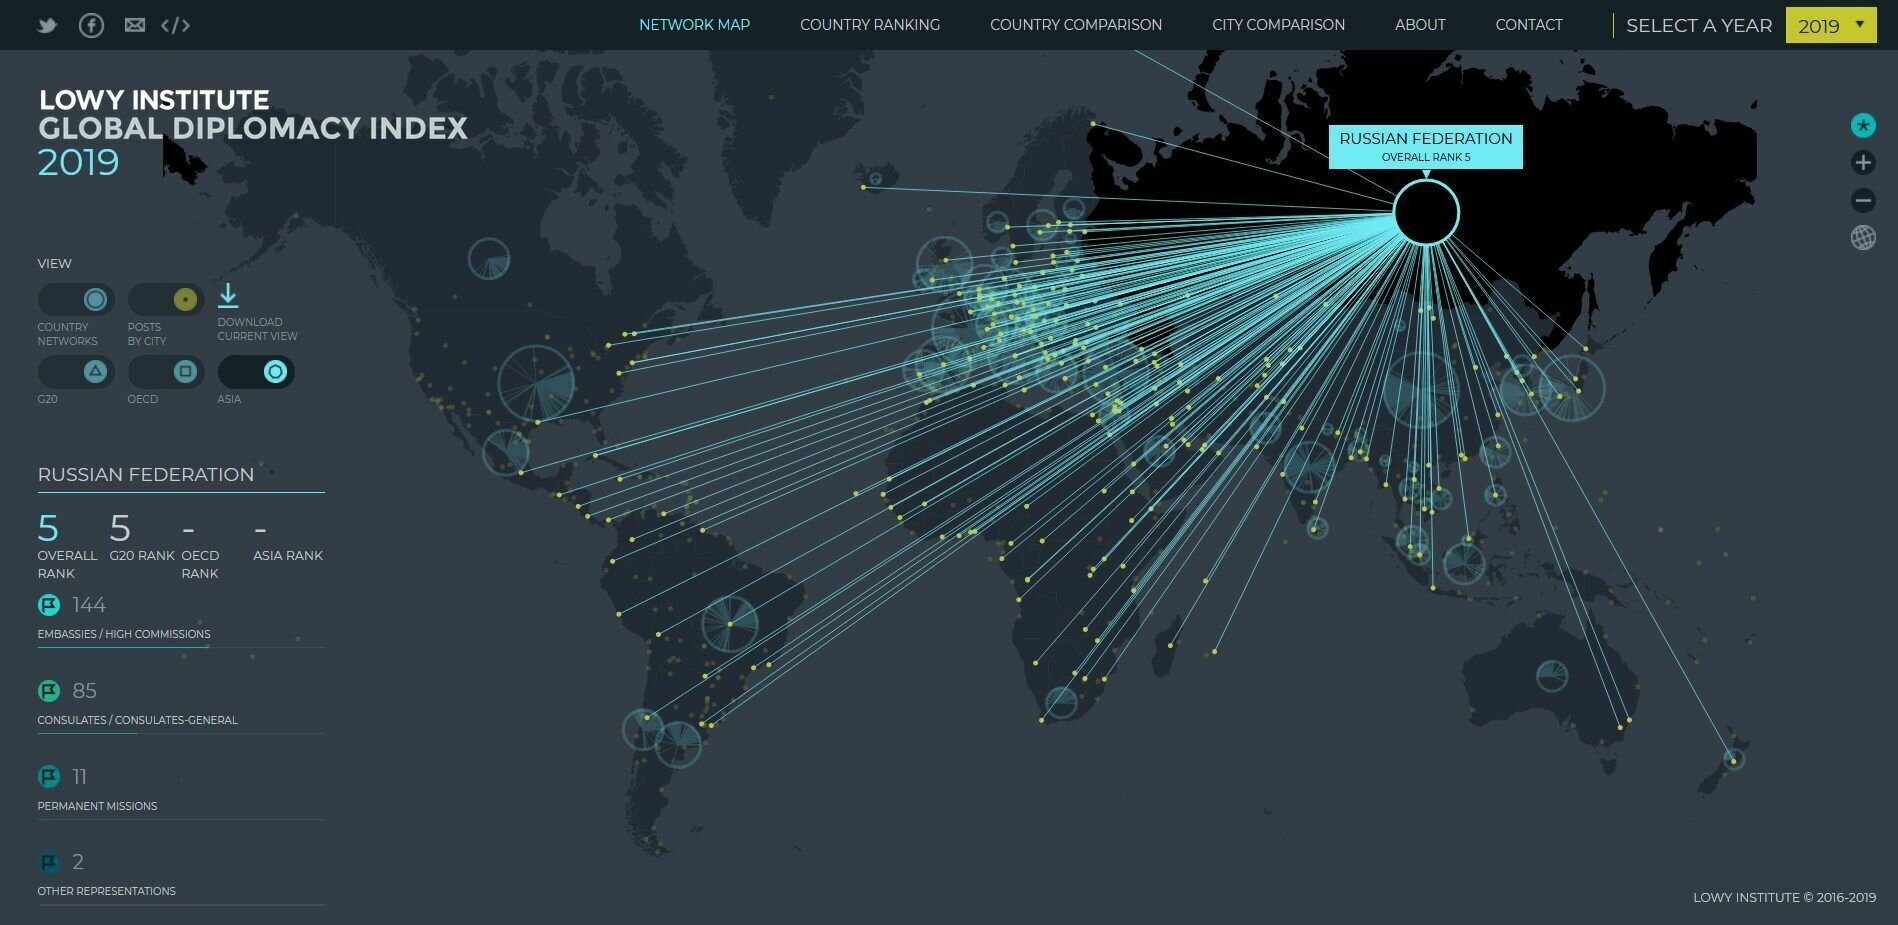
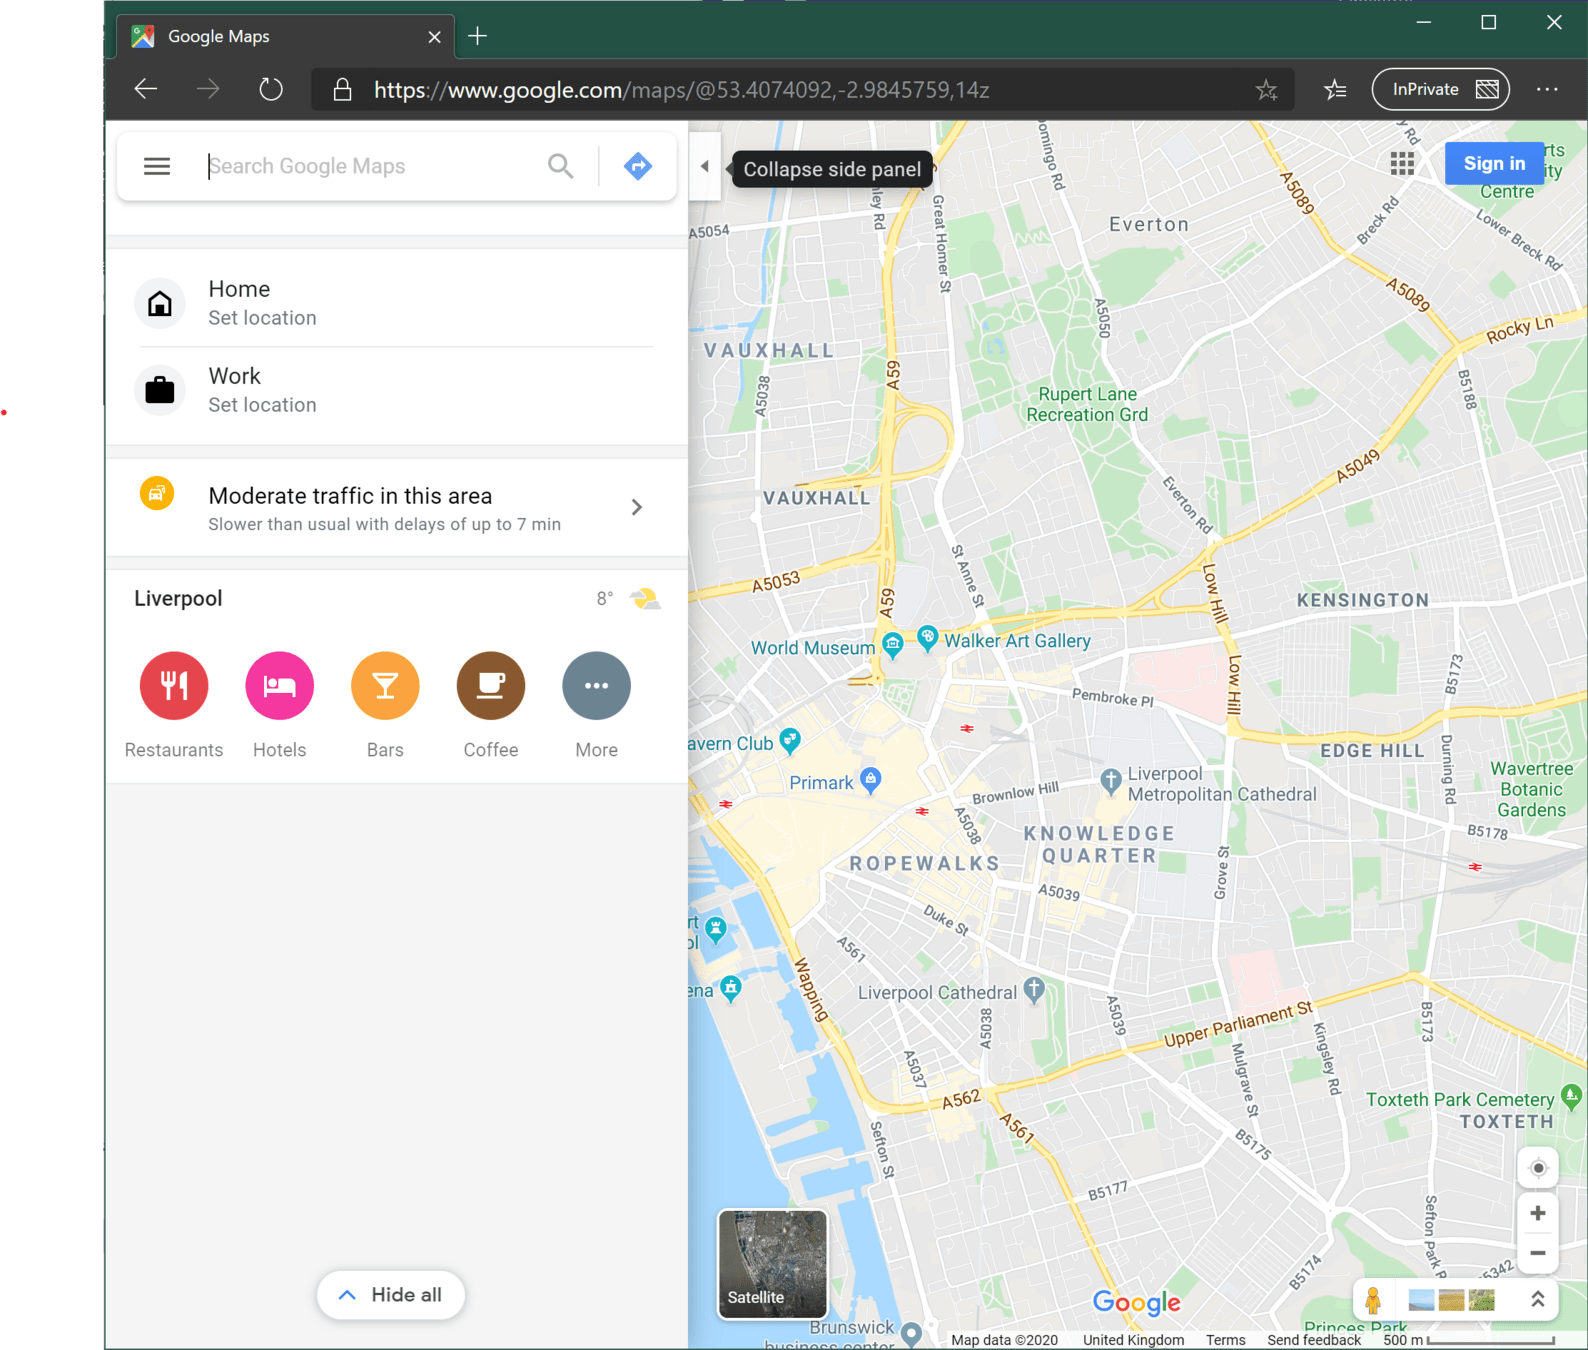
The process of designing, implementing, generating, and delivering maps on the World Wide Web (Neumann 2008).
https://globaldiplomacyindex.lowyinstitute.org
Why Web Maps?
- Wayfinding
- What is nearby?
- What is happening?
- Where is something happening?
- Collaboration
- Why are things where they are?
Building Blocks of a Web Map
Data graphics visually display measured quantities by means of the combined use of points, lines, a coordinate system, numbers, symbols, words, shading, and color
The Visual Display of Quantitative Information. Edward R. Tufte
Geodata

Hardware

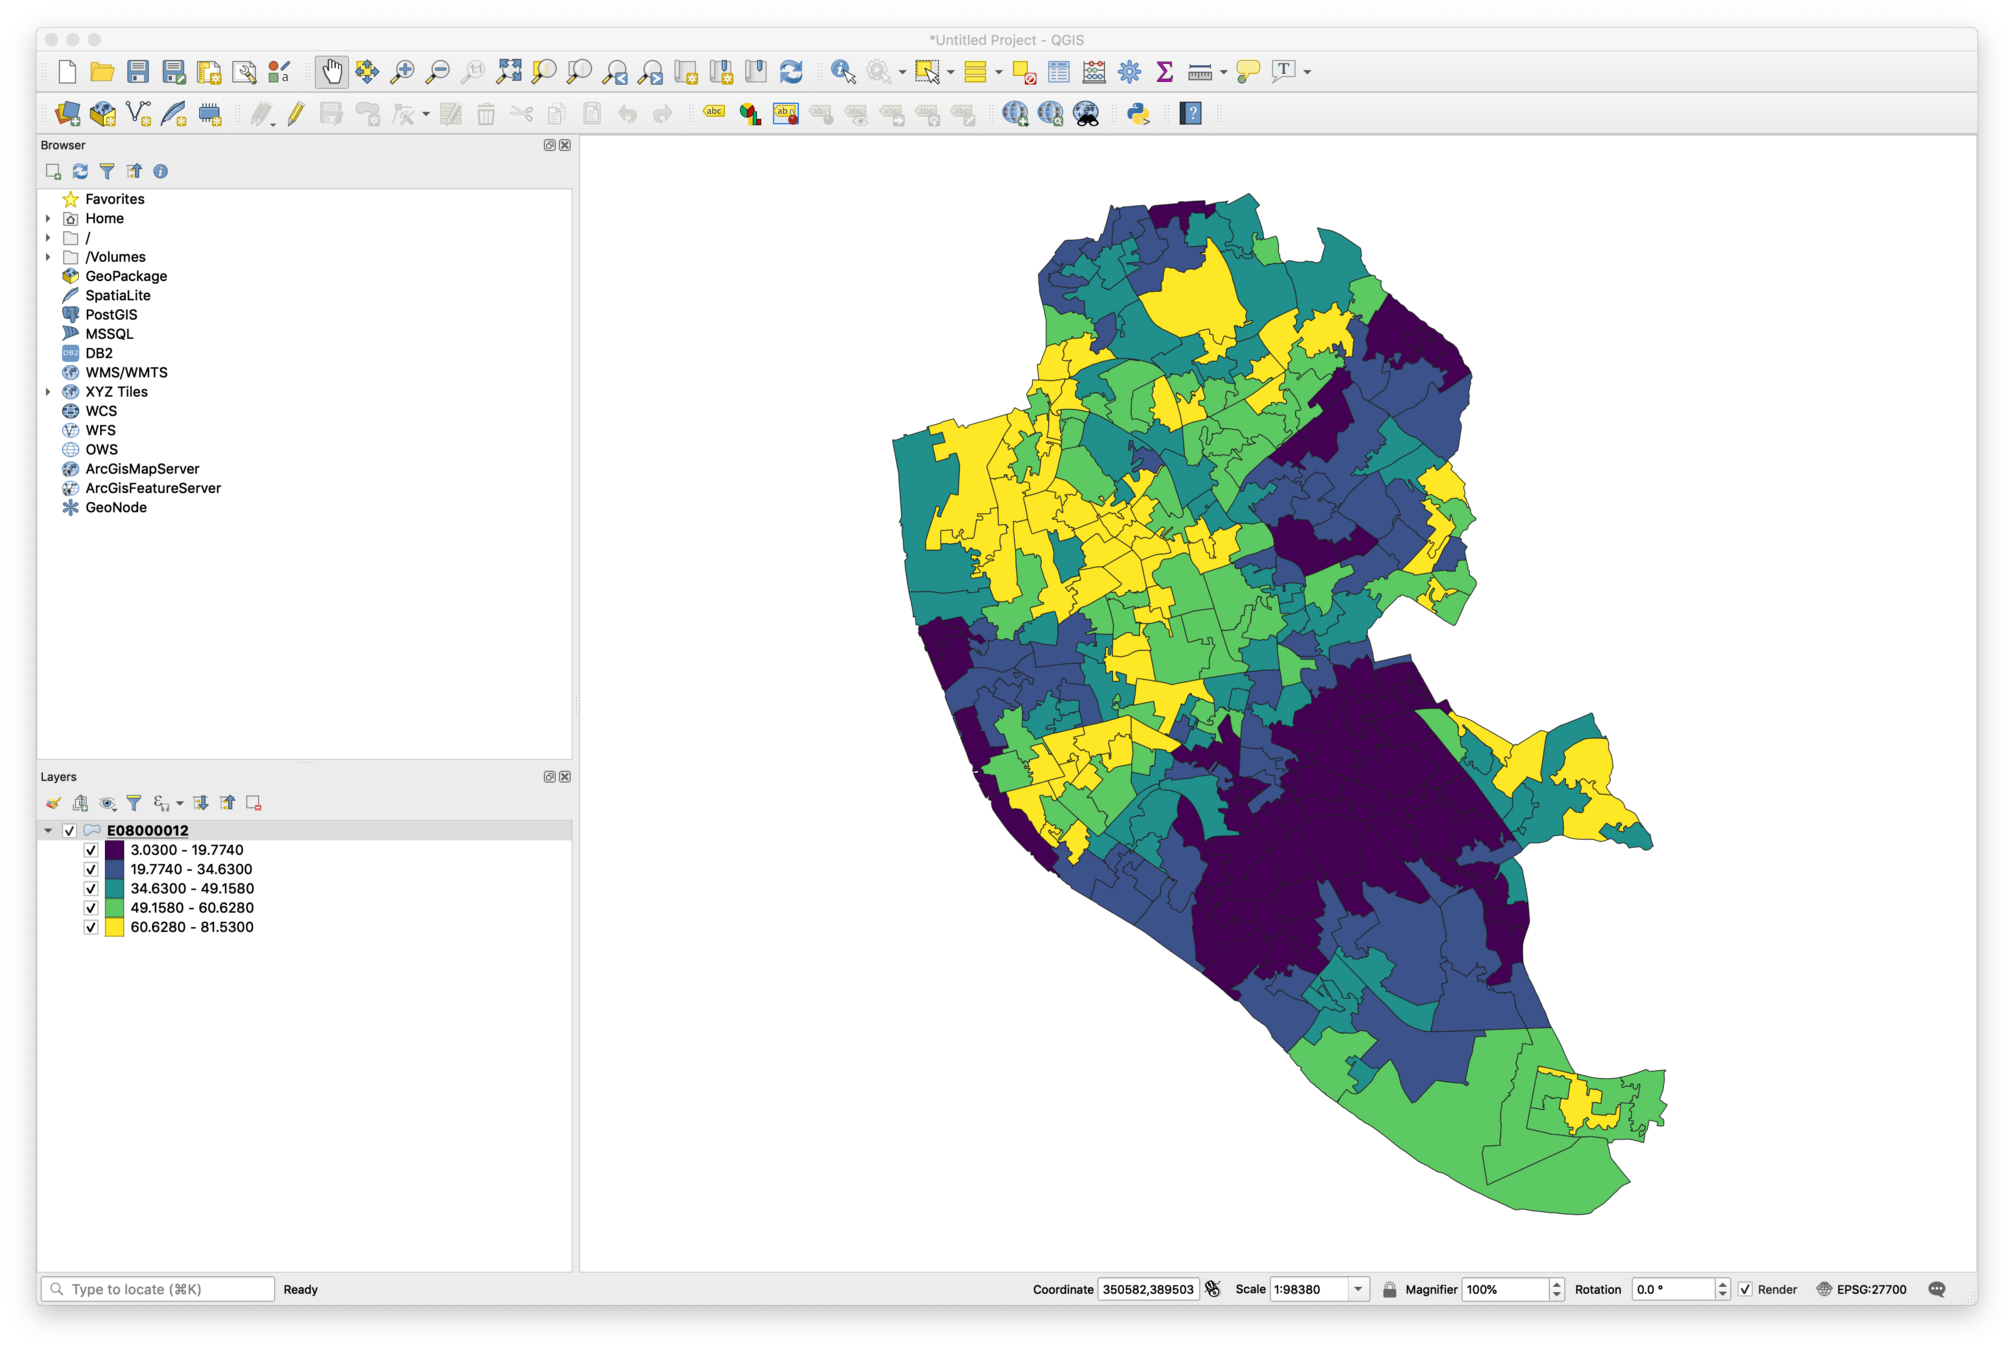
Software

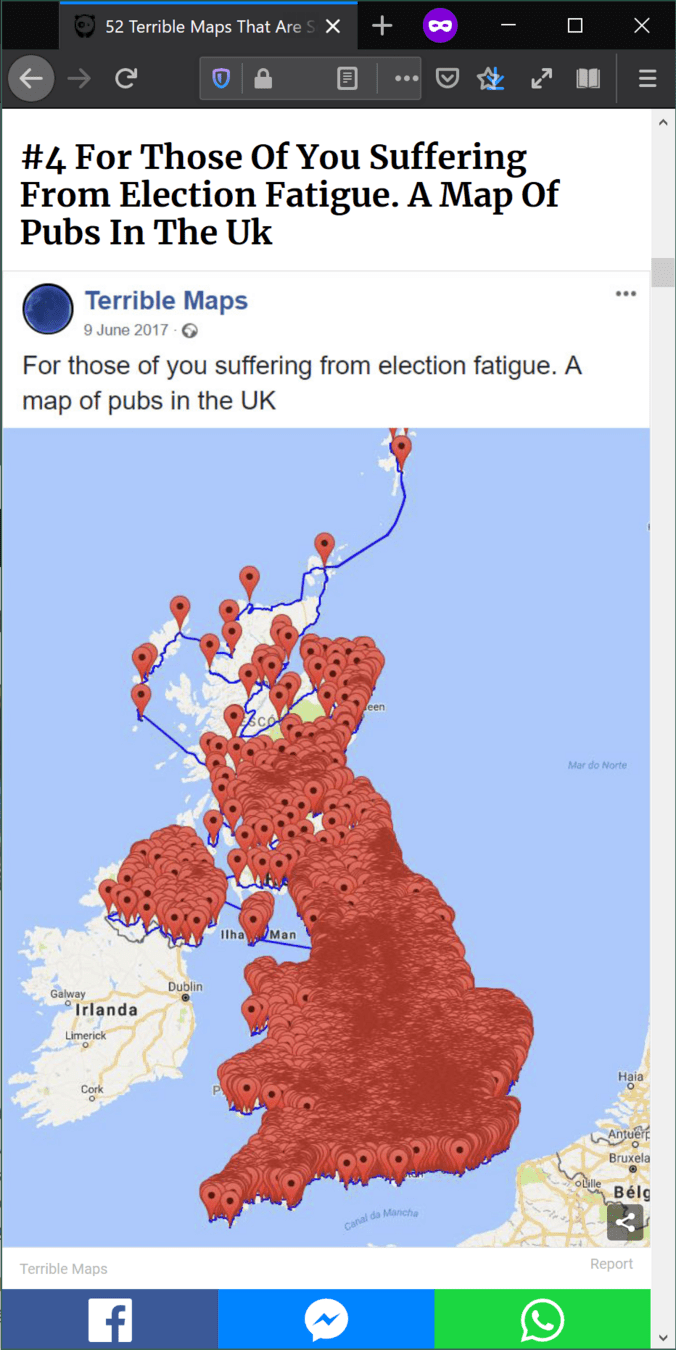
Design
Logistics
Website

https://gdsl-ul.github.io/wma/
Lectures: Wednesday 10 -11 am
- Underlying concepts + Context
Labs: 11 am - 1 pm
- Hands on
- Interactive
Where? Rendall PC Teaching Centre
Lecture & Labs
Ms Teams

-
Concepts: Lectures (website + slides)
-
Hands-on: Concepts in (interactive) action
-
Do-It-Yourself: practical material to do on your own
Course Principles
-
This course is like a gym subscription
-
Principles over technology
-
Collaborate, do not copy --> PLAGIARISM
Practicals are essential but you are expected to conduct independent work to expand on the labs