Interactively Exploring Financial Trades in R
Ryan Hafen
Hafen Consulting, LLC and Purdue University
Michael Kane
Yale University
R/Finance Conference
May 20, 2016
bit.ly/rfinance2016
Origin of This Work:
- Part of the White House Big Data Initiative, funding research and development of open source tools for analysis and visualization of big data
- Goal: "Support open source software toolkits to enable flexibility in government applications"
DARPA XDATA Program

XDATA Summer Camps
- All grant performers convene for ~2 months and work on challenge problems
- Several data sets and challenge problems each year
- Last summer one of the data sets was a sample of data from the Nanex NxCore database
bit.ly/rfinance2016
NxCore Data
- 6 months of data, 25 ms resolution
- Datasets:
- trades: trade messages for last sale reports and corrections - a typical trading day will have 10+ million of these message types
- exchange quotes: sent for every exchange quote and BBO - a typical trading day will have 700+ million option quotes
- market maker quotes: sent for every Market Maker Quote ("level 2") from either Nasdaq SuperMontage, Intermarket quotes on Nasdaq issues, or Nasdaq Intermarket quotes on listed securities - a typical trading day will have 40+ million of these messages
bit.ly/rfinance2016
Trade Data
- ~1.25 billion records, 47 variables
- ~ tera scale (depending on compression, etc.)
- Data for equities, futures, future options, bonds, index, spreads, eq/idx opt root
- 13,780,219,669 total trades
- 33 exchanges
- ~24k equity symbols
bit.ly/rfinance2016
XDATA Challenge Problems
- Identify flash crashes in the data
- Identify and characterize instances of trading halts
- Identify suspected pump and dump schemes
- Identify anomalies associated with quote stuffing
But it's challenging enough to understand the data!
It's dangerous to just go out and start applying algorithms to the data when we don't understand all the variables and how they should be handled, etc.
bit.ly/rfinance2016
NxCore Exploratory Analysis
- A careful analysis was conducted of every variable in the trade data
- Ideally we would have NxCore / finance experts to iterate with
- We had to make our own best judgements based on exploratory analysis
- New general-purpose interactive plotting library: rbokeh (hafen.github.io/rbokeh)

NxCore R Package
- Resolve flags to meaningful messages
- Handle out of order trades / cancellations / insertions
- Methods to "roll up" trade data to construct an order book at different time resolutions
- Symbol / name lookups
- Algorithms: cointegration, windowed realized volatility, outlier detection / mini flash crash detection

Large-Scale Historical Analysis
- Summaries are a great start, but we need to explore the data in detail
- R is great for detailed EDA of small data
- To analyze data of this scale with R, we used our open source R / Big Data platform, Tessera
bit.ly/rfinance2016
Tessera
- Stay in R regardless of size of data
- Be able to use all methods available in R regardless of size of data
- Good for rapid iteration / ad hoc exploration / prototyping
- Off-line historical analysis where being fastest in computation is not as important
- Want to minimize both computation time (through scaling) and analyst time (through a simple interface in R) - with emphasis on analyst time
- Flexible data structures
- Scalable without while keeping the same simple interface!
Guiding Principles:
bit.ly/rfinance2016
What's Different About Tessera?
- Restrictive in data structures (only data frames / tabluar)
- Restrictive in methods (only SQL-like operations or a handful of scalable non-native algorithms)
- Or both!
Many other "big data" systems that support R are either:
Idea of Tessera:
- Let's use R for the flexibility it was designed for, regardless of the size of the data
- Use any R data structure and run any R code at scale
- Forget "deep learning", we're doing "deep analysis"!
bit.ly/rfinance2016
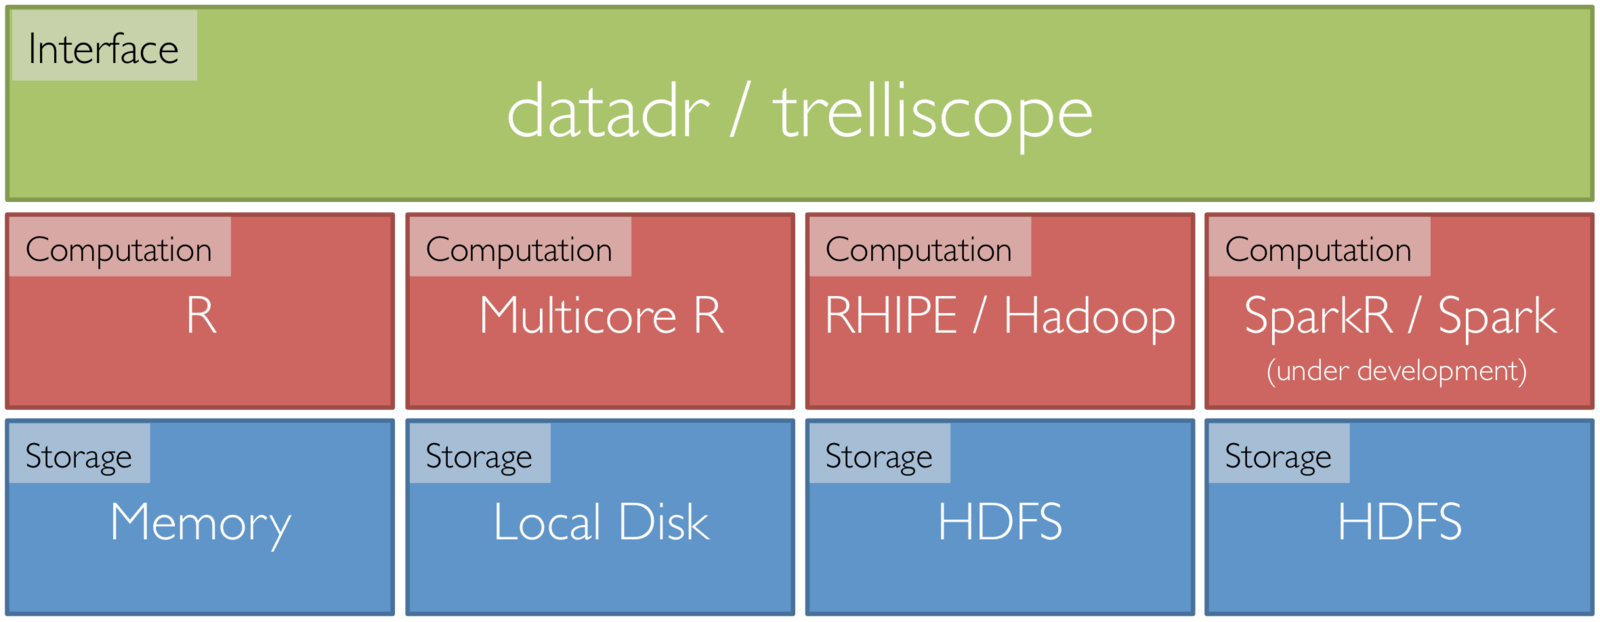
Tessera Environment
- Front end: two R packages, datadr & trelliscope
- Back ends: R, Hadoop, Spark, etc.
- R <-> backend bridges: RHIPE, SparkR, etc.
NxCore Data with Tessera
-
Specification of data partitioning and data structures and ad hoc analysis
-
Data structures
-
Raw equity data partitioned by symbol and date
-
Raw equity and option data grouped by symbol and date
-
-
Ad hoc application of R code
-
Higher resolution summaries
-
Outlier / anomaly detection
-
Cointegration calculations
-
datadr / RHIPE
bit.ly/rfinance2016
NxCore Data with Tessera
-
Interactively investigate data in detail with several different displays
-
Example:
-
Plot price vs. time for data partitioned by symbol/day
-
There are ~1 million subsets based on this partitioning
-
Compute cognostics - metrics that allow us to navigate this large space of displays in a meaningful way
-
Trelliscope
bit.ly/rfinance2016
More Interesting Targeted Analysis
-
Assess market-wide systemic risk with cointegration
-
Investigate option prices leading equity prices as indicator of insider trading
-
Examine spikes in implied volatility and volume in options to look for fiscal malfeasance

AAPL price (top) and cointegration measure (bottom) S&P 500 on the 05/06/2010 flash crash
We are now in good shape to begin more interesting analyses
bit.ly/rfinance2016
Thank You
Reference:
-
Tessera: http://tessera.io
-
rbokeh: http://hafen.github.io/rbokeh
-
More: http://ryanhafen.com
@hafenstats
bit.ly/rfinance2016