Interactive Visualization for
Interpretable Machine Learning
ELLIIT Focus Period seminar


Dennis Collaris, Jarke J. van Wijk
Eindhoven University of Technology


75% risk!
Black box
model

Domain expert
But why?

Data
Machine learning
75% risk!
Black box
model
Domain expert
Explanation

Aha!
But why?
Data
Explainer
Machine learning
Local
Global
Machine learning explanations
- Which features played a role in the decision?
- Why did the model make this classification?
- What can I do to affect the prediction?
- What features does the
model use in general?
- Does the model treat
everyone fairly?
- Does the model do what
it is intended to do?
Black box
model
Data
Black box
model
Data
Data
Single
prediction
Entire
model
Local
Global

Black box
model
Data
Black box
model
Data
Data
Single
prediction
Entire
model
Machine learning explanations
- Which features played a role in the decision?
- Why did the model make this classification?
- What can I do to affect the prediction?
- What features does the
model use in general?
- Does the model treat
everyone fairly?
- Does it discriminate
against groups?
ExplainExplore
Interactive visual explanation
Local
Global
Contribution-Value Plots

Local
Global
ExplainExplore
Interactive visual explanation
StrategyAtlas
Local
Global
ExplainExplore
CV Plots
Interactive visual explanation
Local
Global
ExplainExplore
CV Plots
StrategyAtlas
Interactive visual explanation
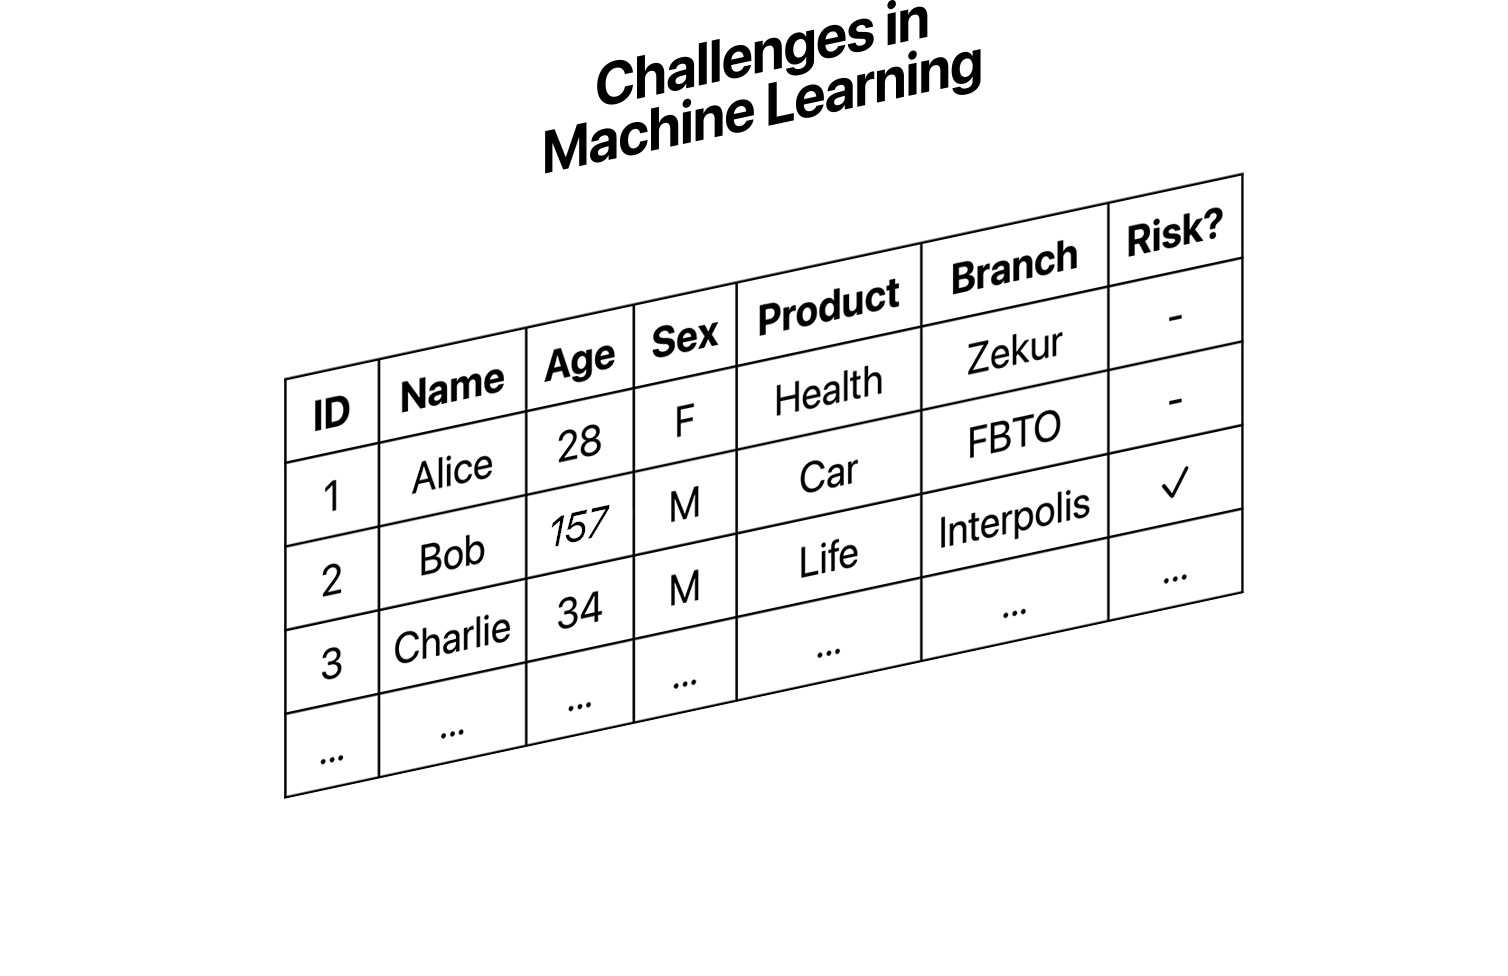
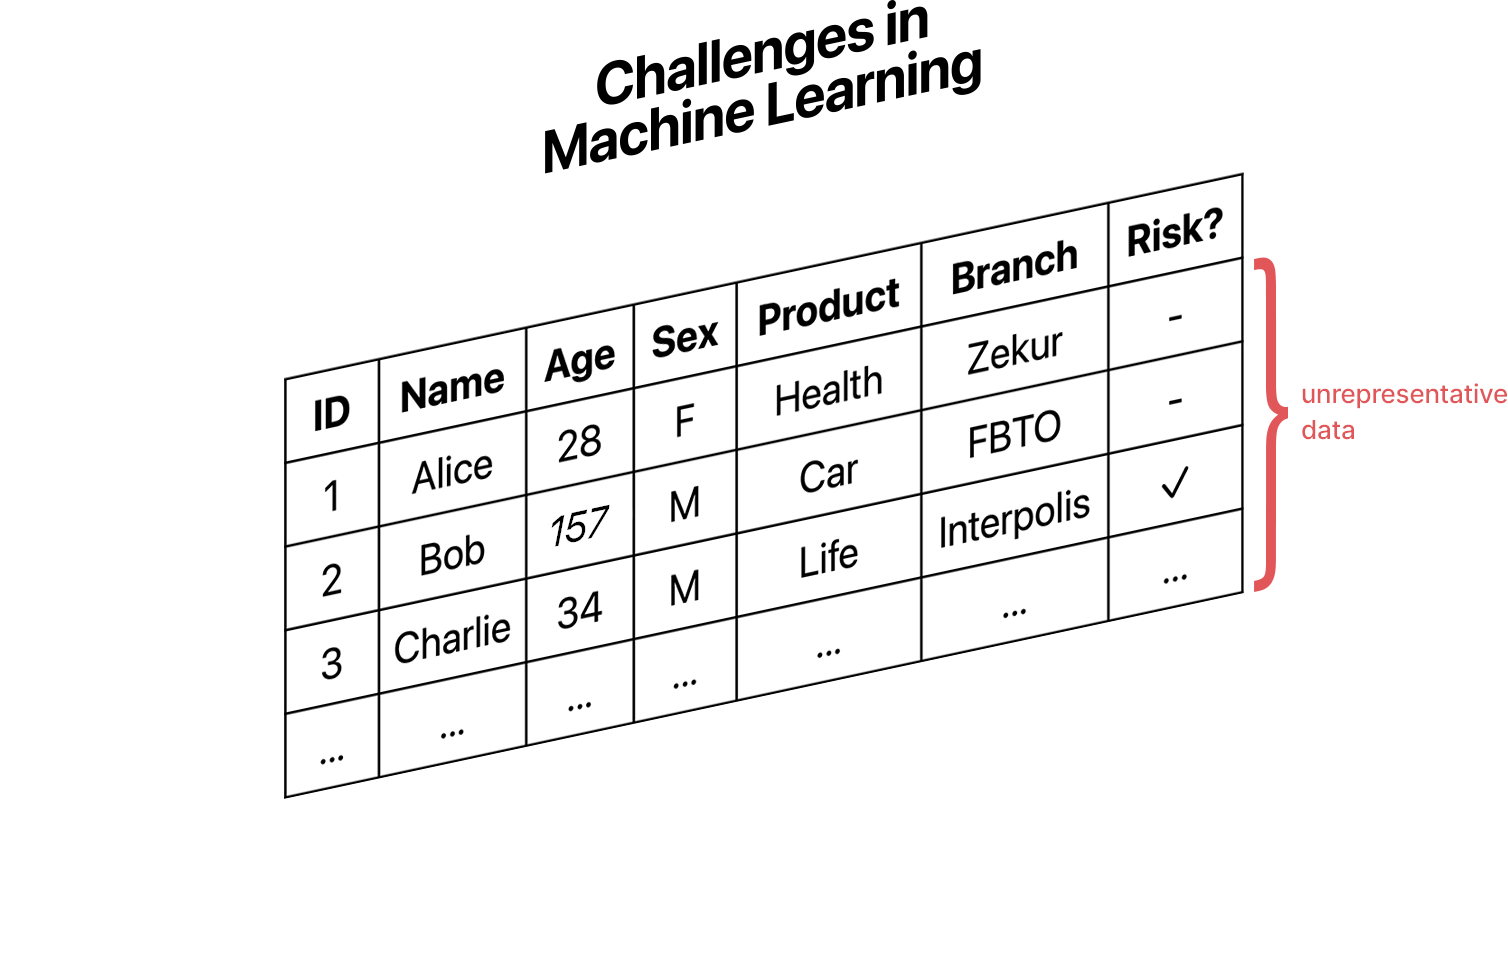
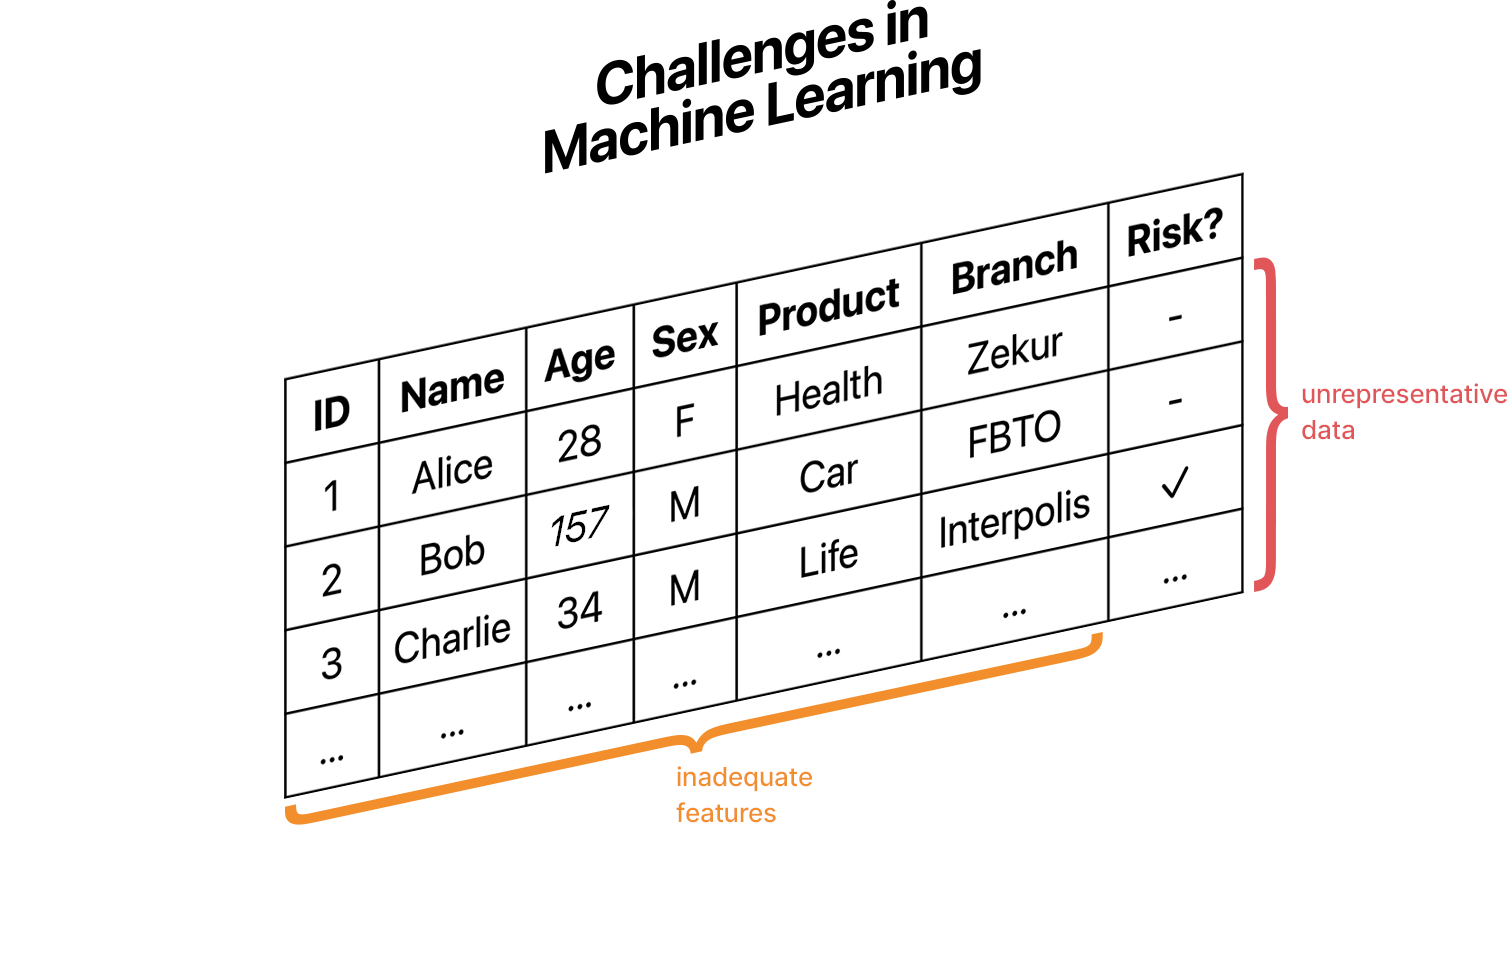
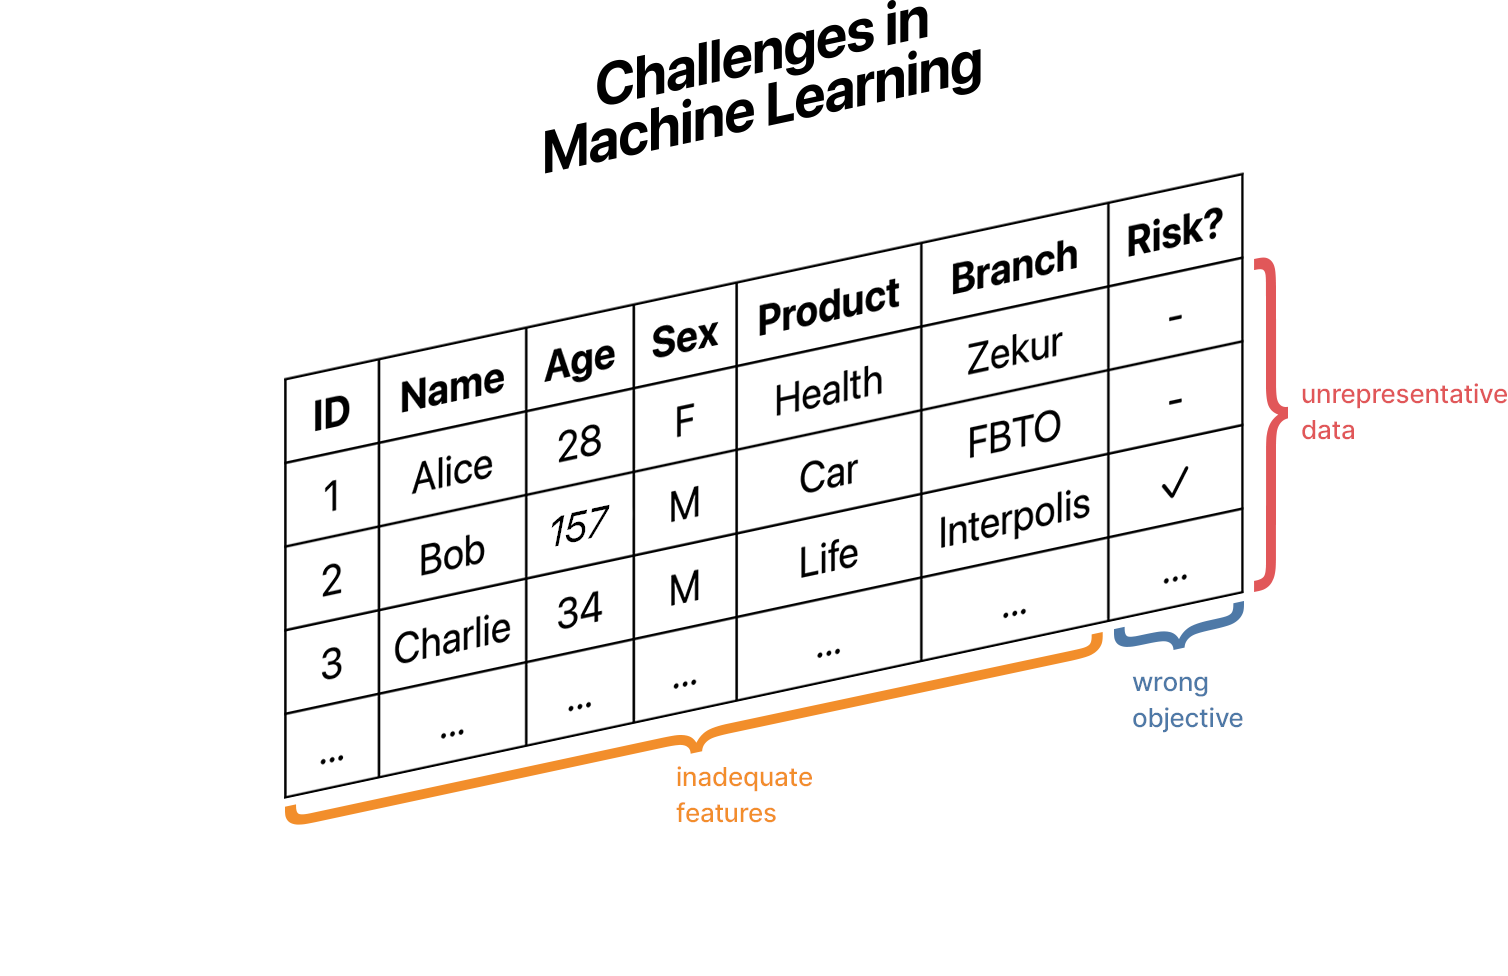
Fraud detection explanations
for sick-leave insurances
FRAUD DETECTION EXPLANATIONS
Data
- Missing/incorrect values
Model
- 100 Random Forest
- 500 trees each
- ~25 decisions per tree
- 1.312.471 decisions total!
×
OOB error: 27.7%
Real world scenario
FRAUD DETECTION EXPLANATIONS
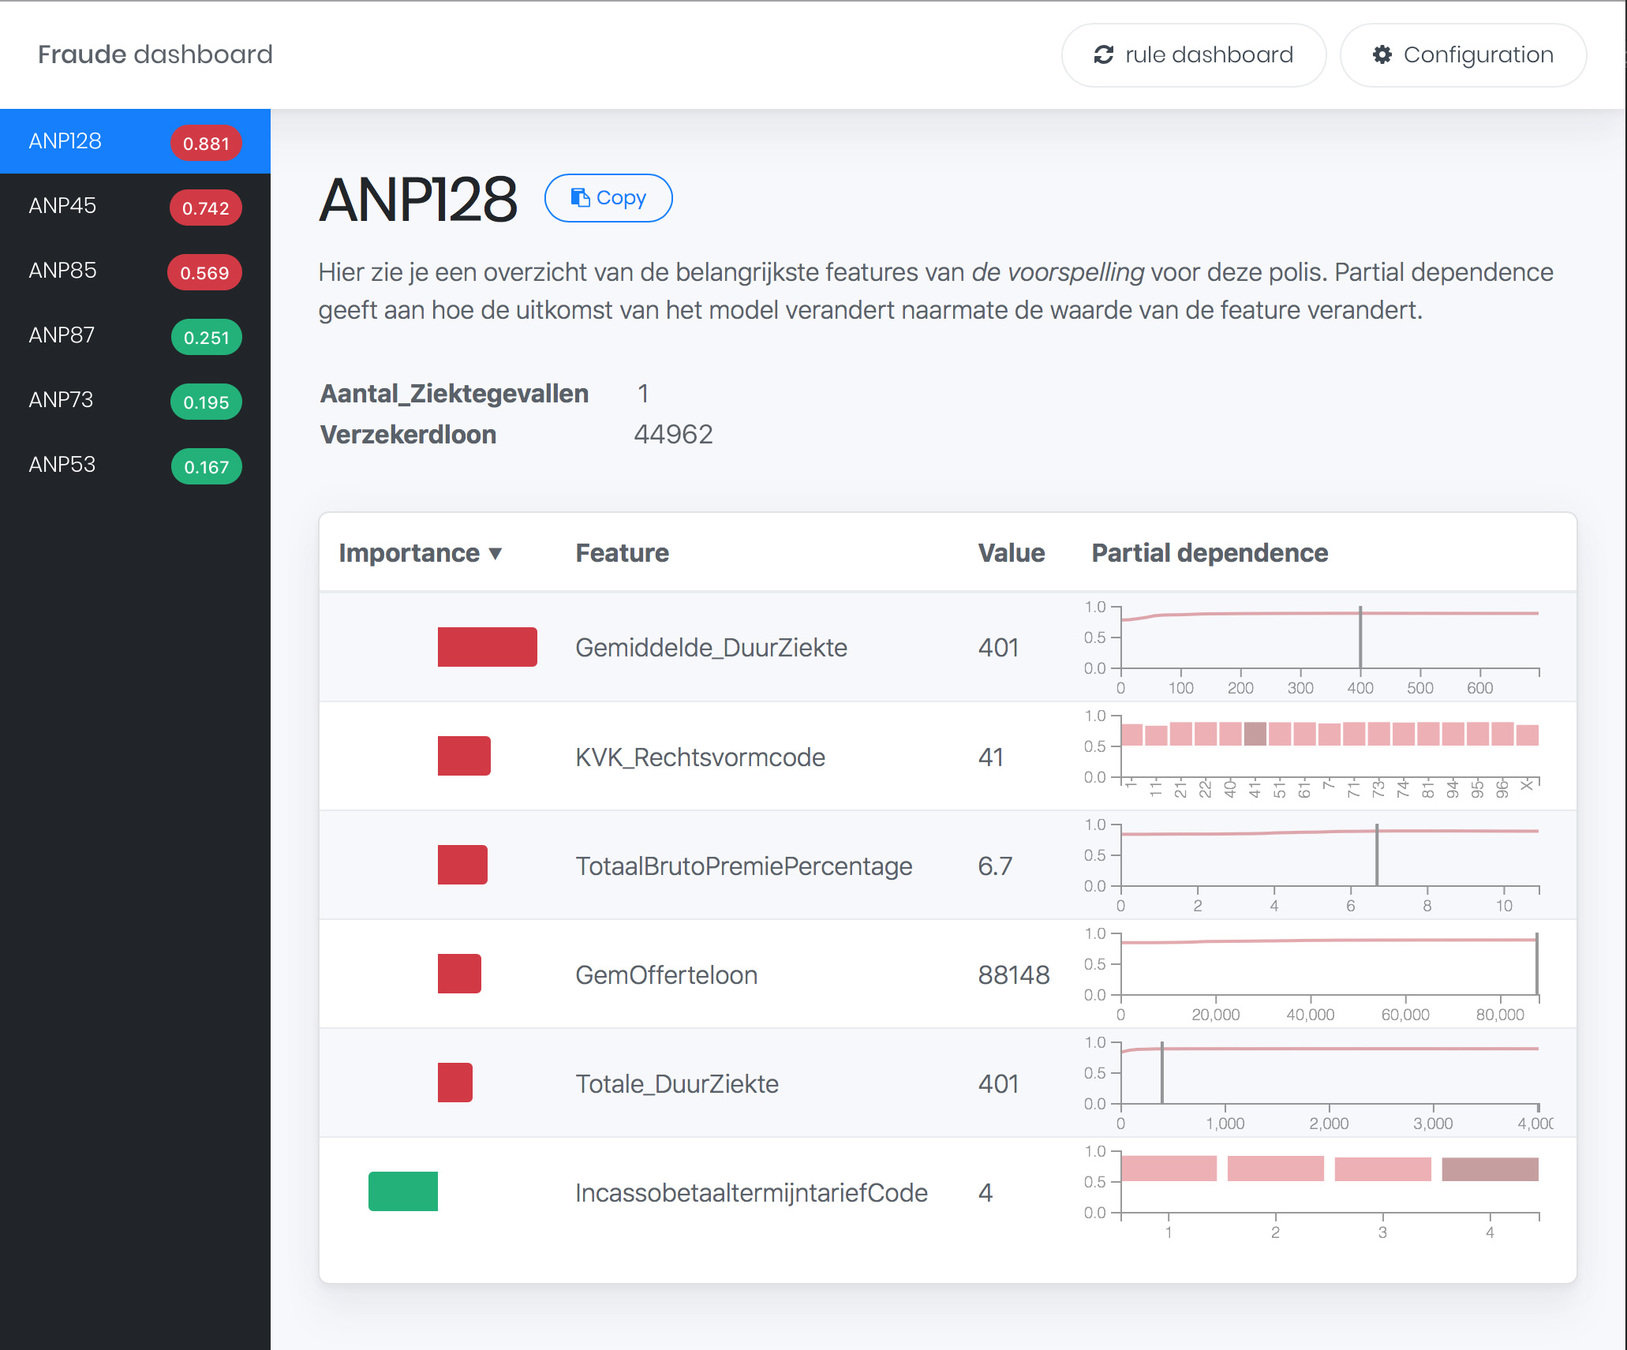
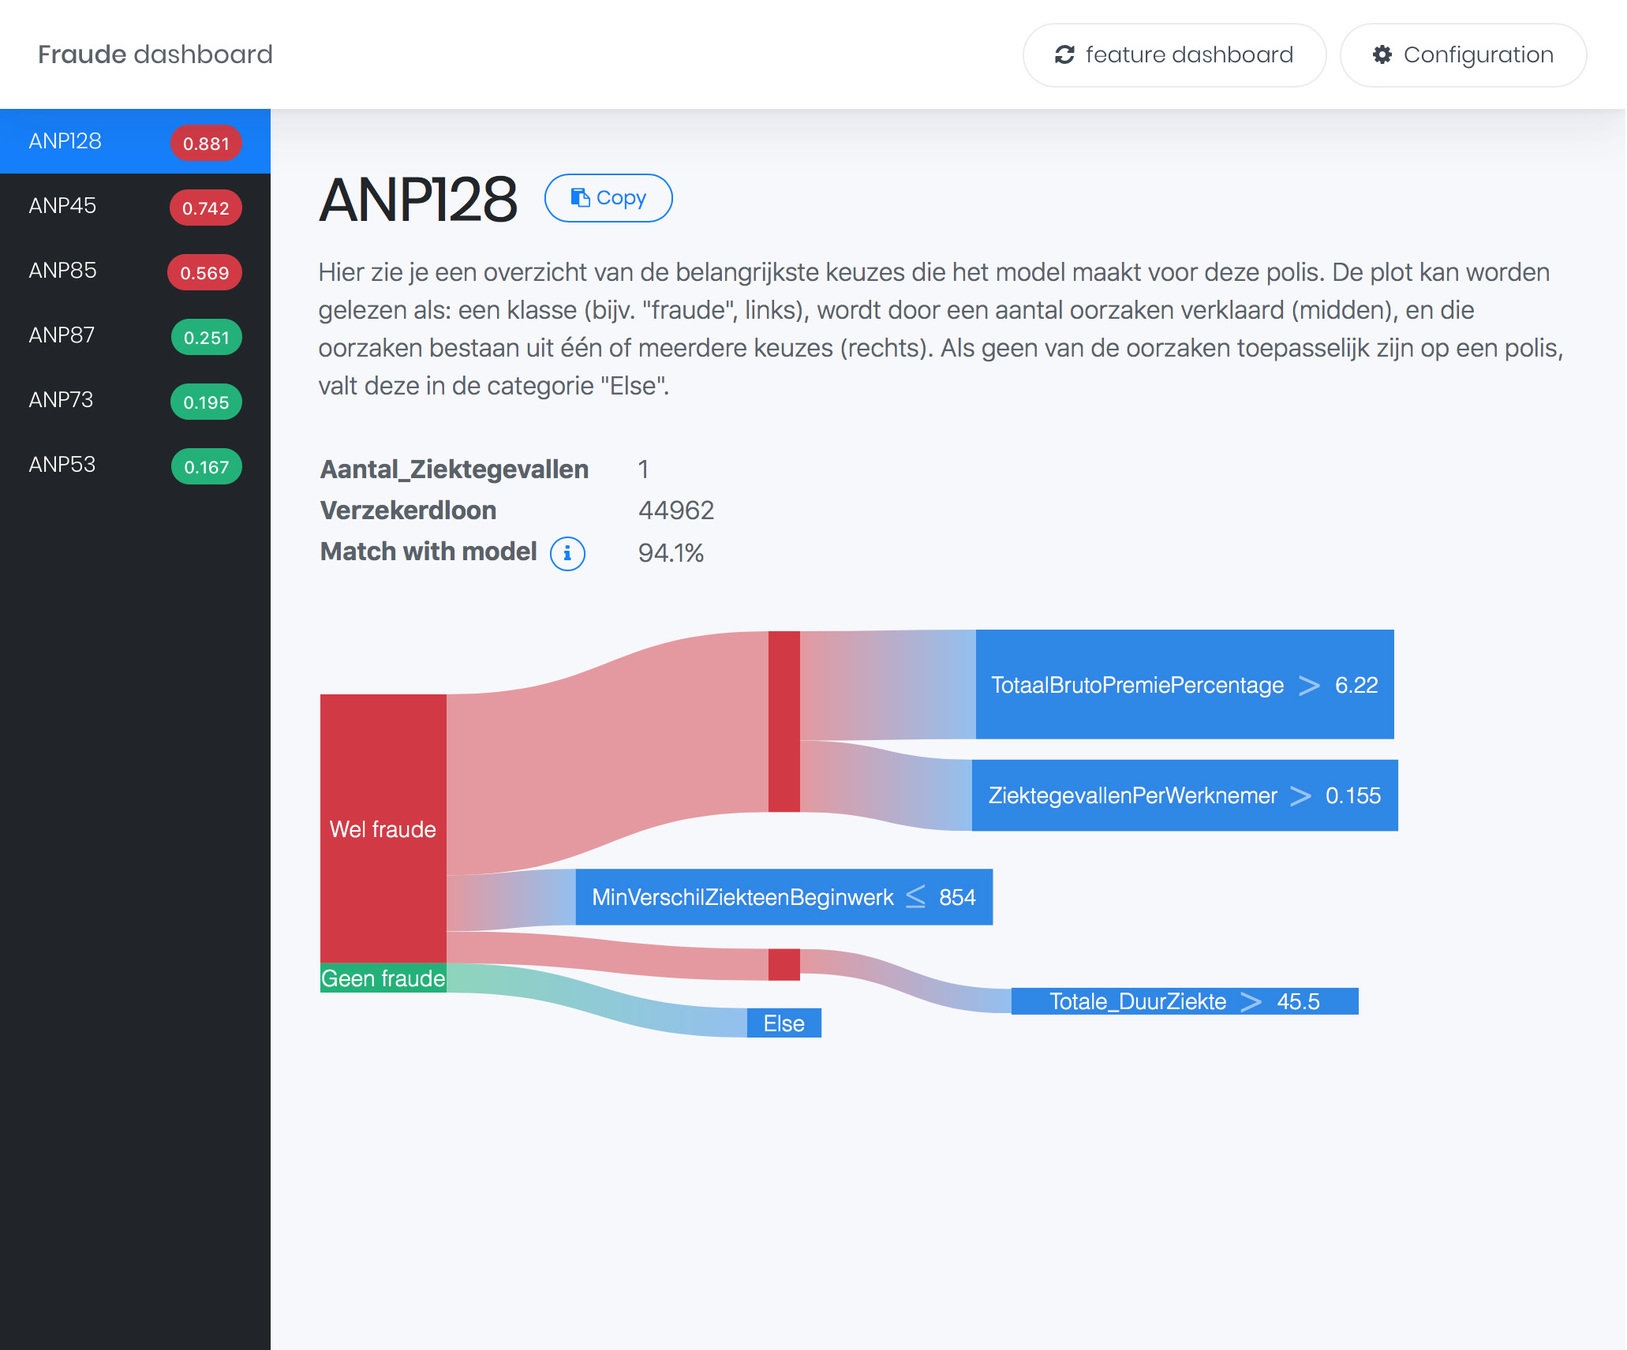


My solution
FRAUD DETECTION EXPLANATIONS
[1] Palczewska, Anna et. al. Interpreting random forest classification models using a feature contribution method. In Integration of reusable systems, pp. 193–218. Springer, 2014.
0 1 2 3 x
y
2
1
7 : 7
6 : 2
...
\(Y_{mean}\) = 0.5
\(Y_{mean}\) = 0.75
\(LI_{X}\) = 0.25
Contribution per Decision Tree:
\(FC_{i,t}^f = \sum_{N \in R_{i,t}} LI_f^N\)
Contribution per Random Forest:
\(FC_i^f = \frac{1}{T}\sum_{t=1}^T FC_{i,t}^f\)
X < 2.5
Feature contribution
FRAUD DETECTION EXPLANATIONS
[2] Friedman, Jerome H. Greedy function approximation: A gradient boosting machine. Annals of Statistics, 29(5): pp. 1189–1232, 2001.
300
250
200
150
100
50
1
0%
100%
200
100
0
Duration illness
Fraud?
Fraud (55%)
Non-fraud (35%)
| Company | ABC Inc |
| Employees | 5 |
| Duration illness | days |
| ... | ... |
Fraud (65%)
Fraud (90%)
Non-fraud (45%)
Non-fraud (40%)
Non-fraud (25%)
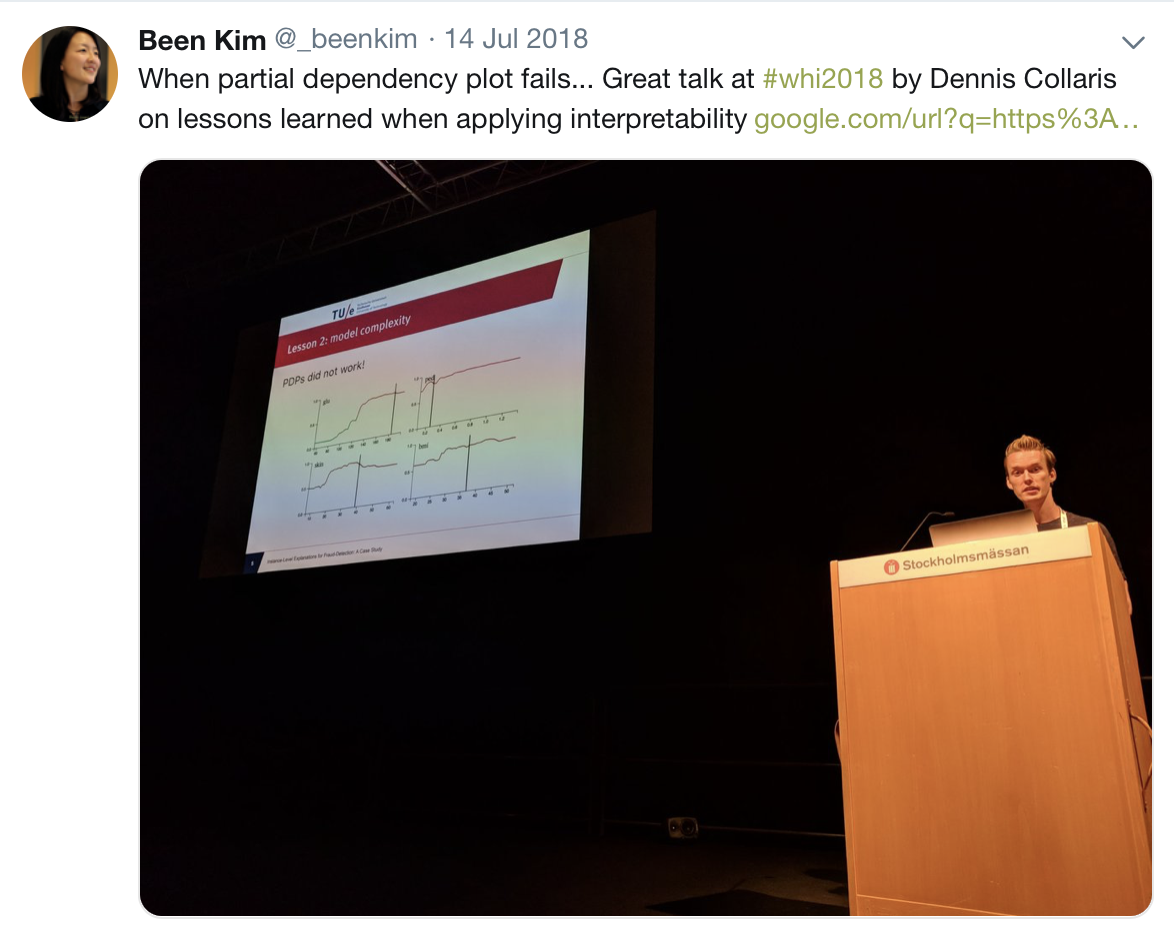
Partial dependence
FRAUD DETECTION EXPLANATIONS
[3] Ribeiro, Marco Tulio et. al. Why should i trust you?: Explaining the predictions of any classifier. In
Proceedings of the 22nd ACM SIGKDD, pp. 1135–1144. ACM, 2016.
[4] Deng, Houtao. Interpreting tree ensembles with inTrees. arXiv preprint arXiv:1408.5456 , pp. 1–18, 2014.
0 1 2 3 x
y
2
1


Local rule extraction
FRAUD DETECTION EXPLANATIONS
Fraud team happy! 🎉
FRAUD DETECTION EXPLANATIONS

Paper presented at:
Workshop on Human Interpretability in Machine Learning
Stockholm, Sweden
FRAUD DETECTION EXPLANATIONS
FRAUD DETECTION EXPLANATIONS
Questions?
Visual exploration of
machine learning explanations
Local
Global
EXPLAINEXPLORE
Surrogate learning
0 1 2 3 x
y
2
1
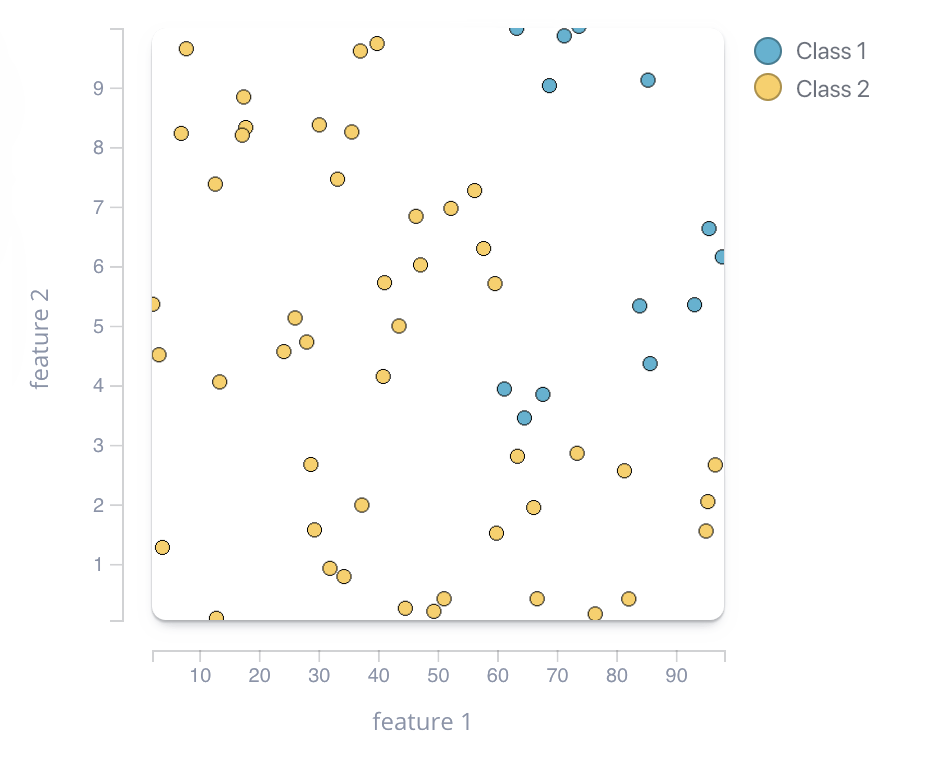
Feature 1
Feature 2
Feature 3
Feature 1
Feature 2
Feature 3
Feature 1
Feature 2
Feature 3
Problem
EXPLAINEXPLORE
Help data scientists to create and tune explanatory surrogate models.
EXPLAINEXPLORE
-
← Any tabular data set
-
← Any Python classifier, or PMML
-
← Different surrogate models

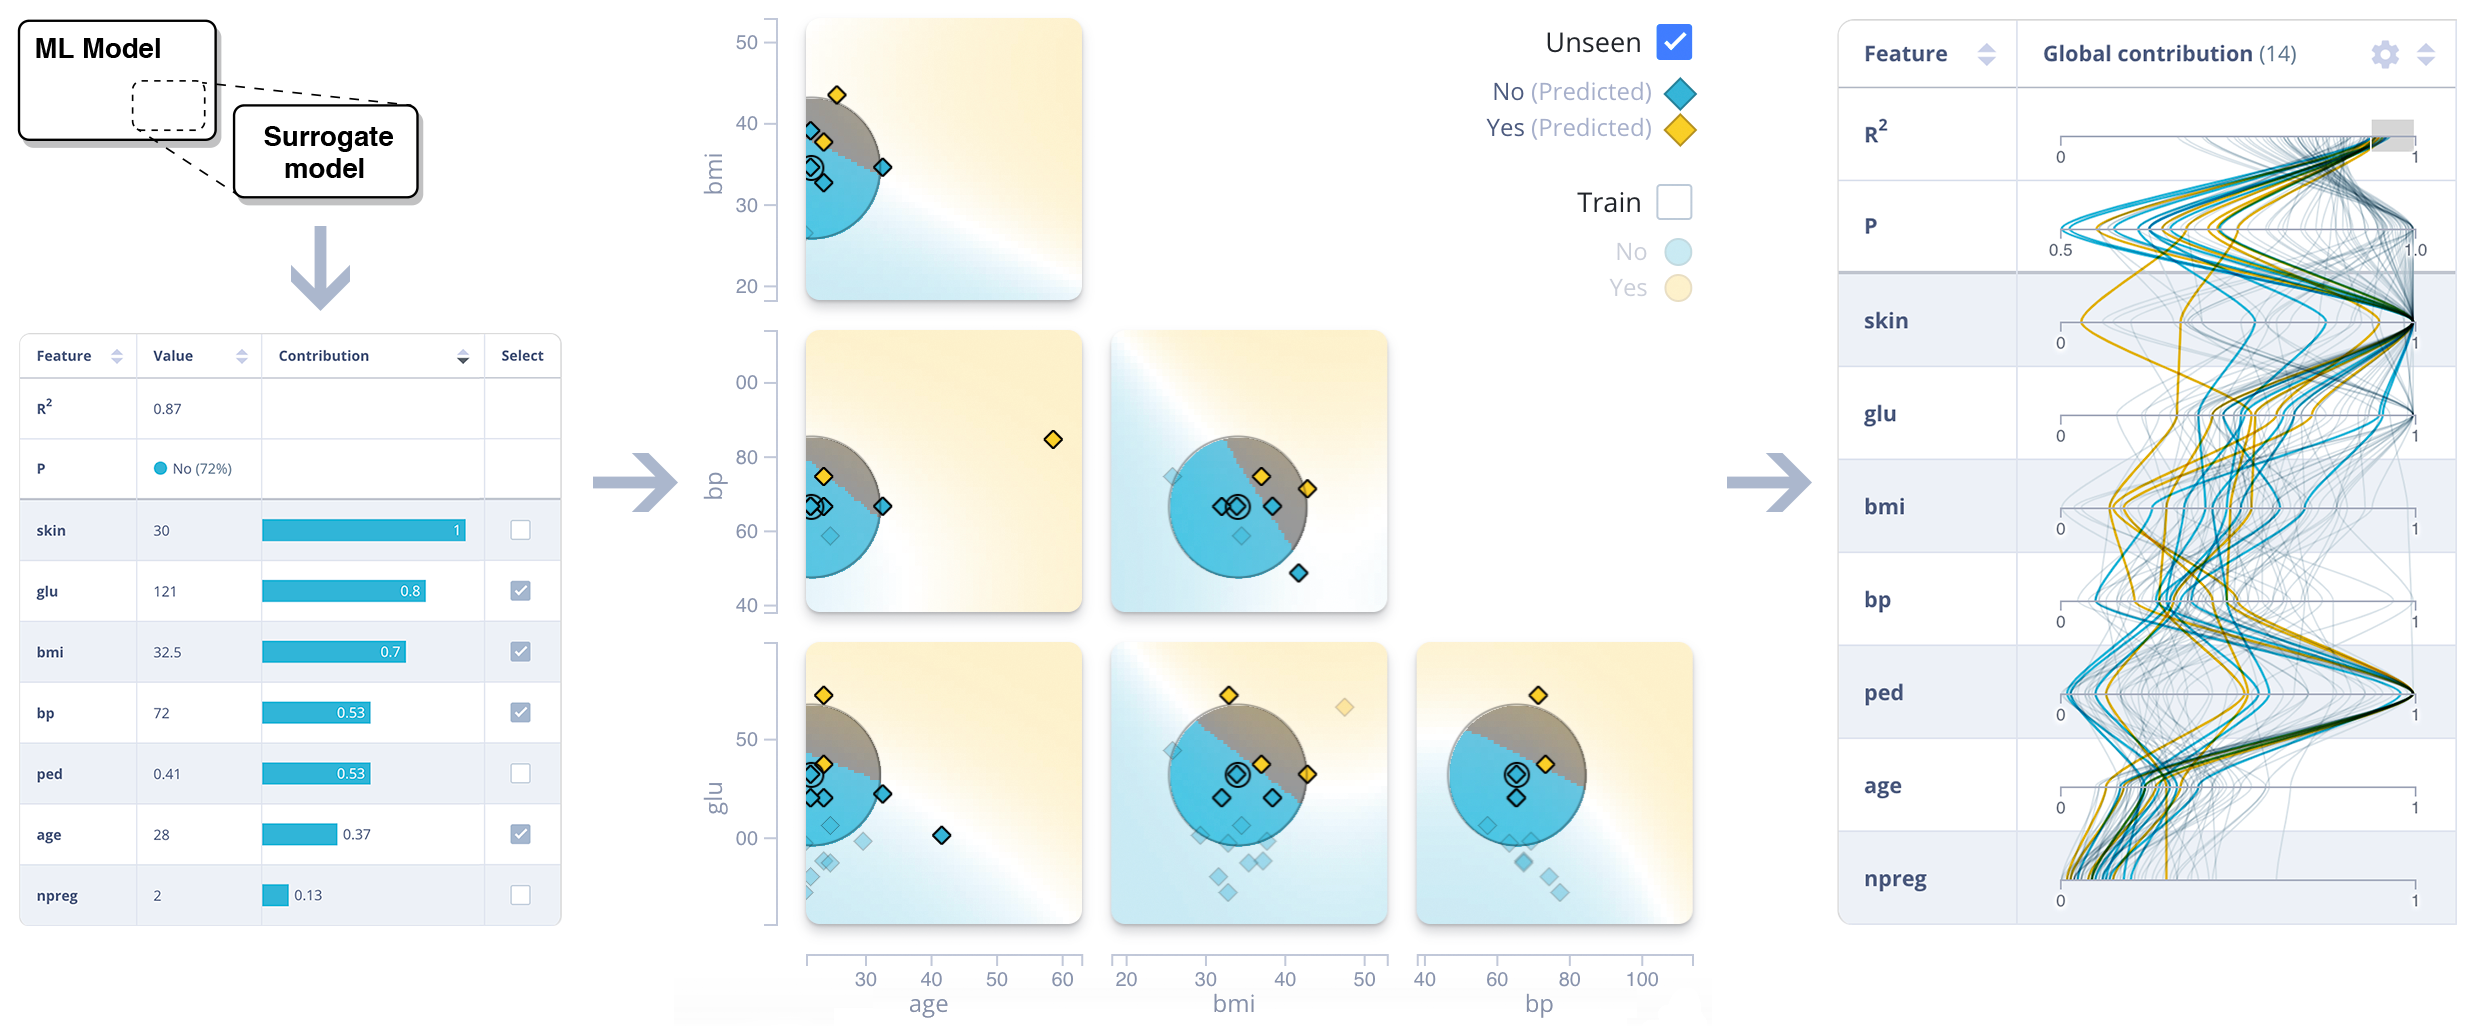
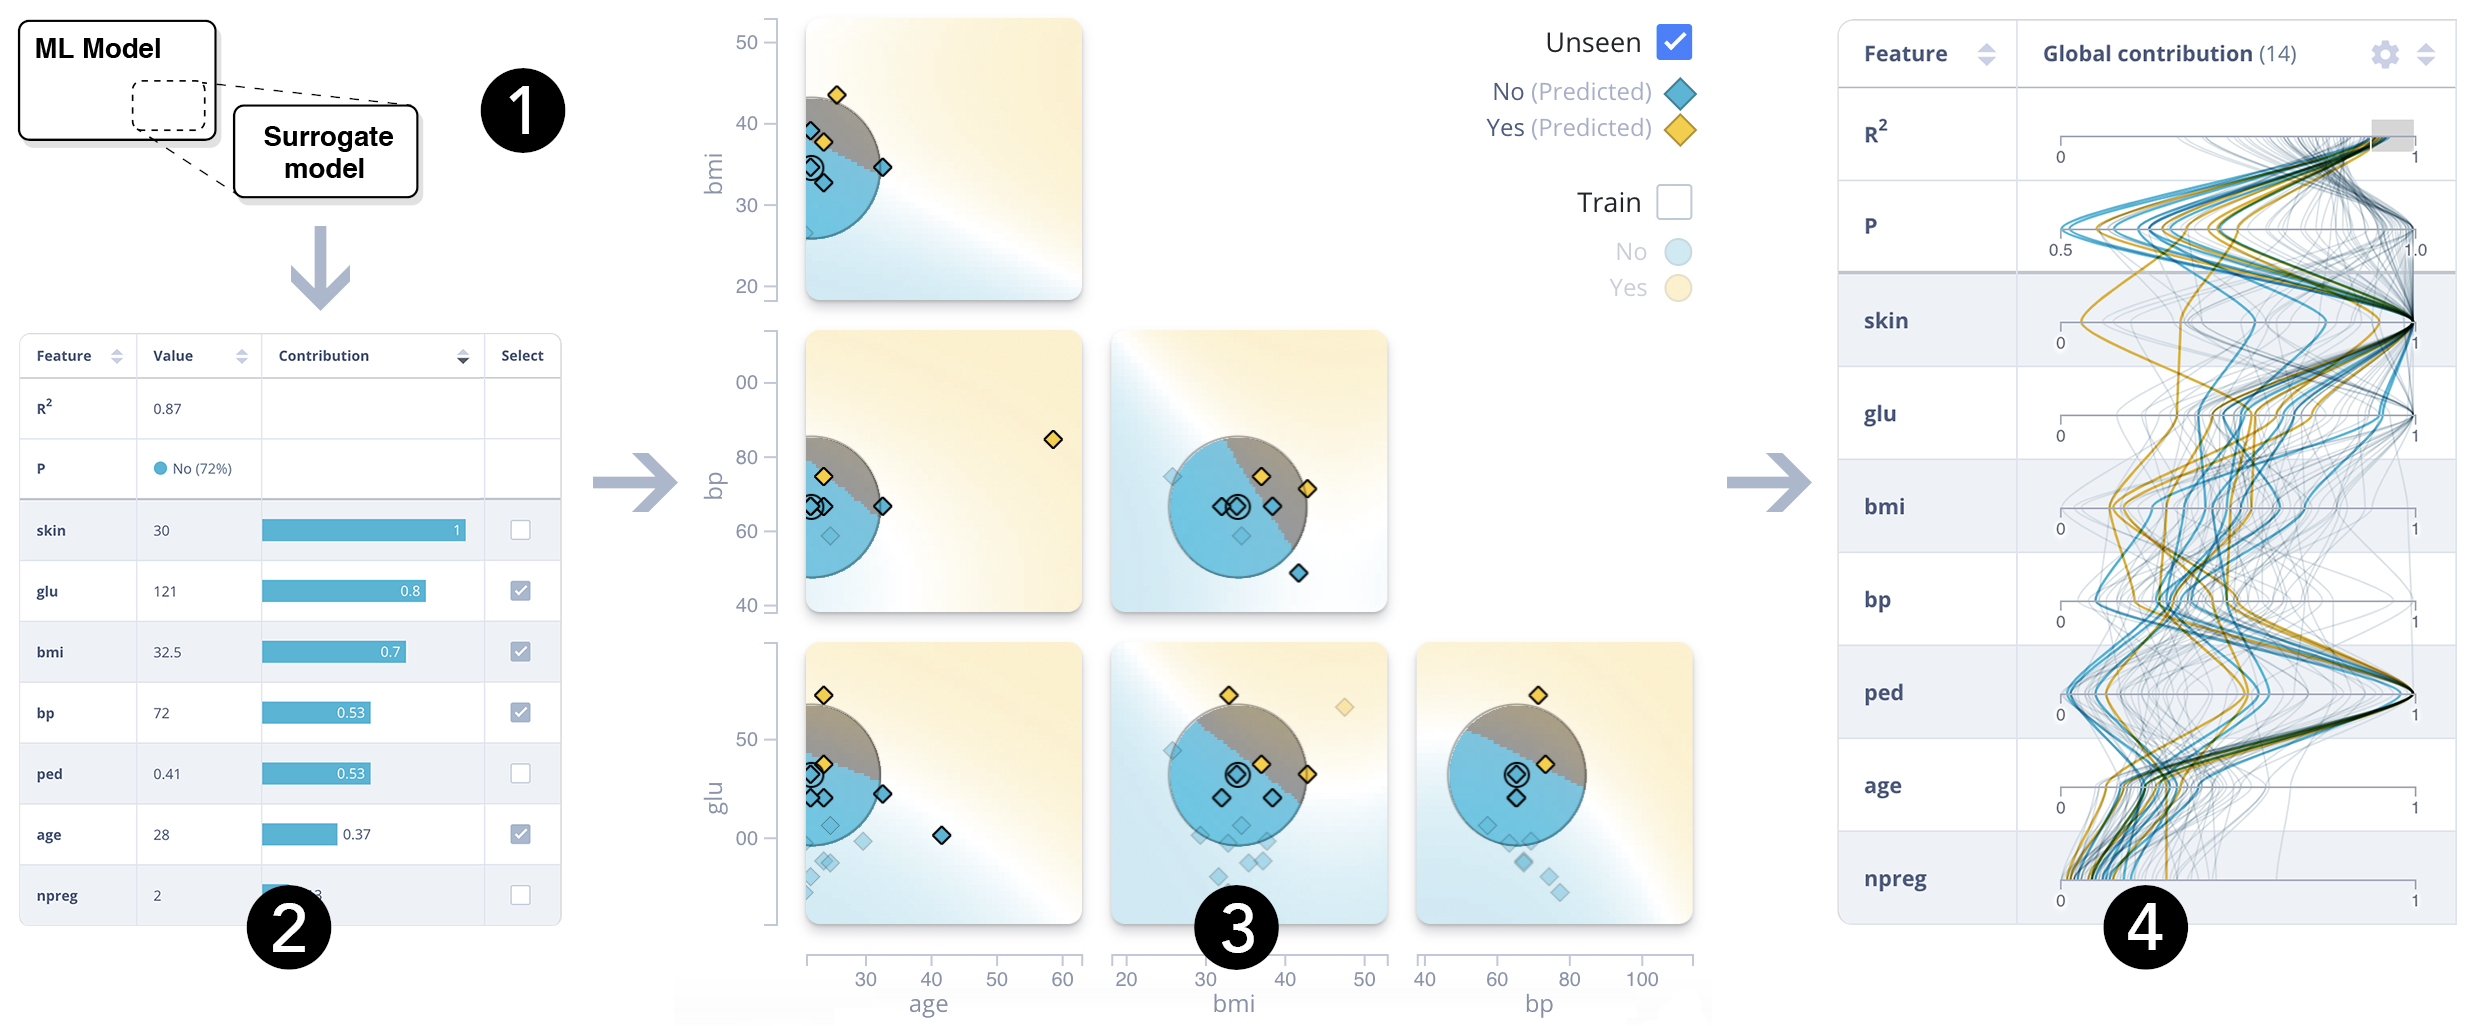
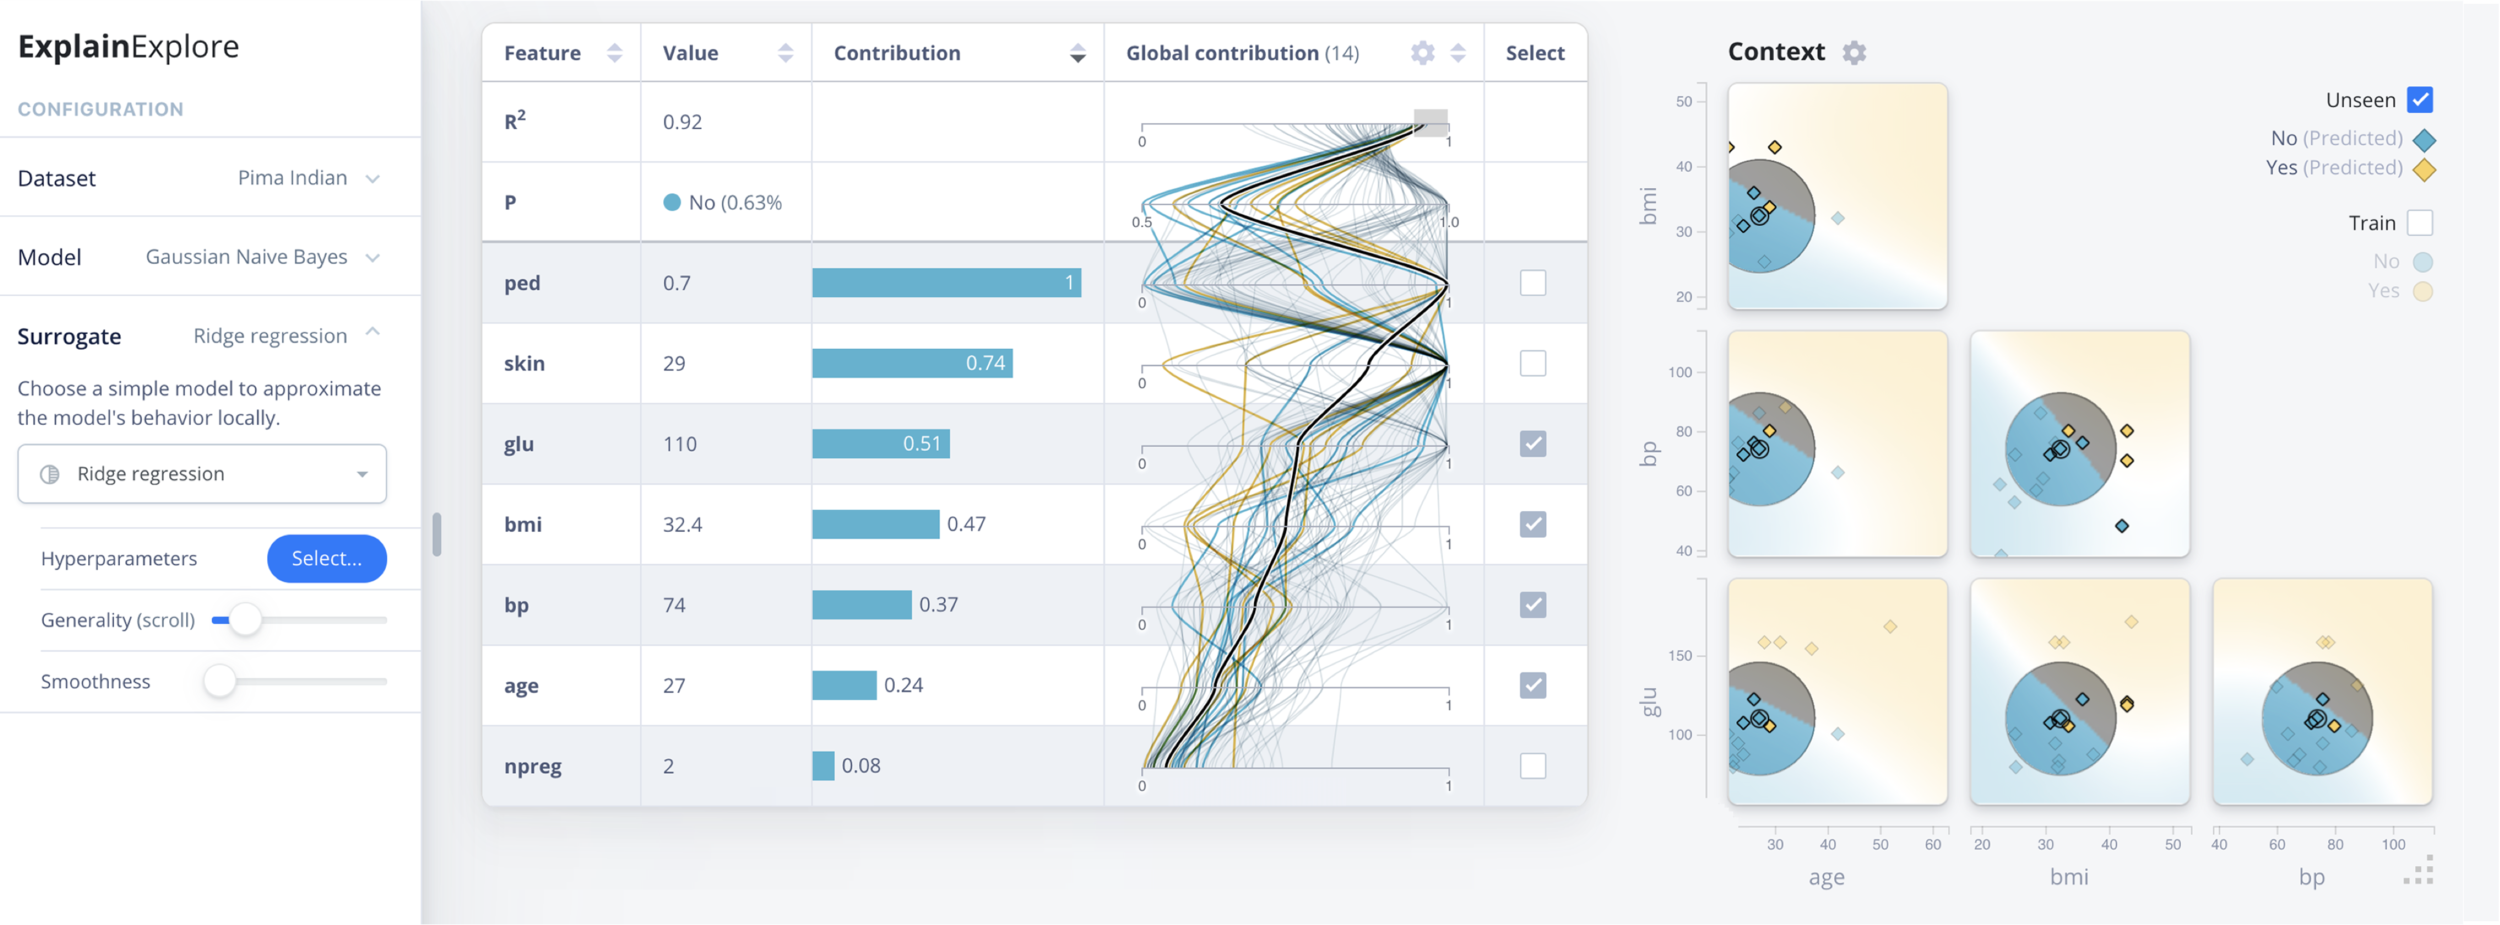
Configuration view
EXPLAINEXPLORE
- ← Surrogate fidelity: R2
- ← Prediction
- ← Feature contribution
Local columns
Global columns
- Shows values or contribution →
- Line color = predicted class →
- Compare selected instance with data →
- Clusters indicate ‘strategies’ →
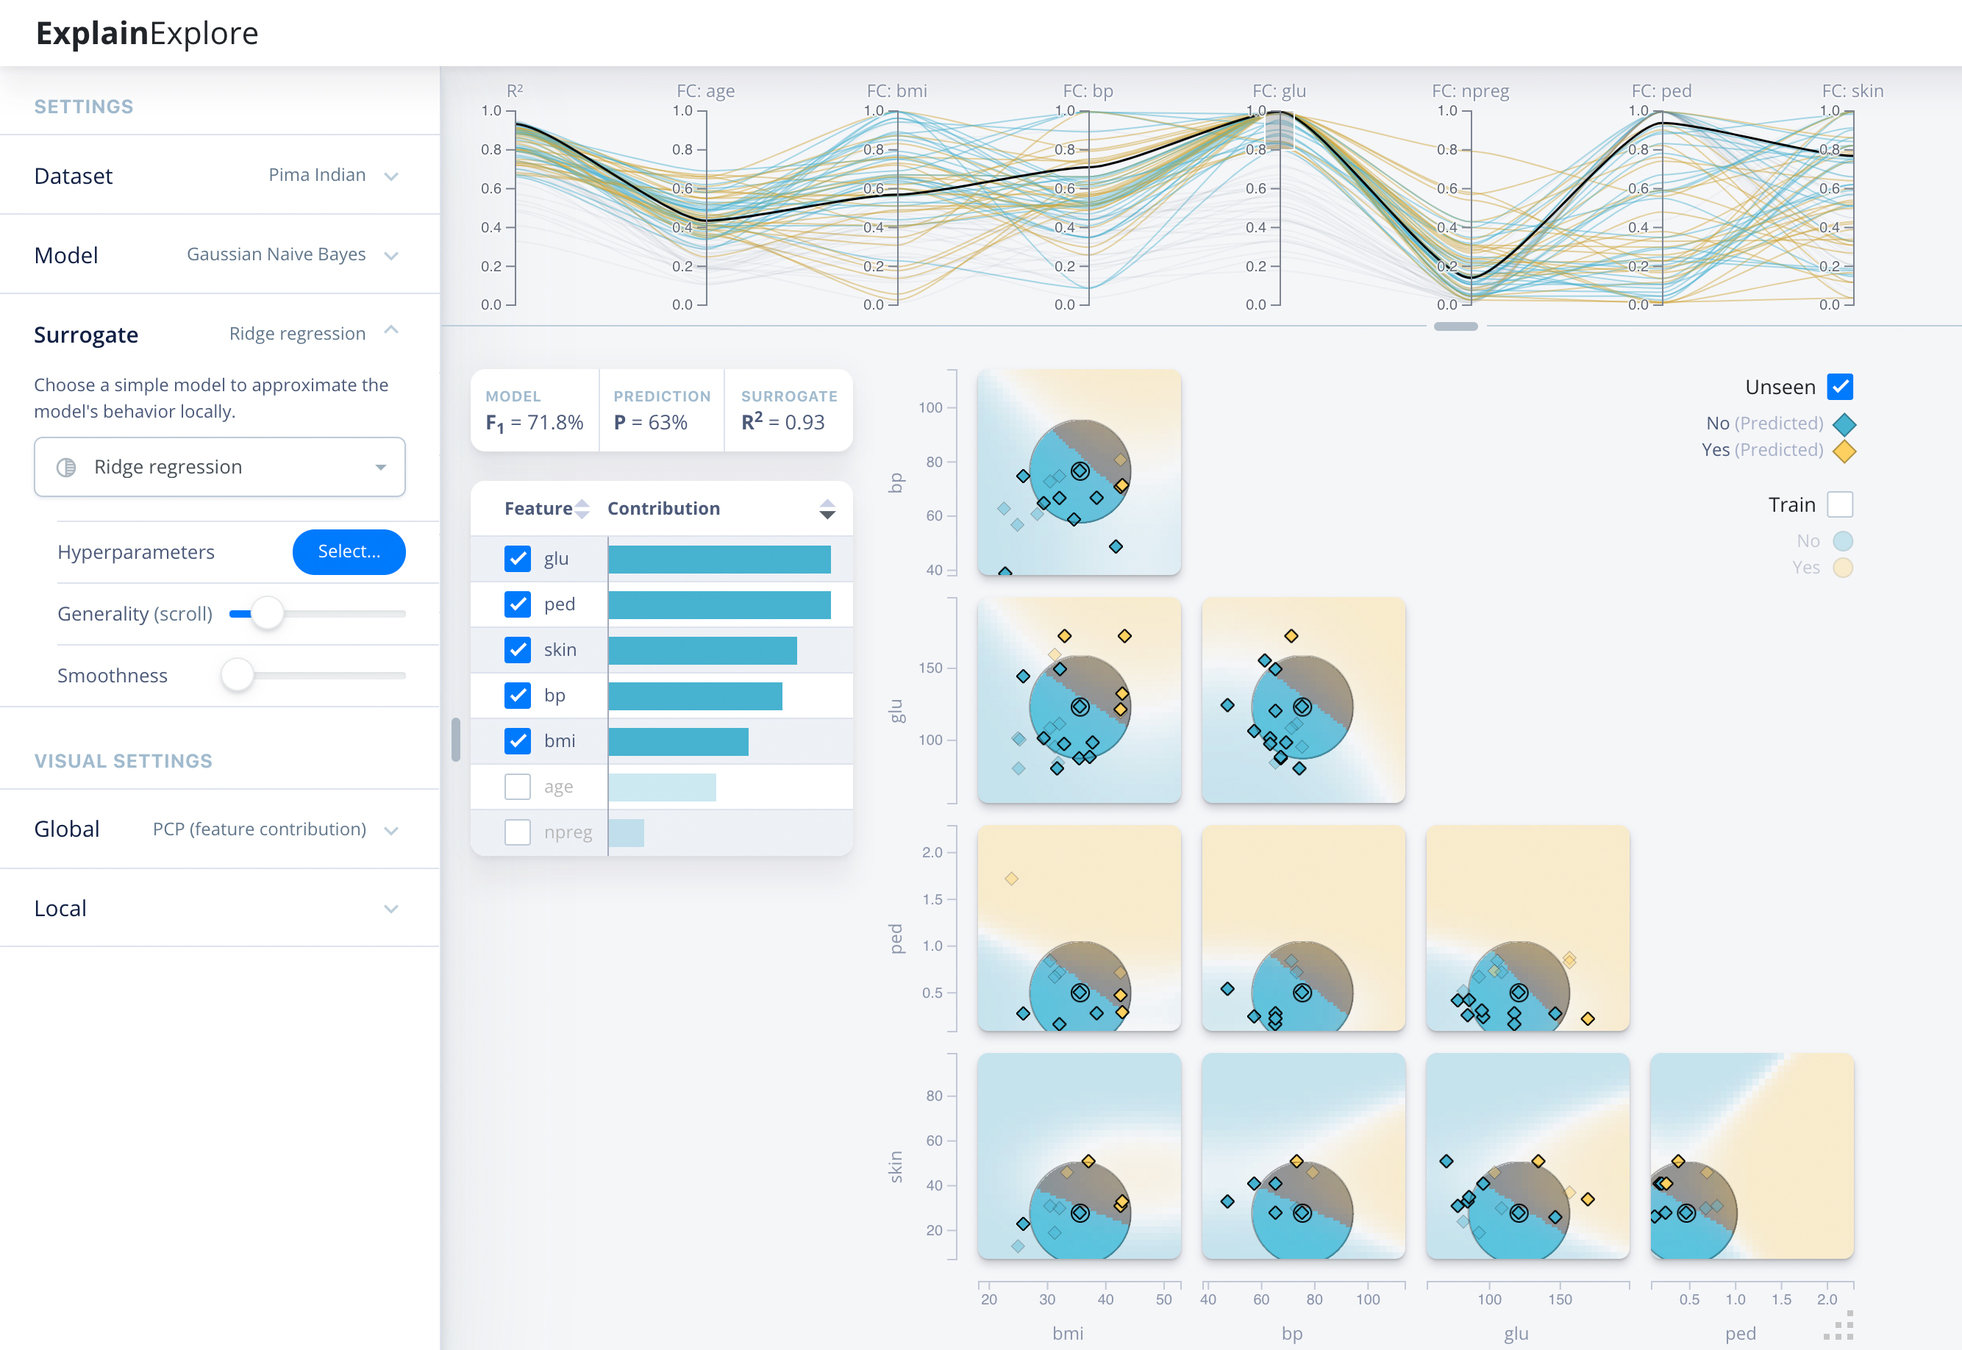
Feature view
EXPLAINEXPLORE
Context view
EXPLAINEXPLORE

Context view
EXPLAINEXPLORE
Context view
More info at
explaining.ml

EXPLAINEXPLORE
Questions?
More info at
explaining.ml
EXPLAINEXPLORE
Can be used for any Python model...
Can be used for any model...
EXPLAINER TECHNIQUES
Applications

sklearn-pmml-model
bit.ly/
sklearn-pmml

or
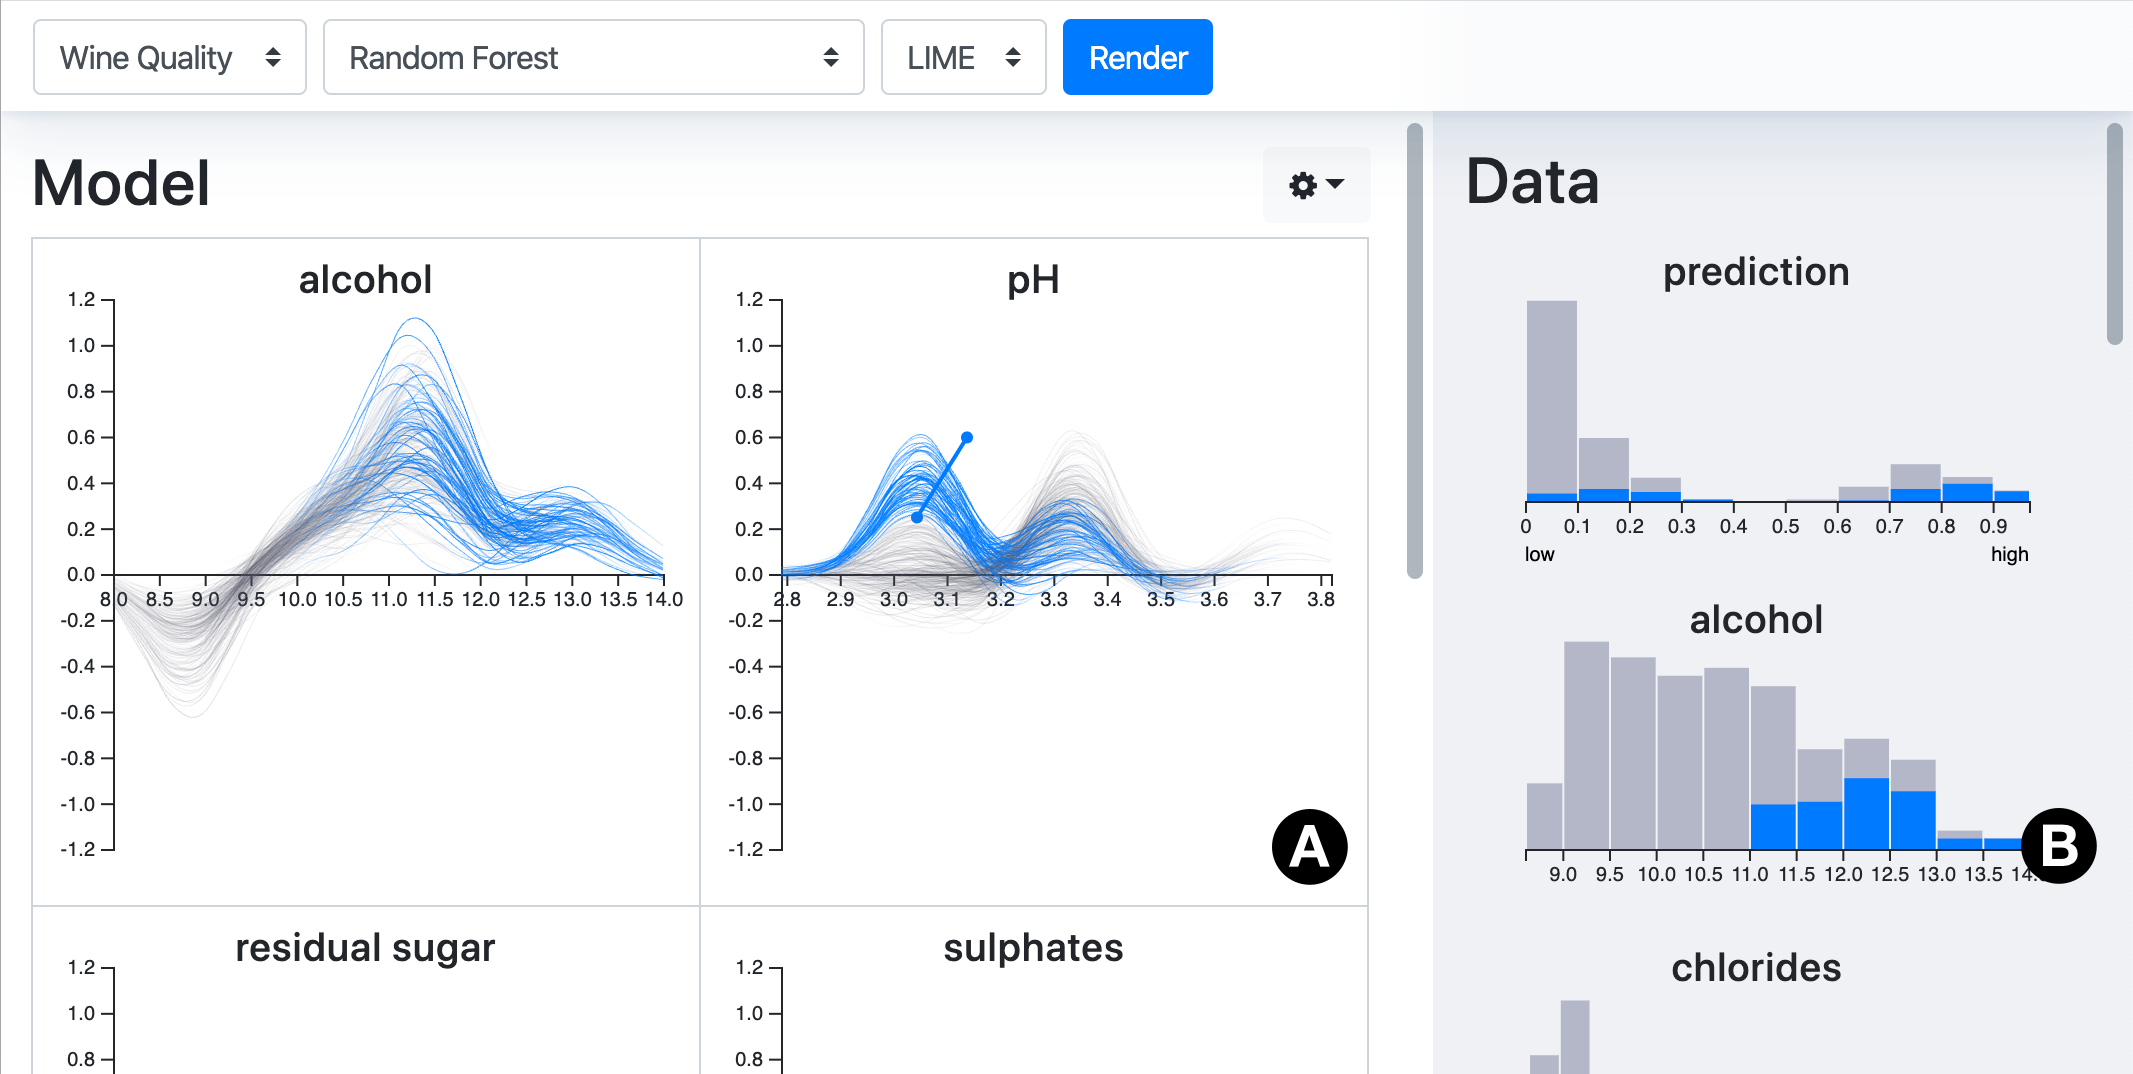
Machine Learning Interpretability through Contribution-Value Plots
CONTRIBUTION-VALUE PLOTS
Local
Global
Pre-existing techniques as elementary building blocks.
Prediction (ŷ)
x
ŷ


CONTRIBUTION-VALUE PLOTS
The idea
Pre-existing techniques as elementary building blocks.
[1] Friedman, J. H. "Greedy function approximation: a gradient boosting machine.", 2001.
Prediction (ŷ)
Local PDP [1]
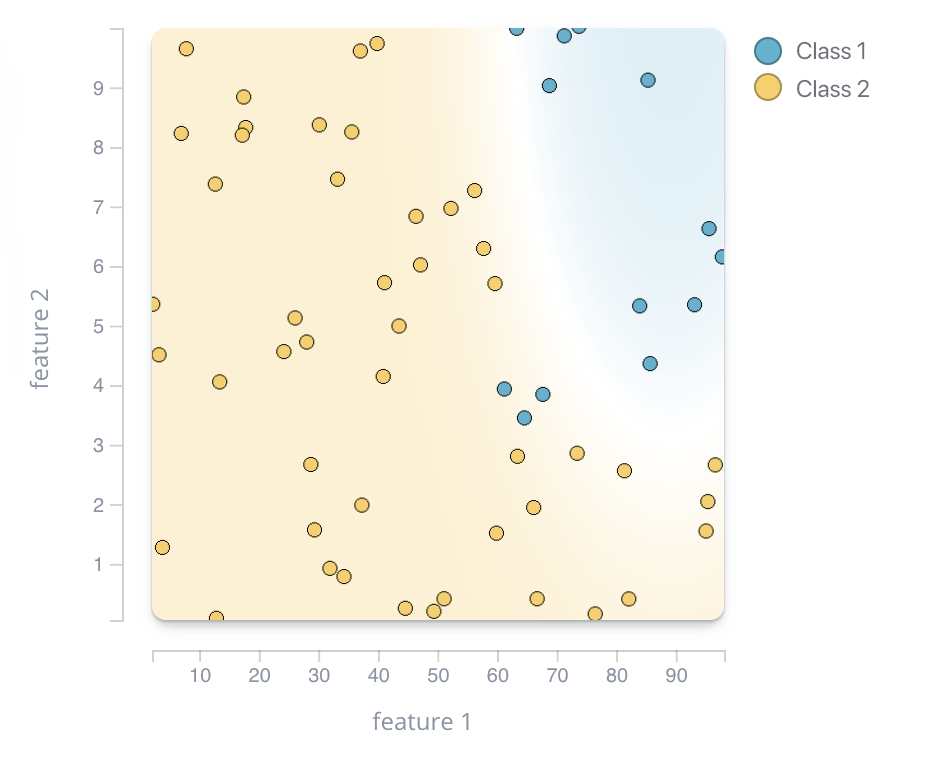
Sensitivity
analysis
x
ŷ


CONTRIBUTION-VALUE PLOTS
The idea
Pre-existing techniques as elementary building blocks.
Prediction (ŷ)
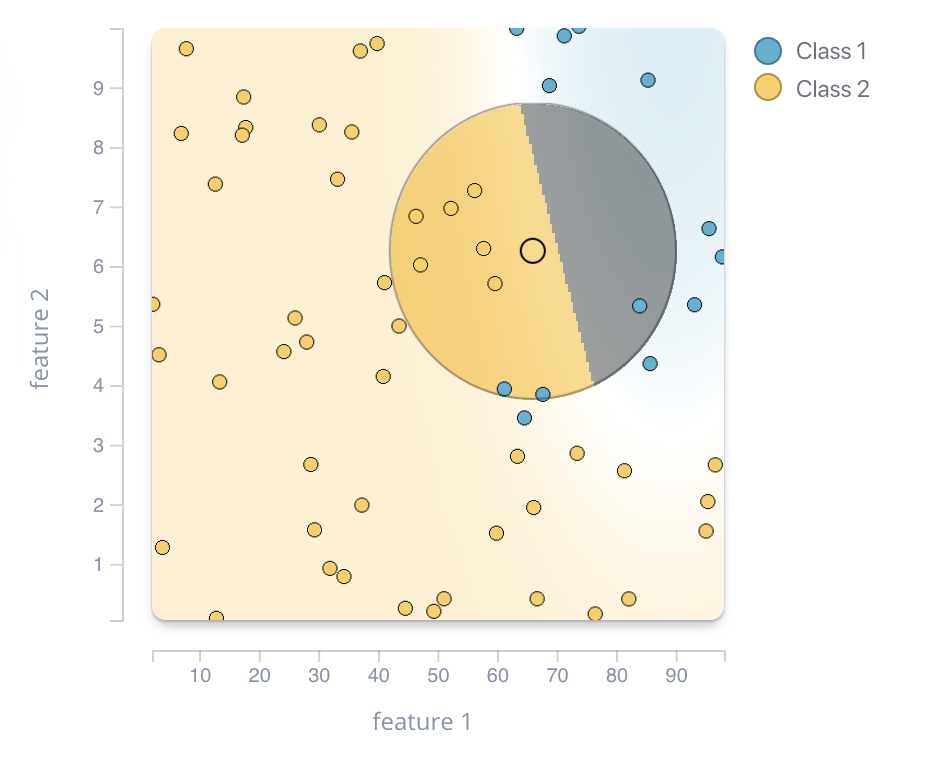
Sensitivity
analysis
x
ŷ
[2] Goldstein, A., et al. "Peeking inside the black box: Visualizing statistical learning with plots of individual conditional expectation.", 2015.
Local PDP [1]
ICE plot [2]
Repeat
x
ŷ
CONTRIBUTION-VALUE PLOTS
The idea
Pre-existing techniques as elementary building blocks.
[4] Lundberg, S. M., et. al.. "A unified approach to interpreting model predictions.". 2017.
Feature 1
Feature 2
Feature 3
Feature 4
Feature 5
[3] Ribeiro, M. T., et. al. ""Why should i trust you?" Explaining the predictions of any classifier.", 2016.
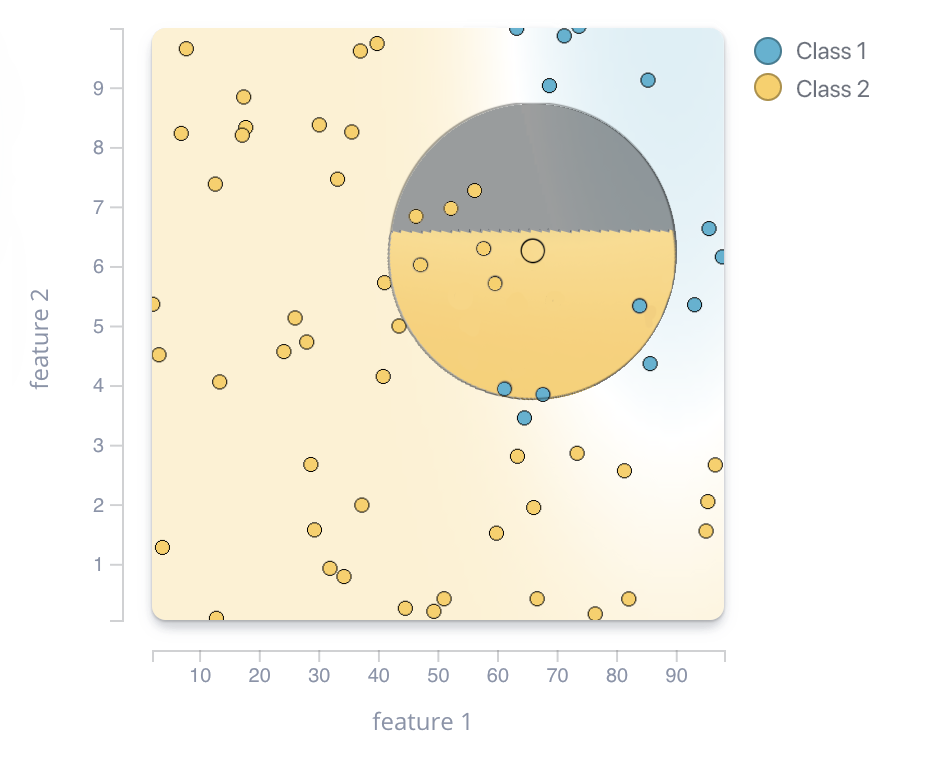
CONTRIBUTION-VALUE PLOTS
The idea
Pre-existing techniques as elementary building blocks.
Prediction (ŷ)
Sensitivity
analysis
x
ŷ
Local PDP [1]
ICE plot [2]
Repeat
β
CONTRIBUTION-VALUE PLOTS
The idea
Pre-existing techniques as elementary building blocks.
Prediction (ŷ)
Local PDP
ICE plot
Contribution (β)
Sensitivity
analysis
Repeat
x
ŷ
β
x
β
CONTRIBUTION-VALUE PLOTS
The idea
Pre-existing techniques as elementary building blocks.
Prediction (ŷ)
Local PDP
ICE plot
Contribution (β)
LCV plot
Sensitivity
analysis
Sensitivity
analysis
Repeat
x
ŷ
β
x
β
CONTRIBUTION-VALUE PLOTS
The idea
Pre-existing techniques as elementary building blocks.
Prediction (ŷ)
Local PDP
ICE plot
Contribution (β)
LCV plot
GCV plot
Sensitivity
analysis
Sensitivity
analysis
Repeat
Repeat
x
ŷ
β
x
β
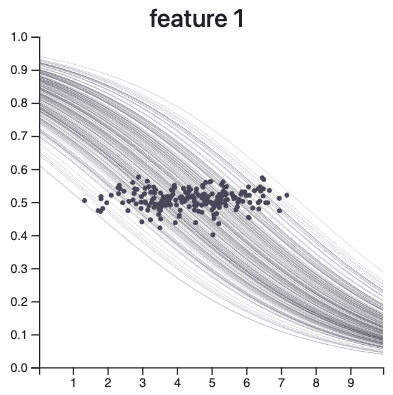
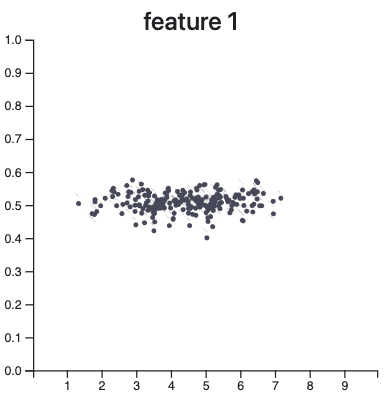
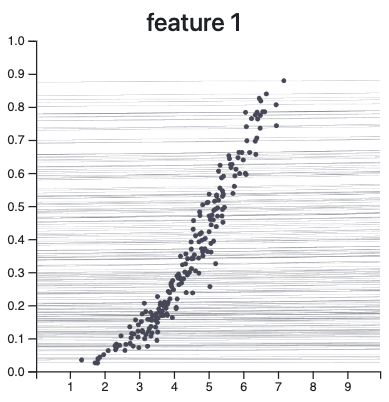
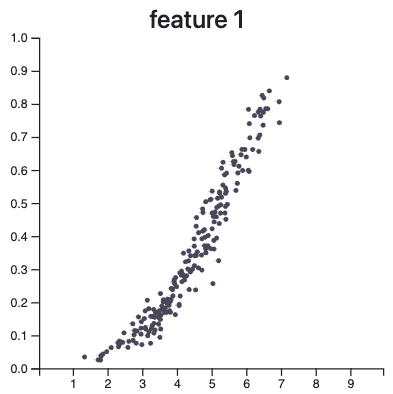
CONTRIBUTION-VALUE PLOTS
The idea
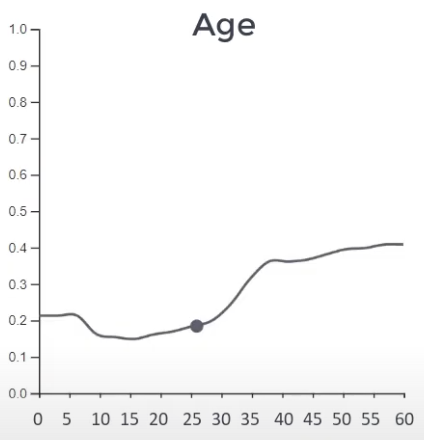
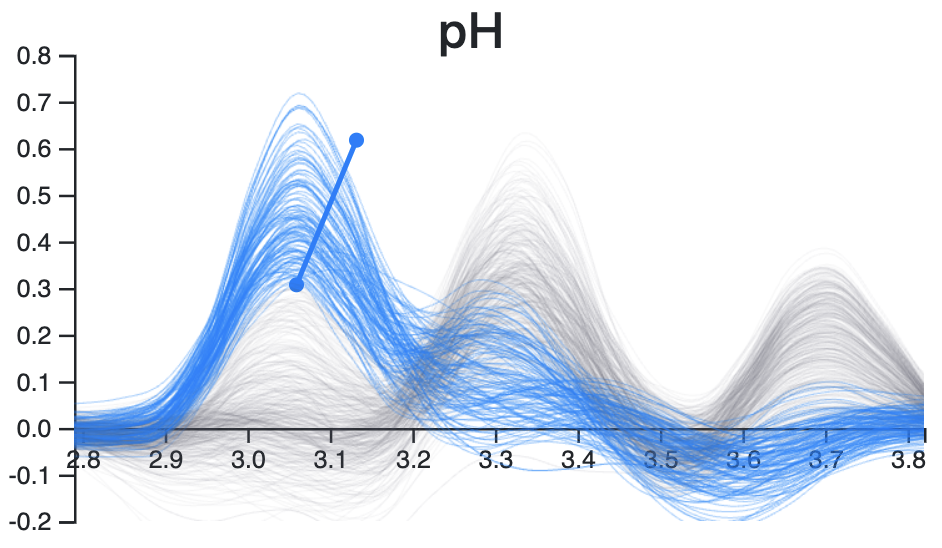
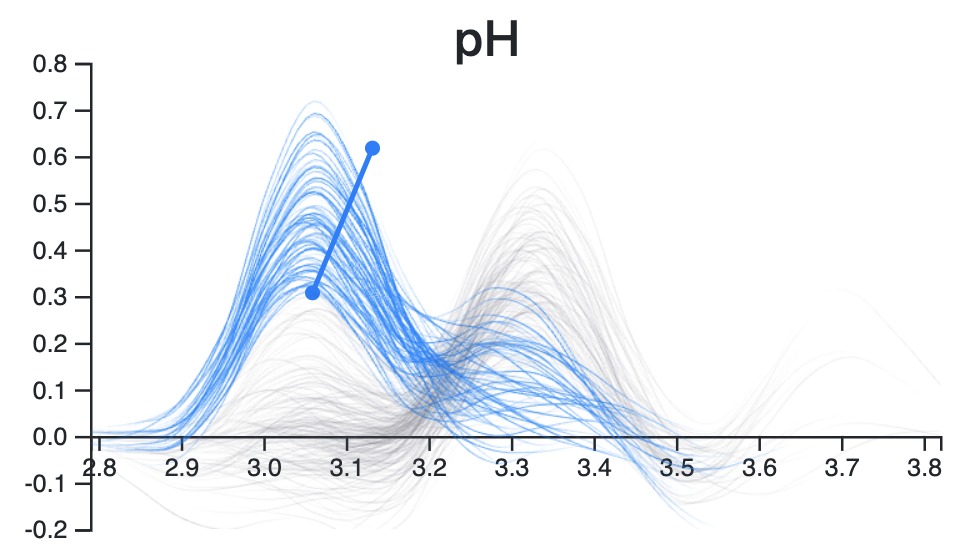
Wine acidity (pH)
x
β
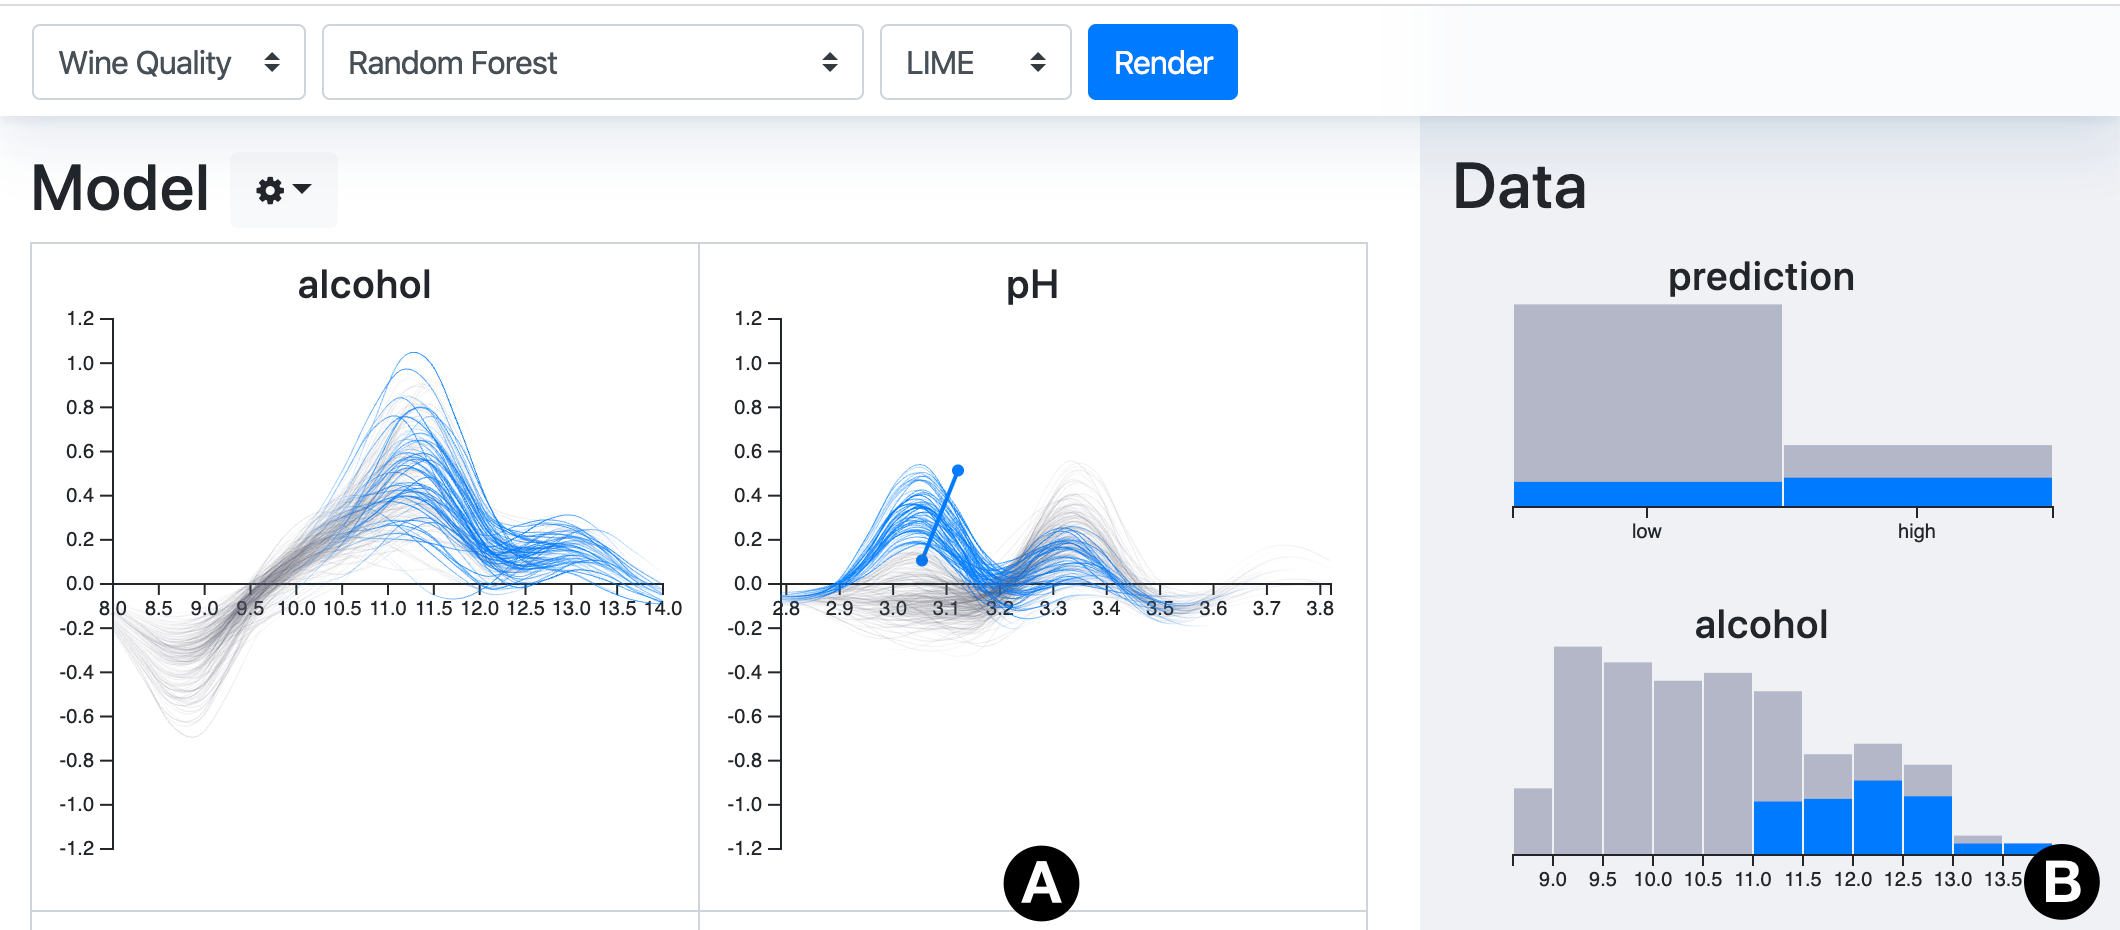
CONTRIBUTION-VALUE PLOTS
An exemplary data model exploration

Data
- 998 red wines
- 11 features
Model
- Random Forest (100 trees)
- Predict quality: 👍 / 👎
CONTRIBUTION-VALUE PLOTS
An exemplary data model exploration


x
β
x
β
CONTRIBUTION-VALUE PLOTS
Wine acidity (pH)
x
β
x
ŷ
An exemplary data model exploration
CONTRIBUTION-VALUE PLOTS
An exemplary data model exploration
??
CONTRIBUTION-VALUE PLOTS
Line fading . .


x
β
CONTRIBUTION-VALUE PLOTS
Questions?
More info at
explaining.ml
CONTRIBUTION-VALUE PLOTS
Strategy analysis for
machine learning interpretability
STRATEGYATLAS
Local
Global
How?
Strategy A
Strategy B
The basic principle
STRATEGYATLAS
How?
The basic principle
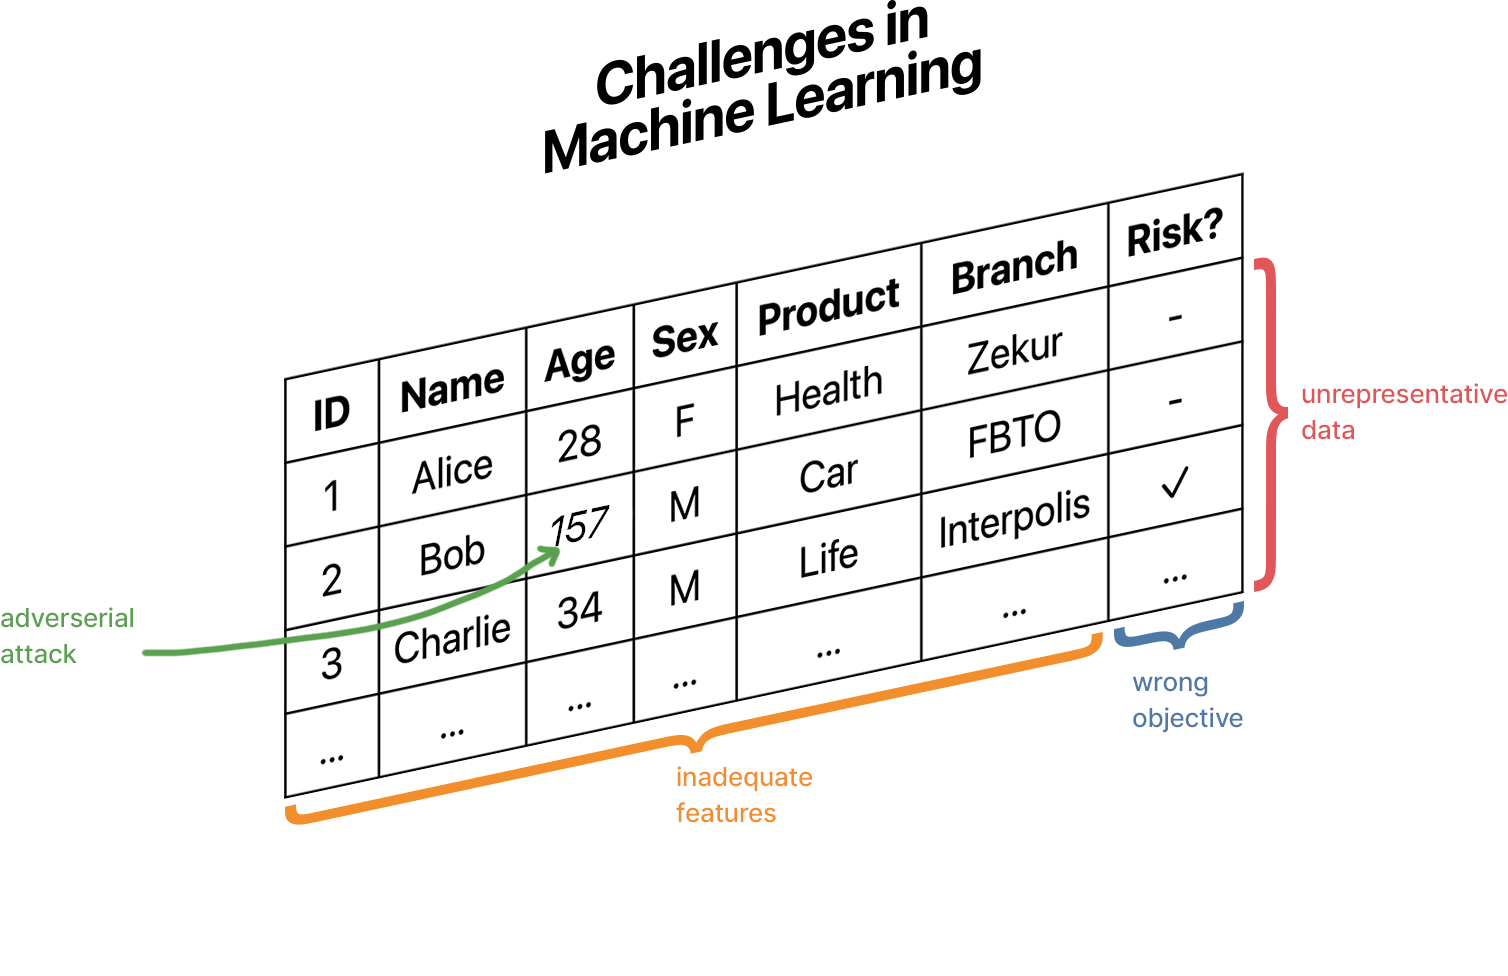
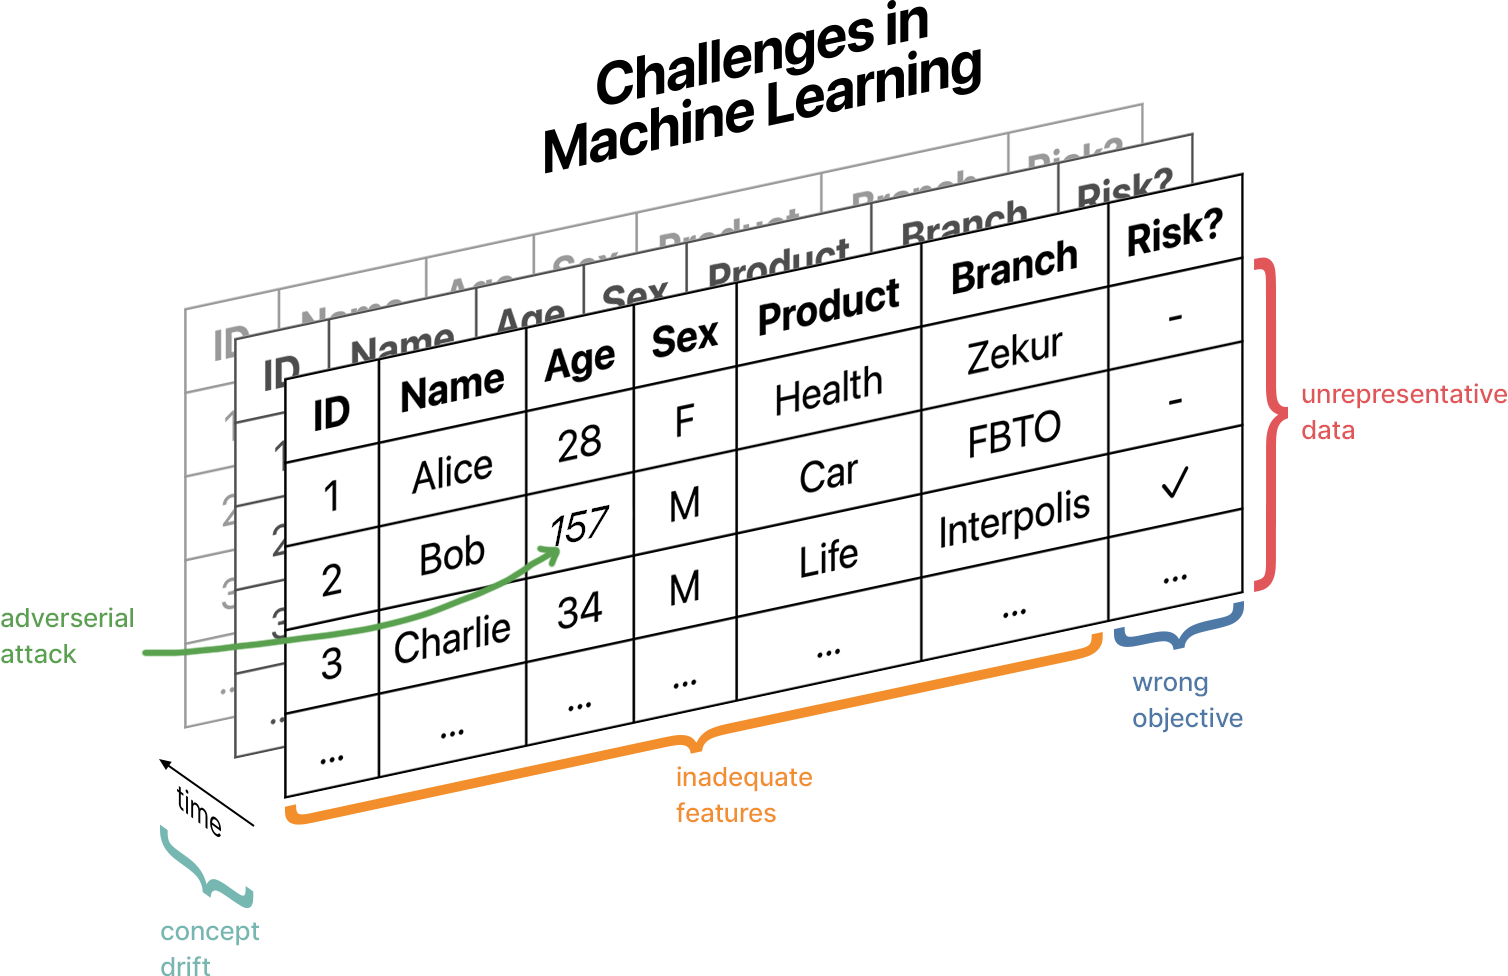
| ID | Name | Age | Sex | Product | Branch | ... |
|---|---|---|---|---|---|---|
| 1 | 💤 | 💤 | 💤 | 🔥 | 💤 | ... |
| 2 | 🔥 | 💤 | 💤 | 💤 | 🔥 | ... |
| 3 | 💤 | 🔥 | 💤 | 🔥 | 🔥 | ... |
| ... | ... | ... | ... | ... | ... | ... |
| ID | Name | Age | Sex | Product | Branch | ... |
|---|---|---|---|---|---|---|
| 1 | Alice | 28 | F | Health | Zekur | ... |
| 2 | Bob | 57 | M | Car | FBTO | ... |
| 3 | Chad | 34 | M | Life | Intrpls | ... |
| ... | ... | ... | ... | ... | ... | ... |
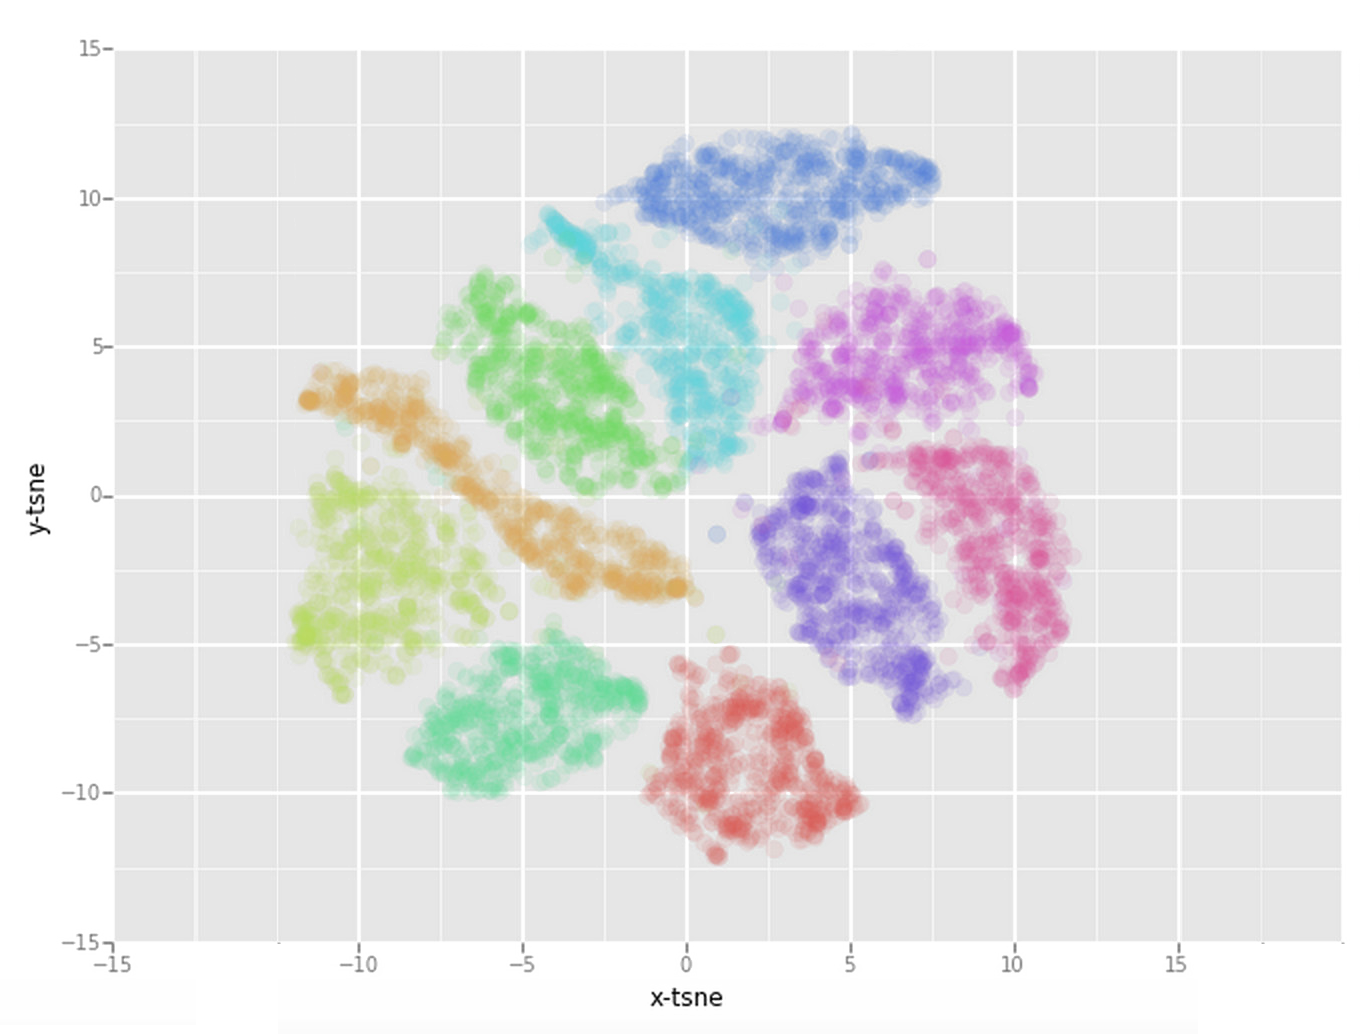
2D projection
StrategyMap
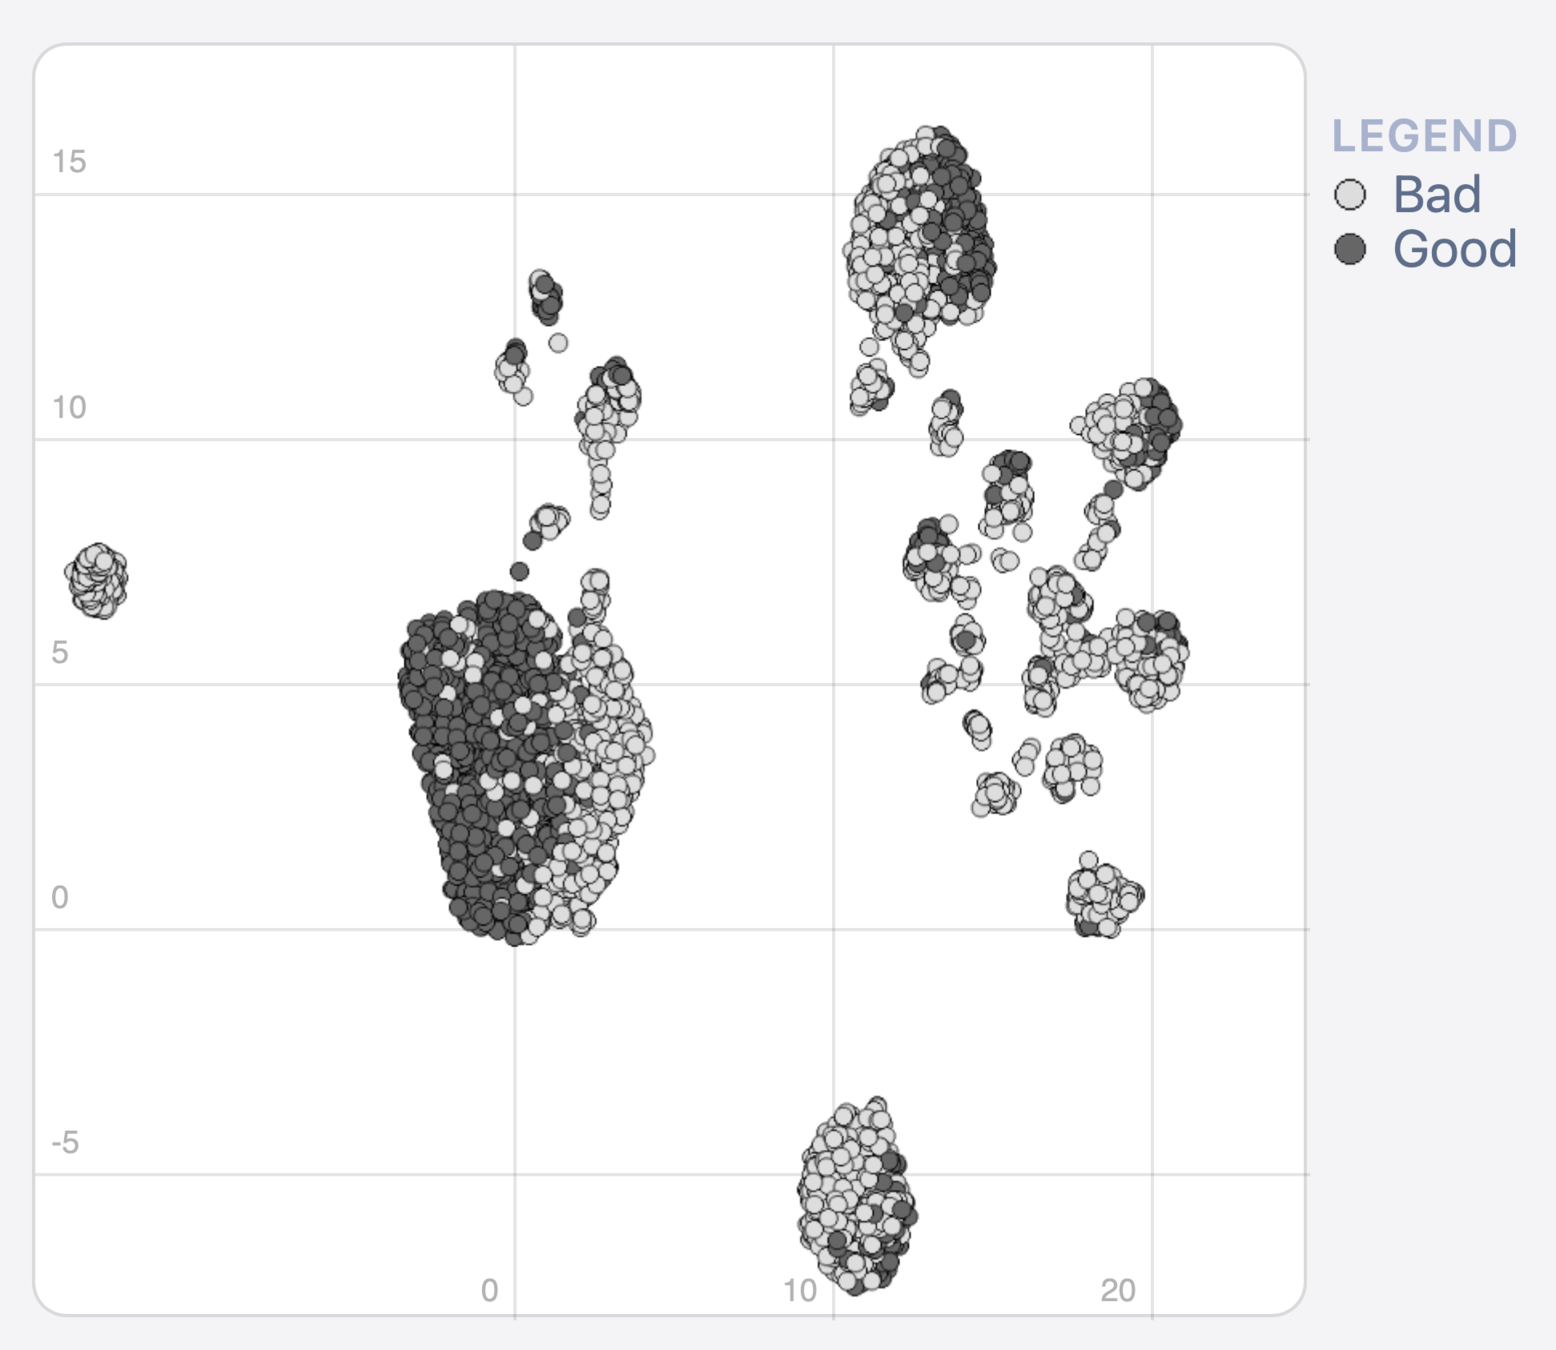
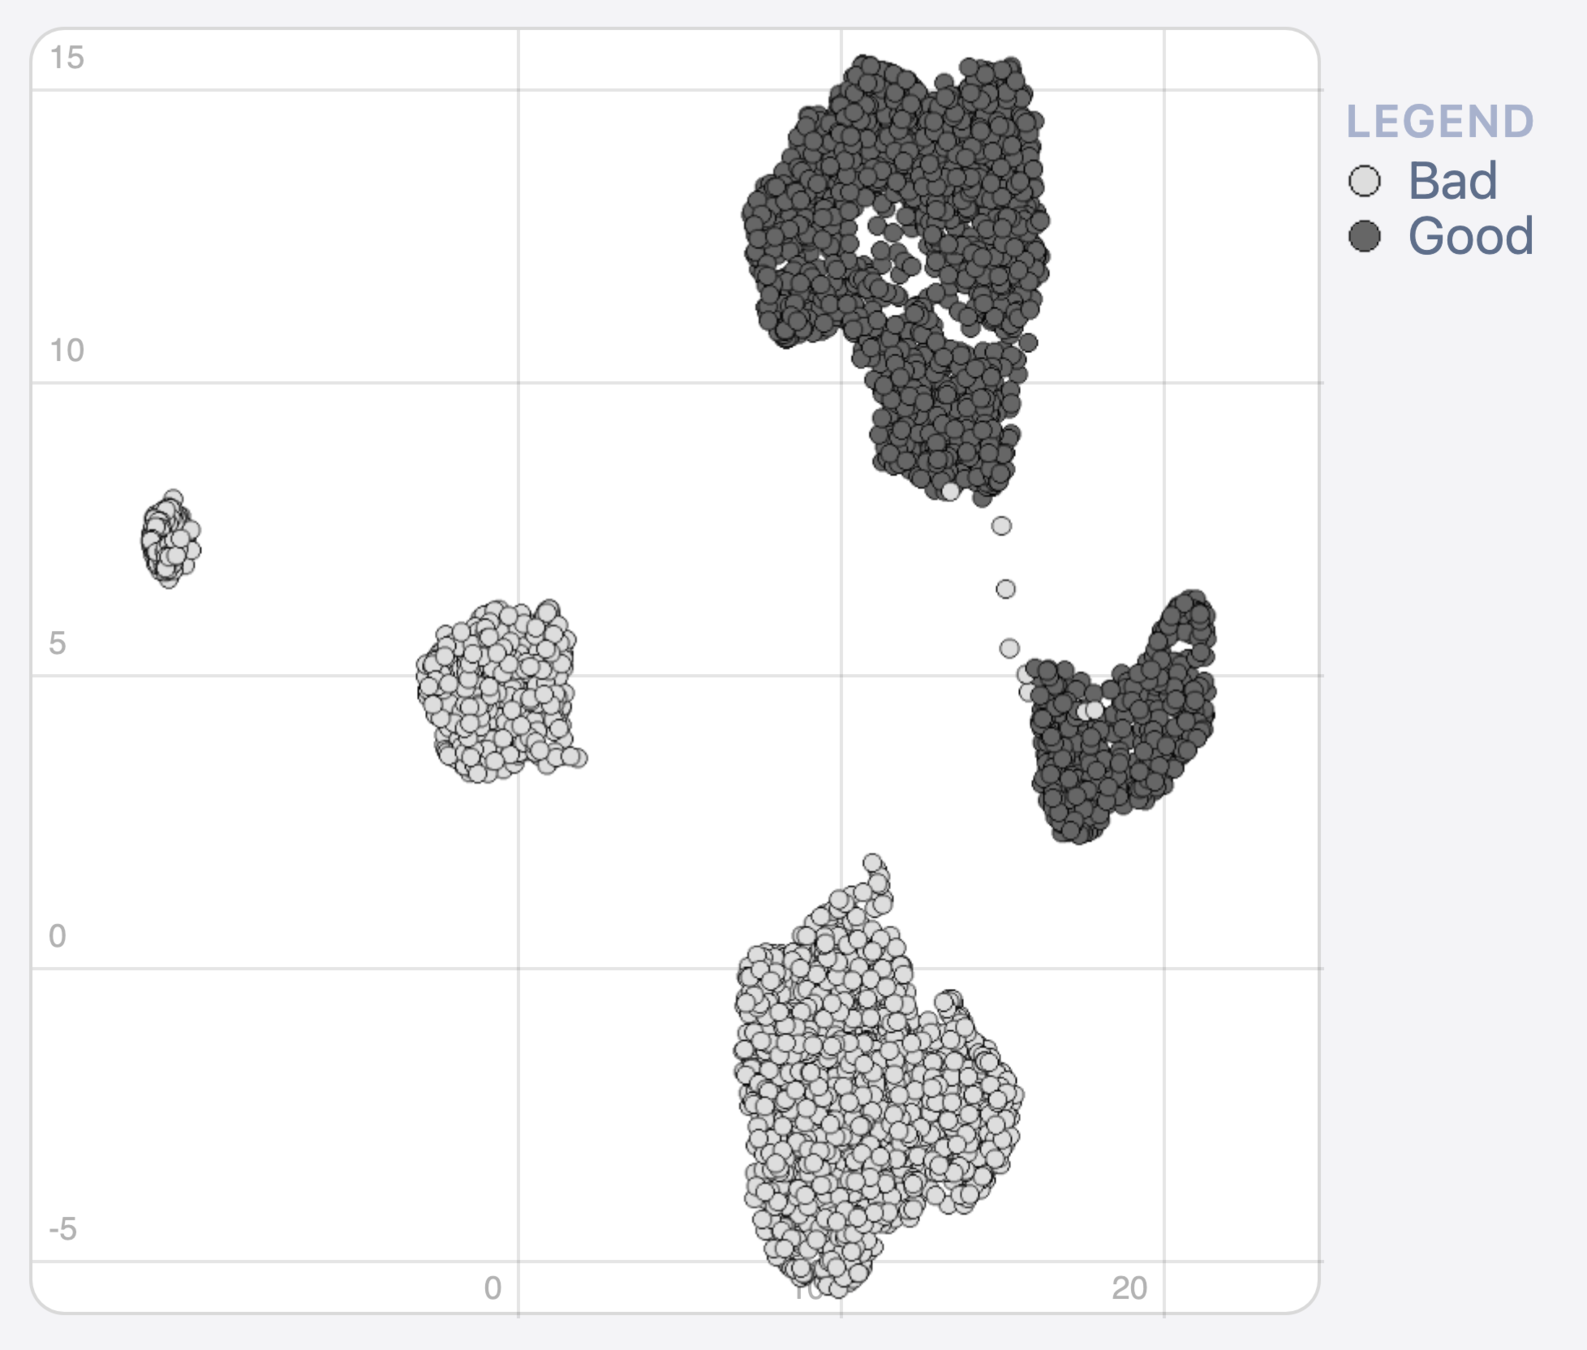
feature contribution (LIME)
STRATEGYATLAS
What?
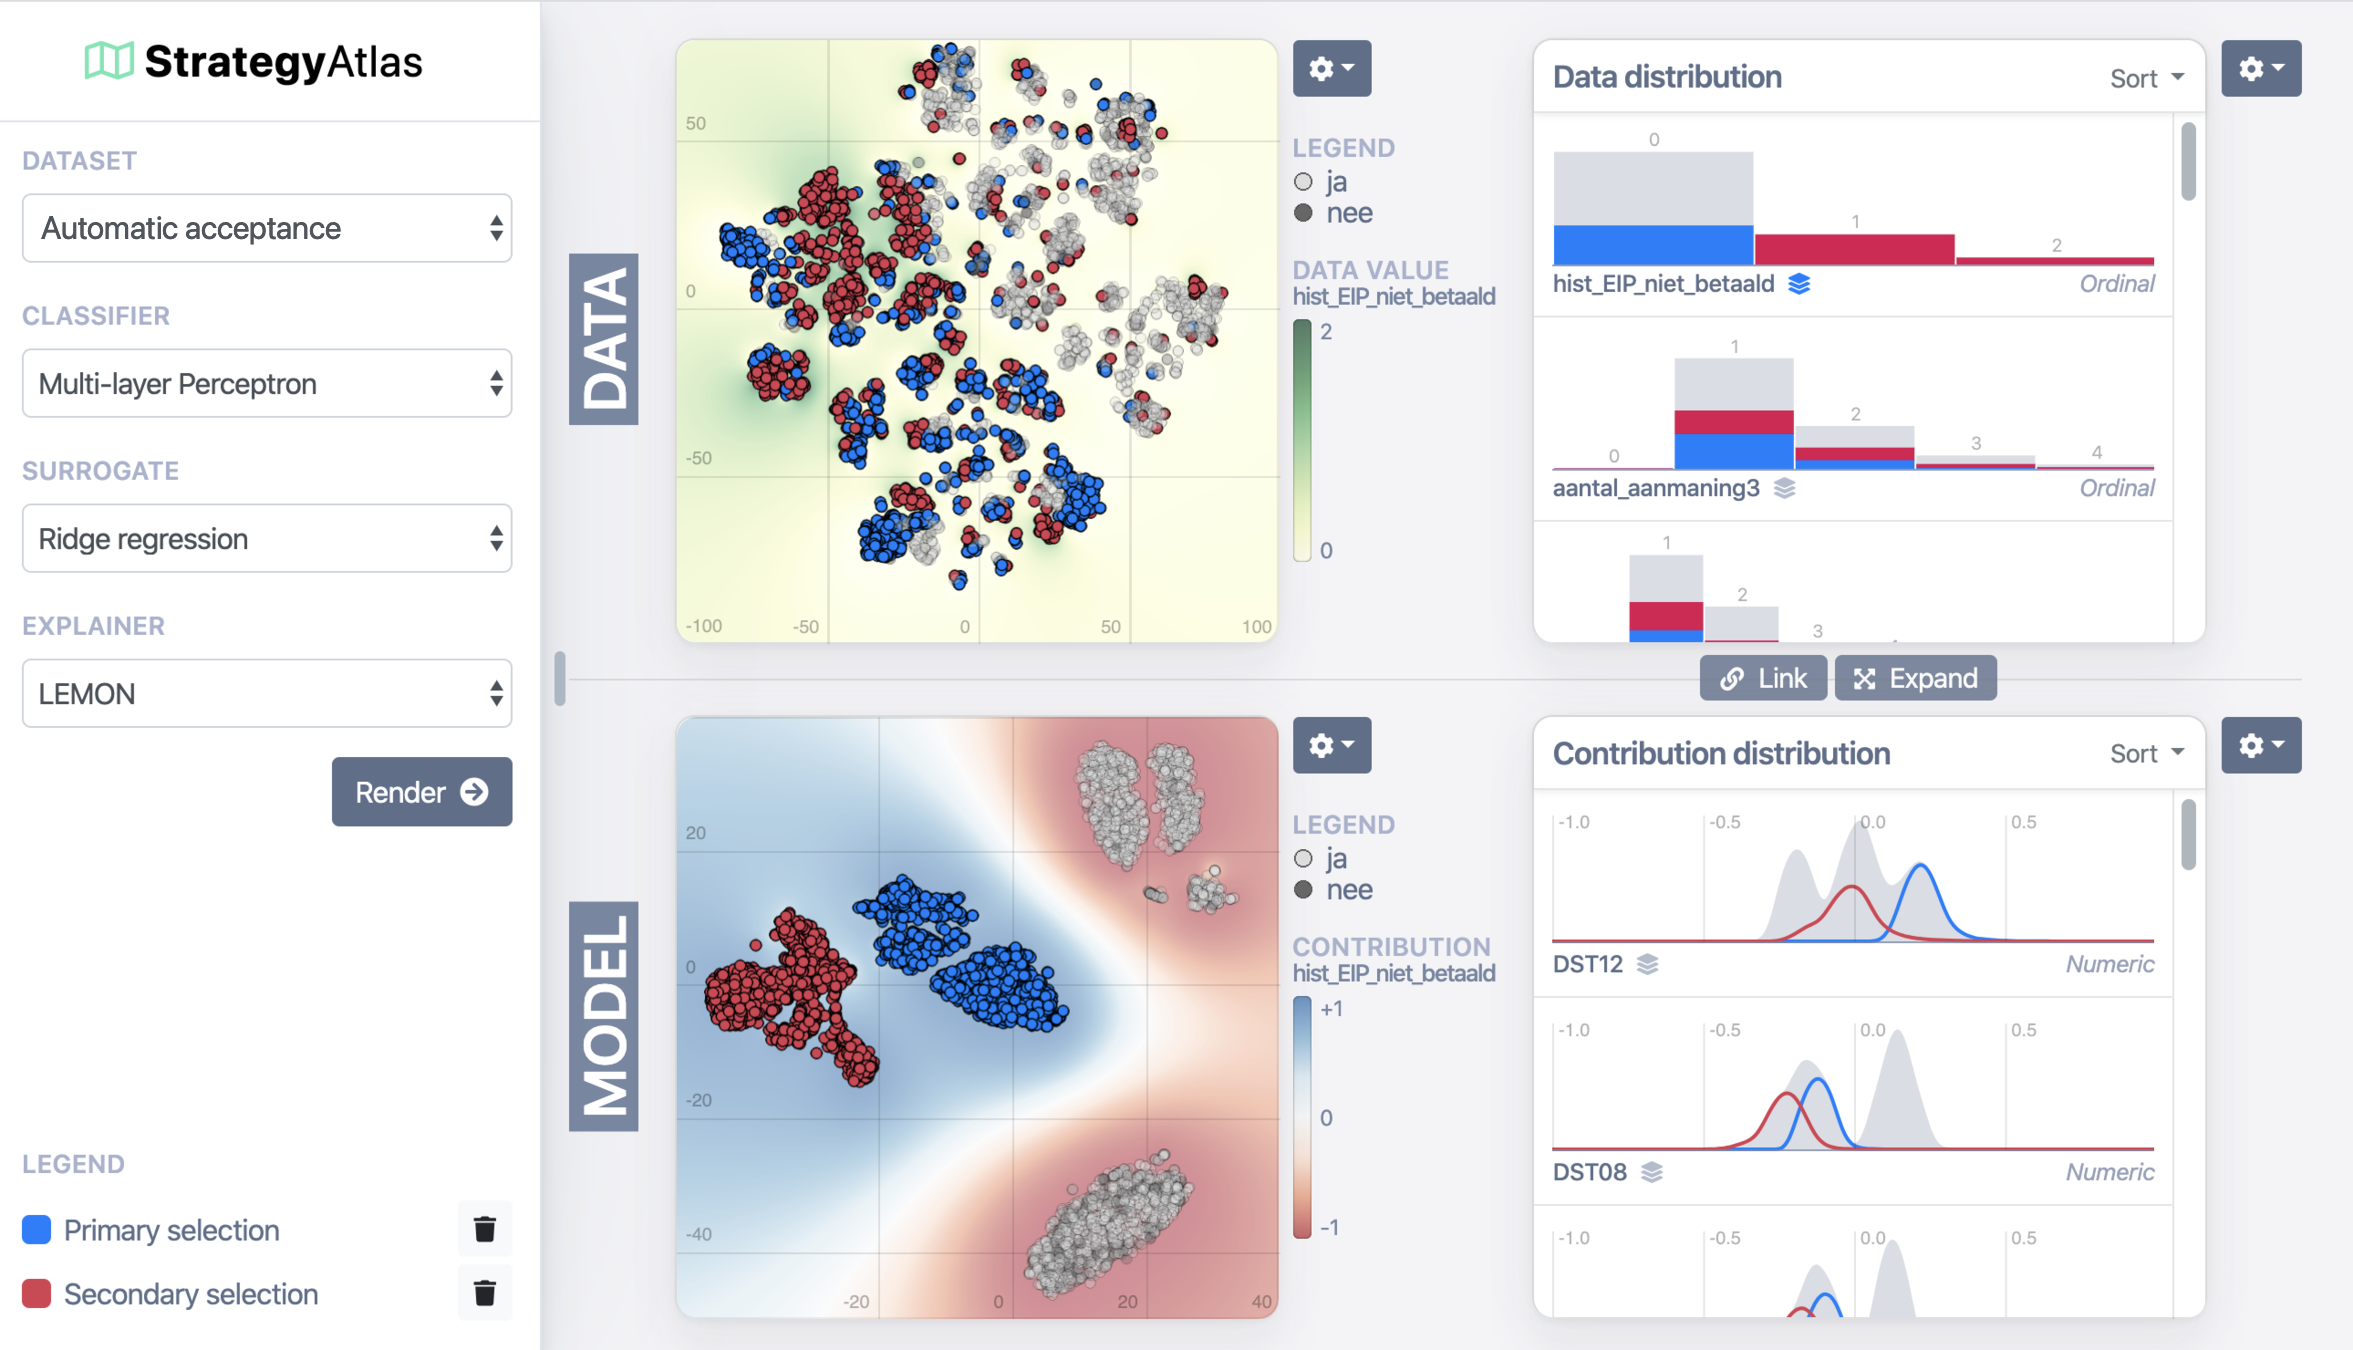
The full interface
STRATEGYATLAS
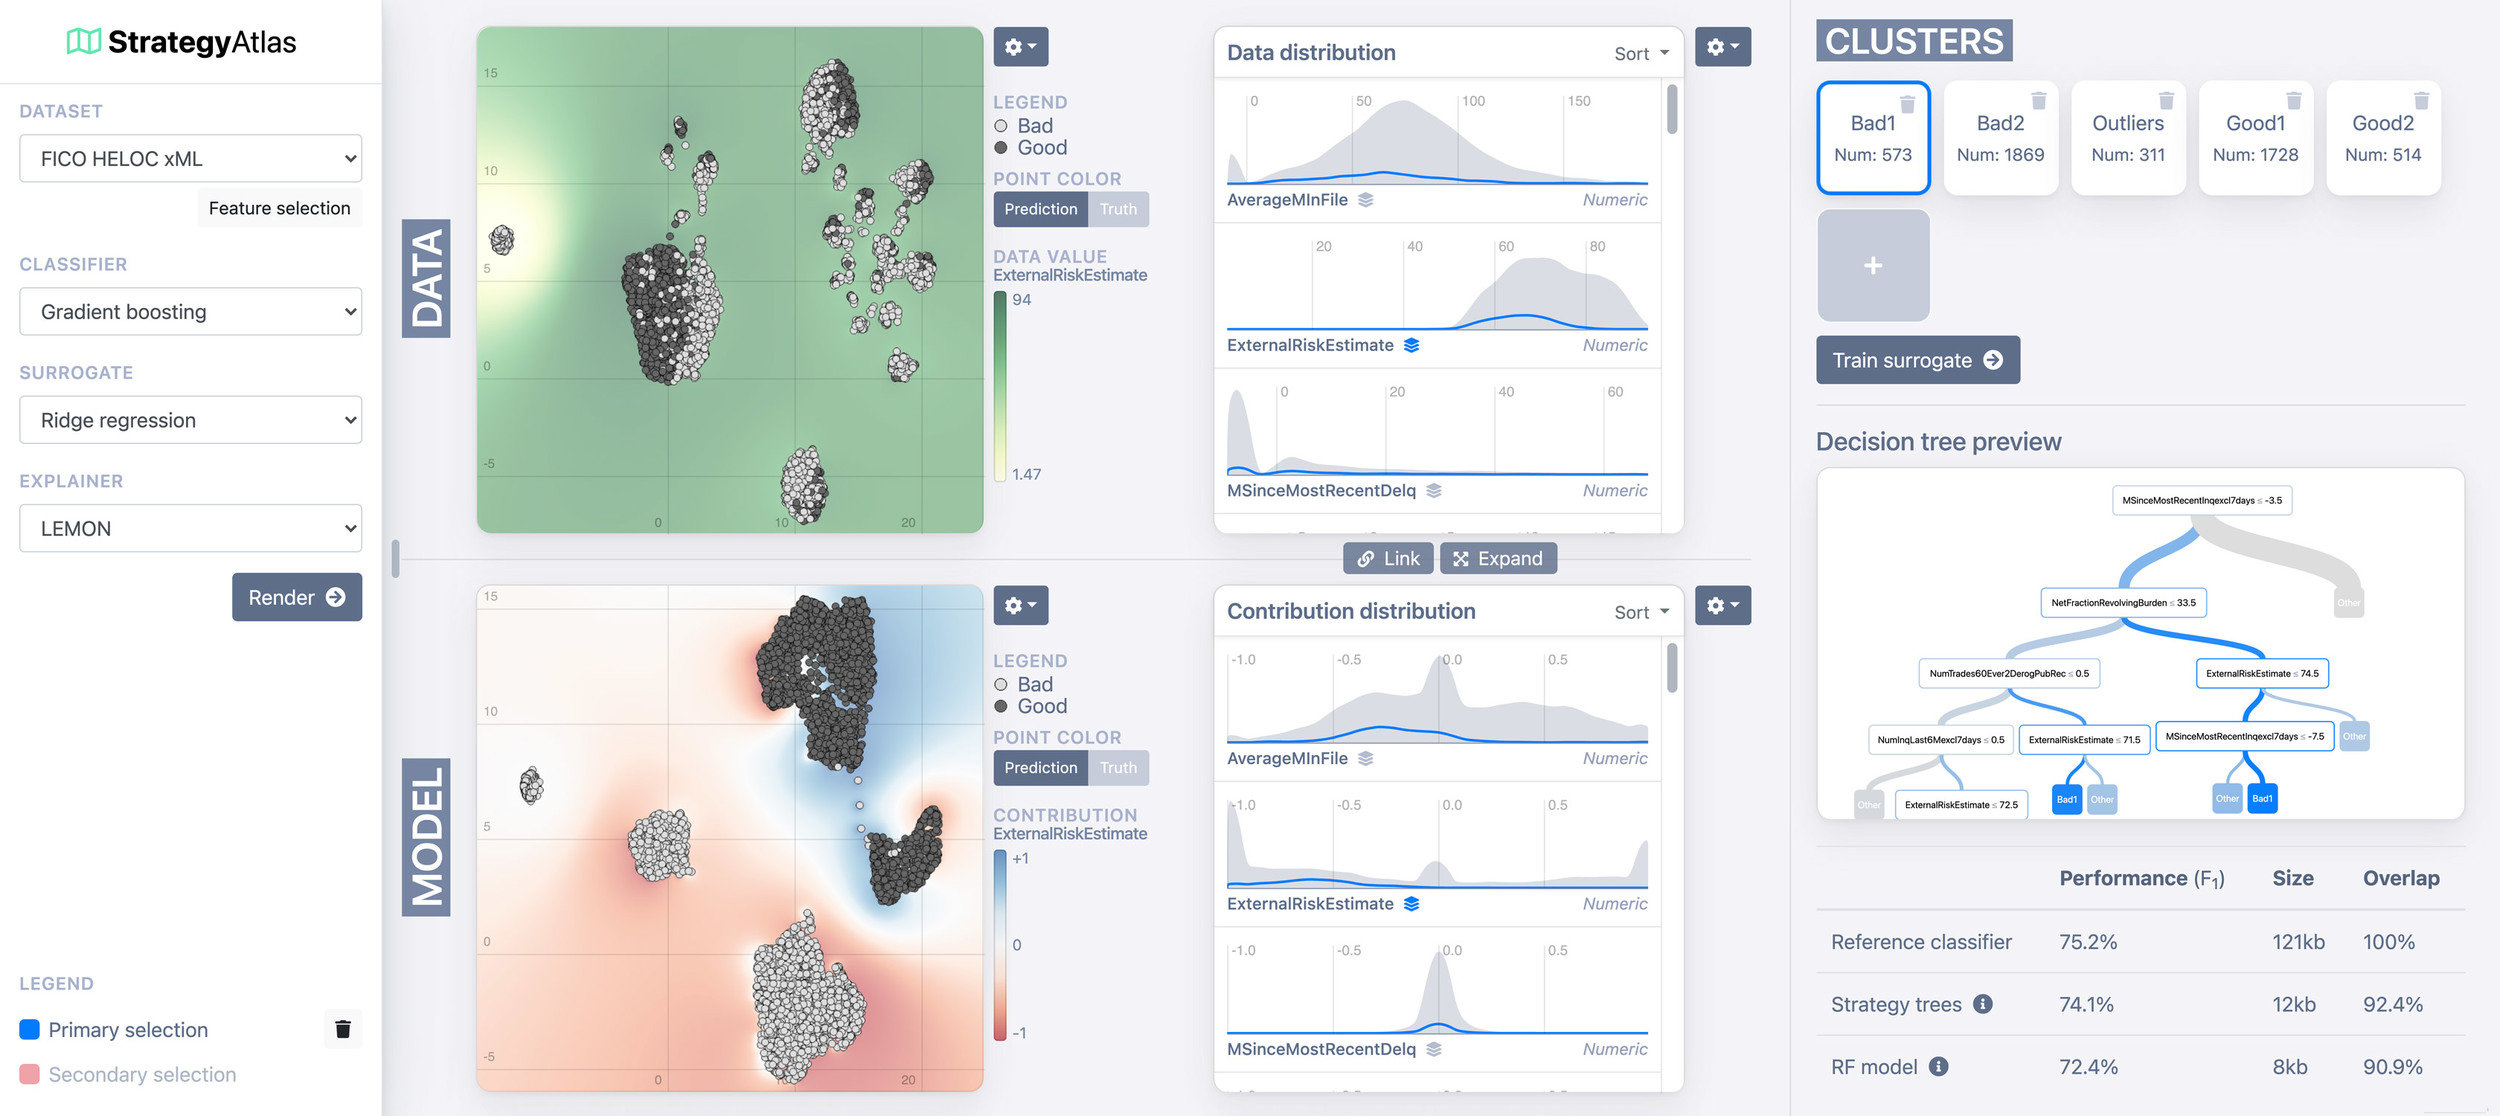
What?
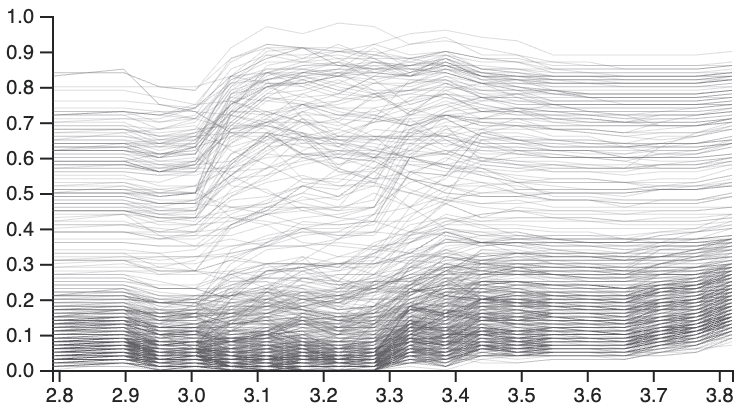
Method 1: Heat map cluster analysis
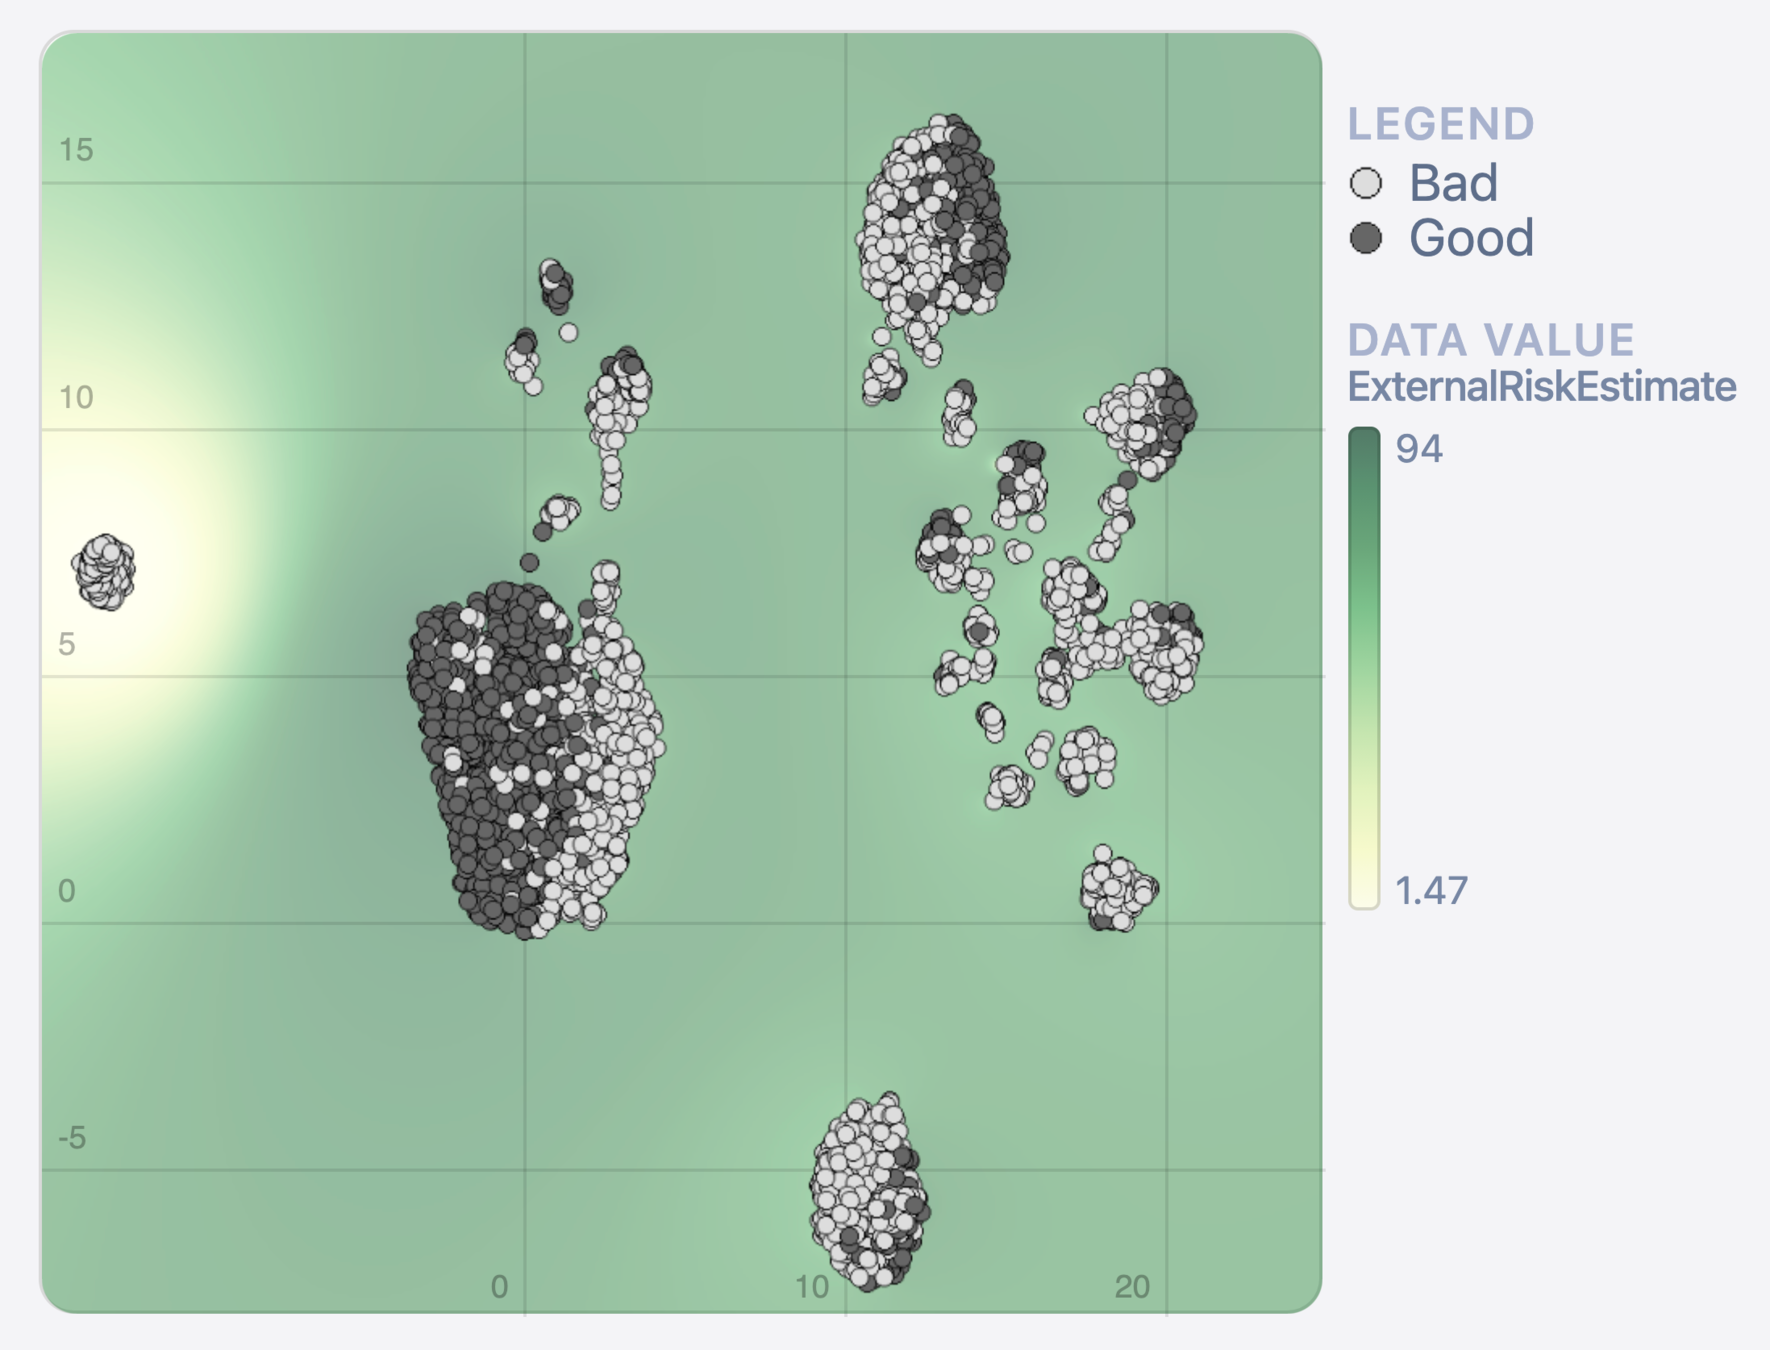
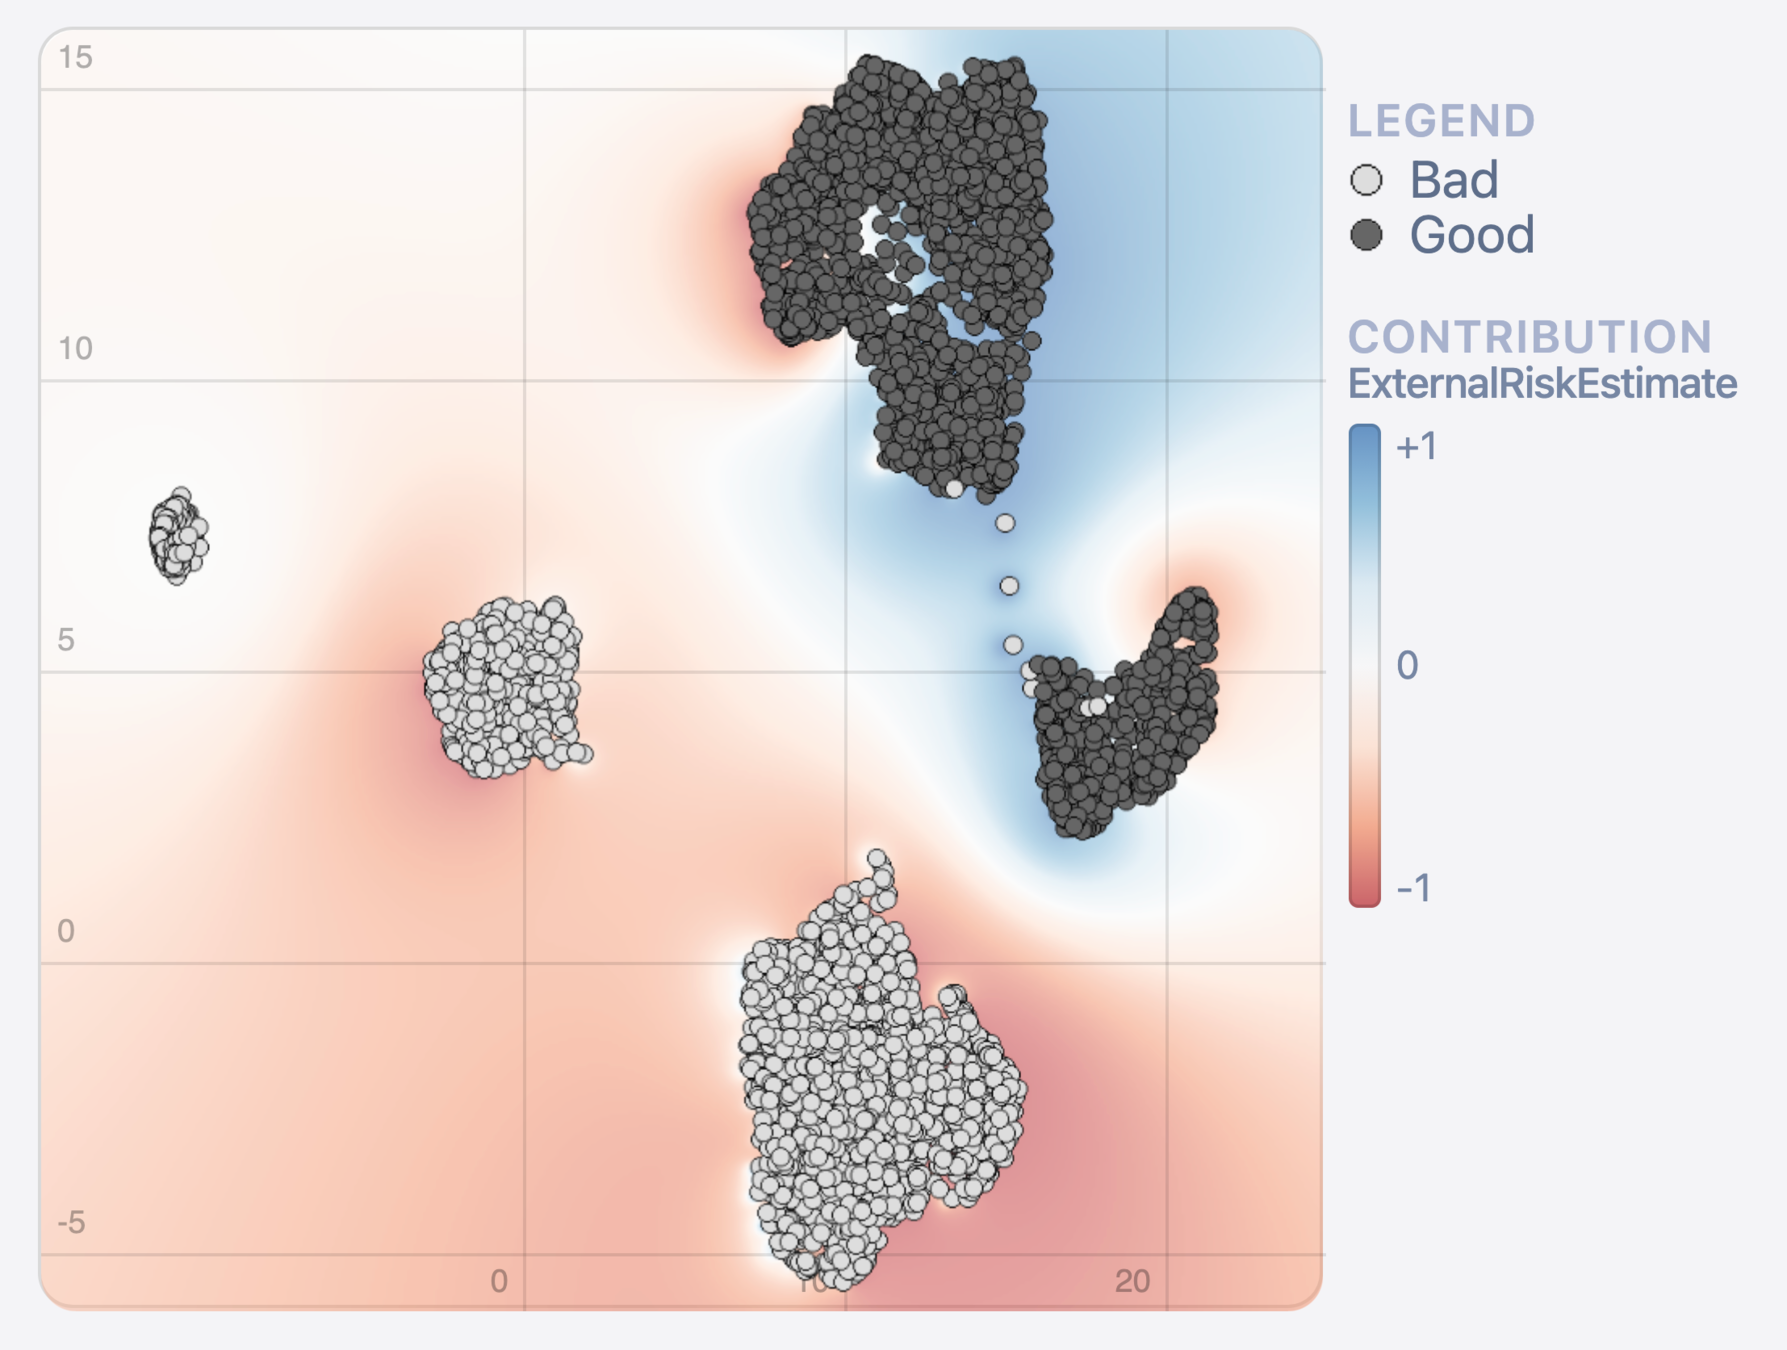
Data
Model
STRATEGYATLAS
What?
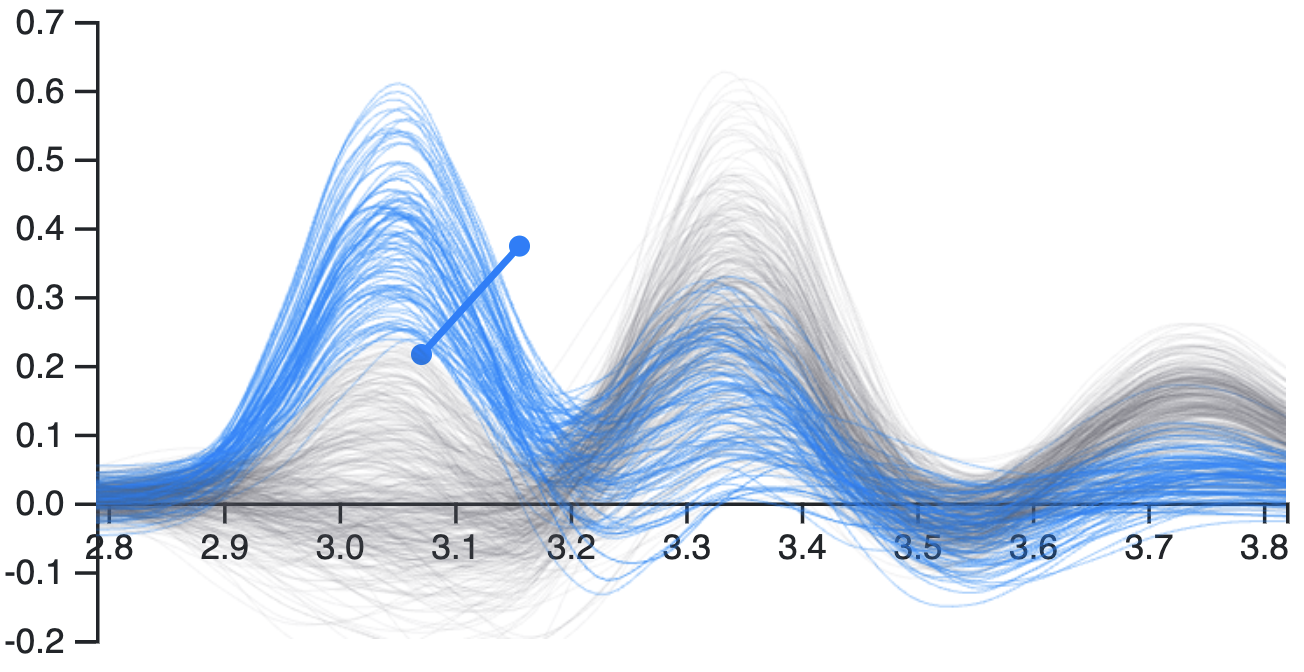
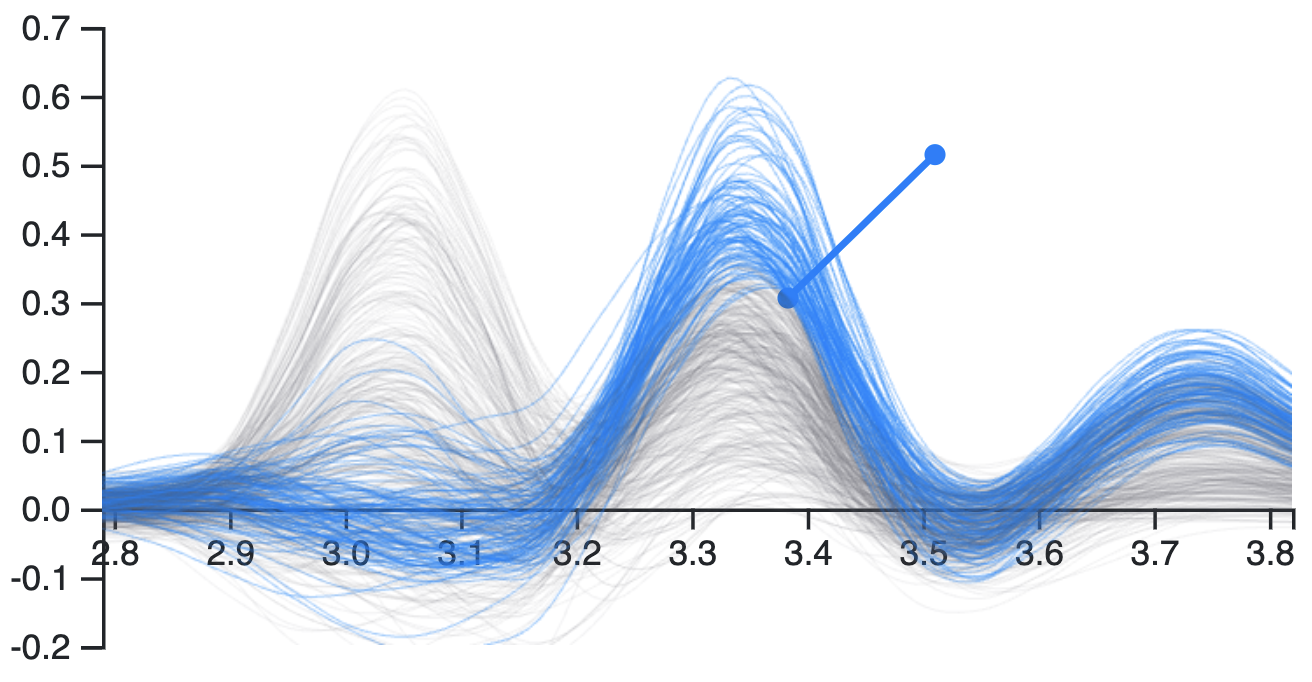
Method 2: Density plots
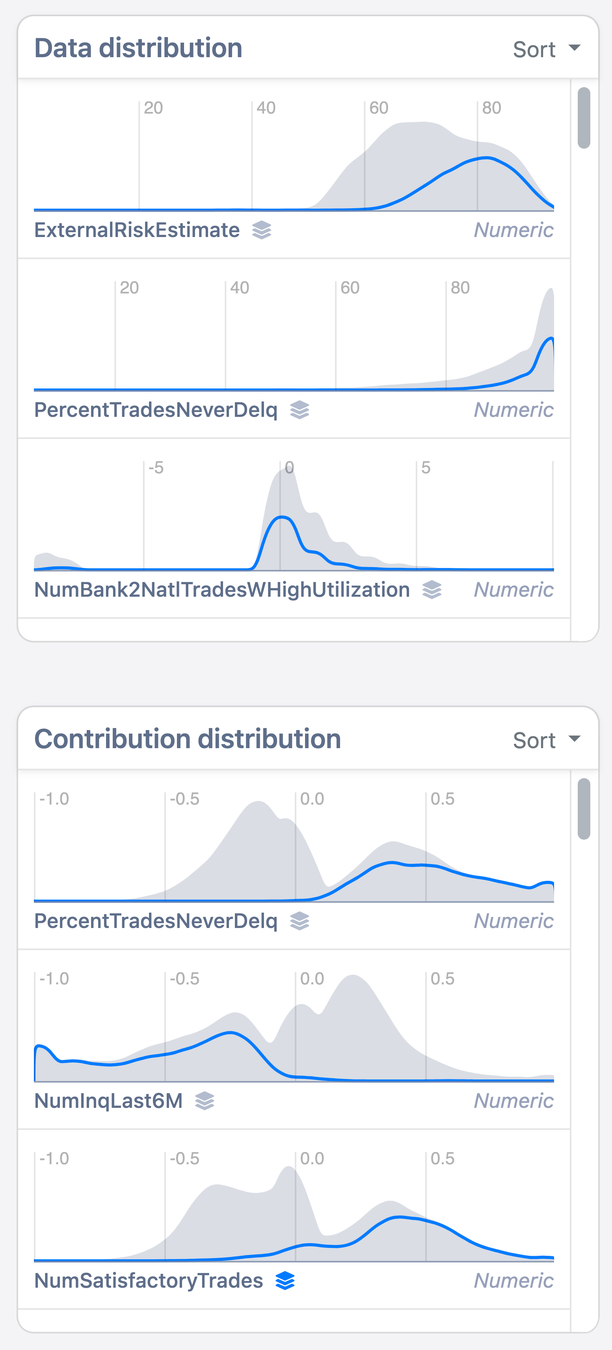
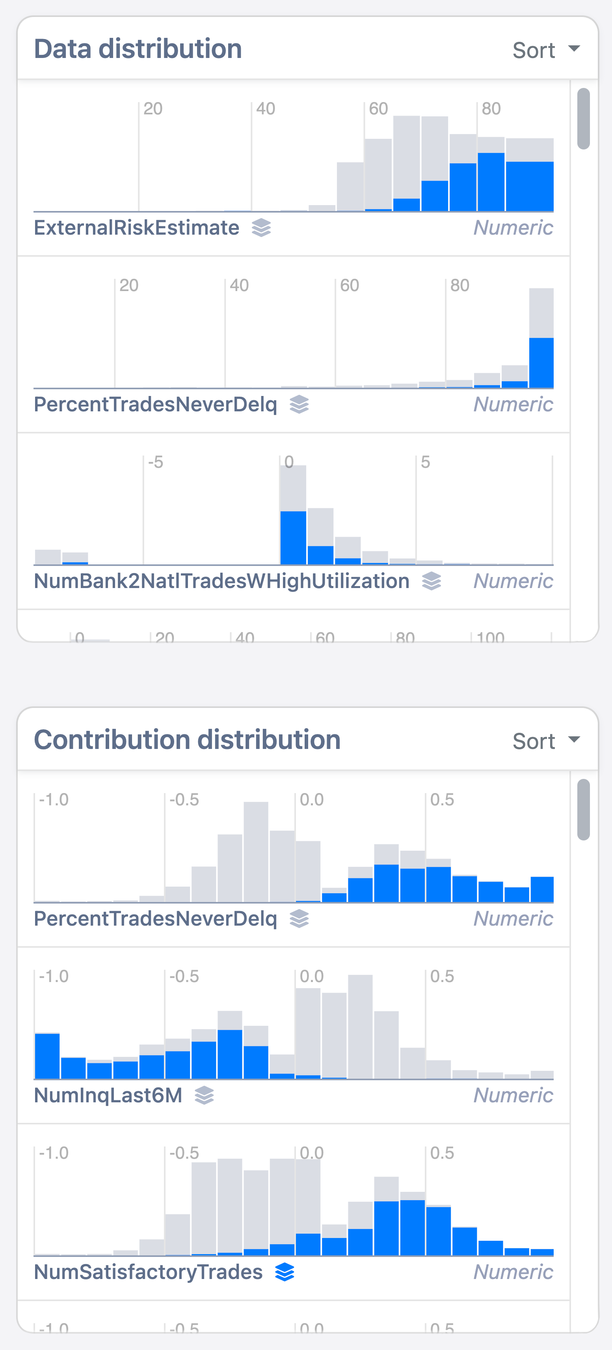
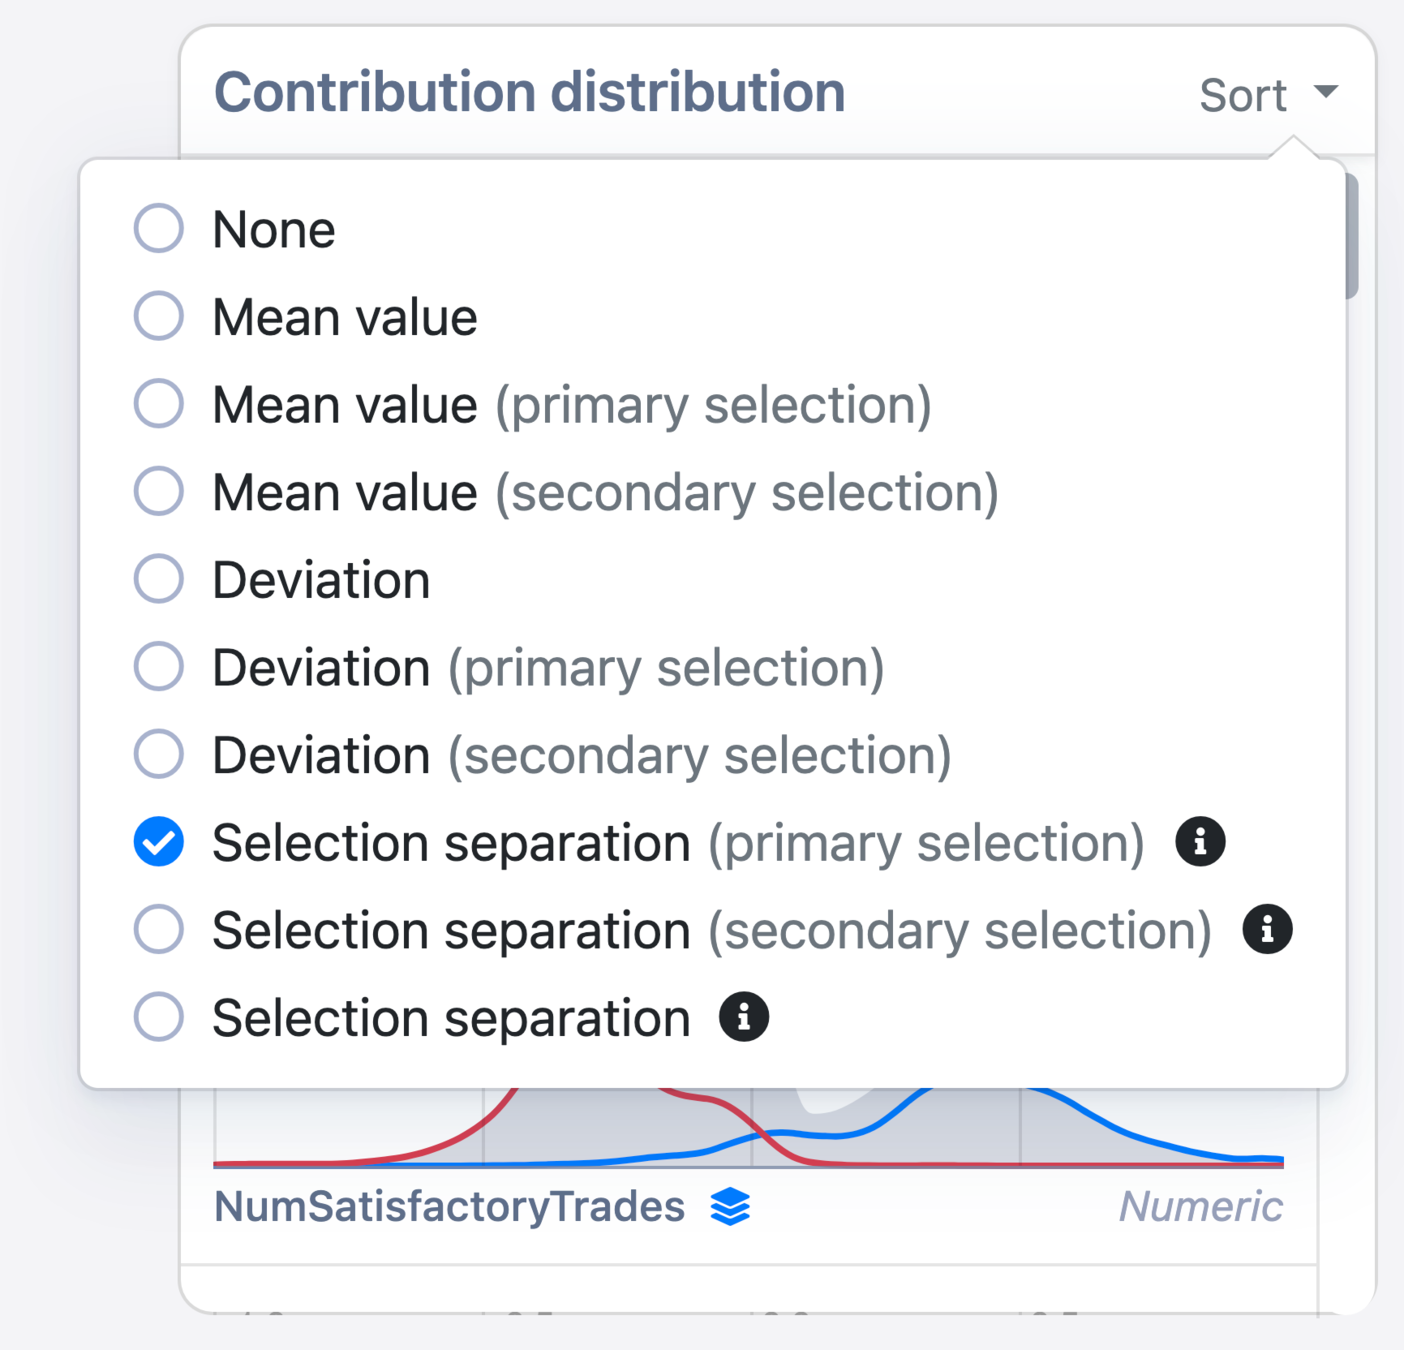
Data
Model
All data
Selection
STRATEGYATLAS
What?
Method 3: Decision trees
Saved clusters →
DT for selected cluster →
Performance comparison →
STRATEGYATLAS
STRATEGYATLAS
Questions?
More info at
explaining.ml
Conclusion
Any further questions?
More info at
explaining.ml
PMML library
bit.ly/sklearn-pmml
Local
Global
ExplainExplore
CV Plots
StrategyAtlas