Visualization for Explainable AI
Teamoverleg — 18 oktober

Dennis Collaris
PhD Visualization

Data
Black
Box
Subject
80% risk
Why?
ML is often applied as a black box.
Global
Local
Overview
Global
Local
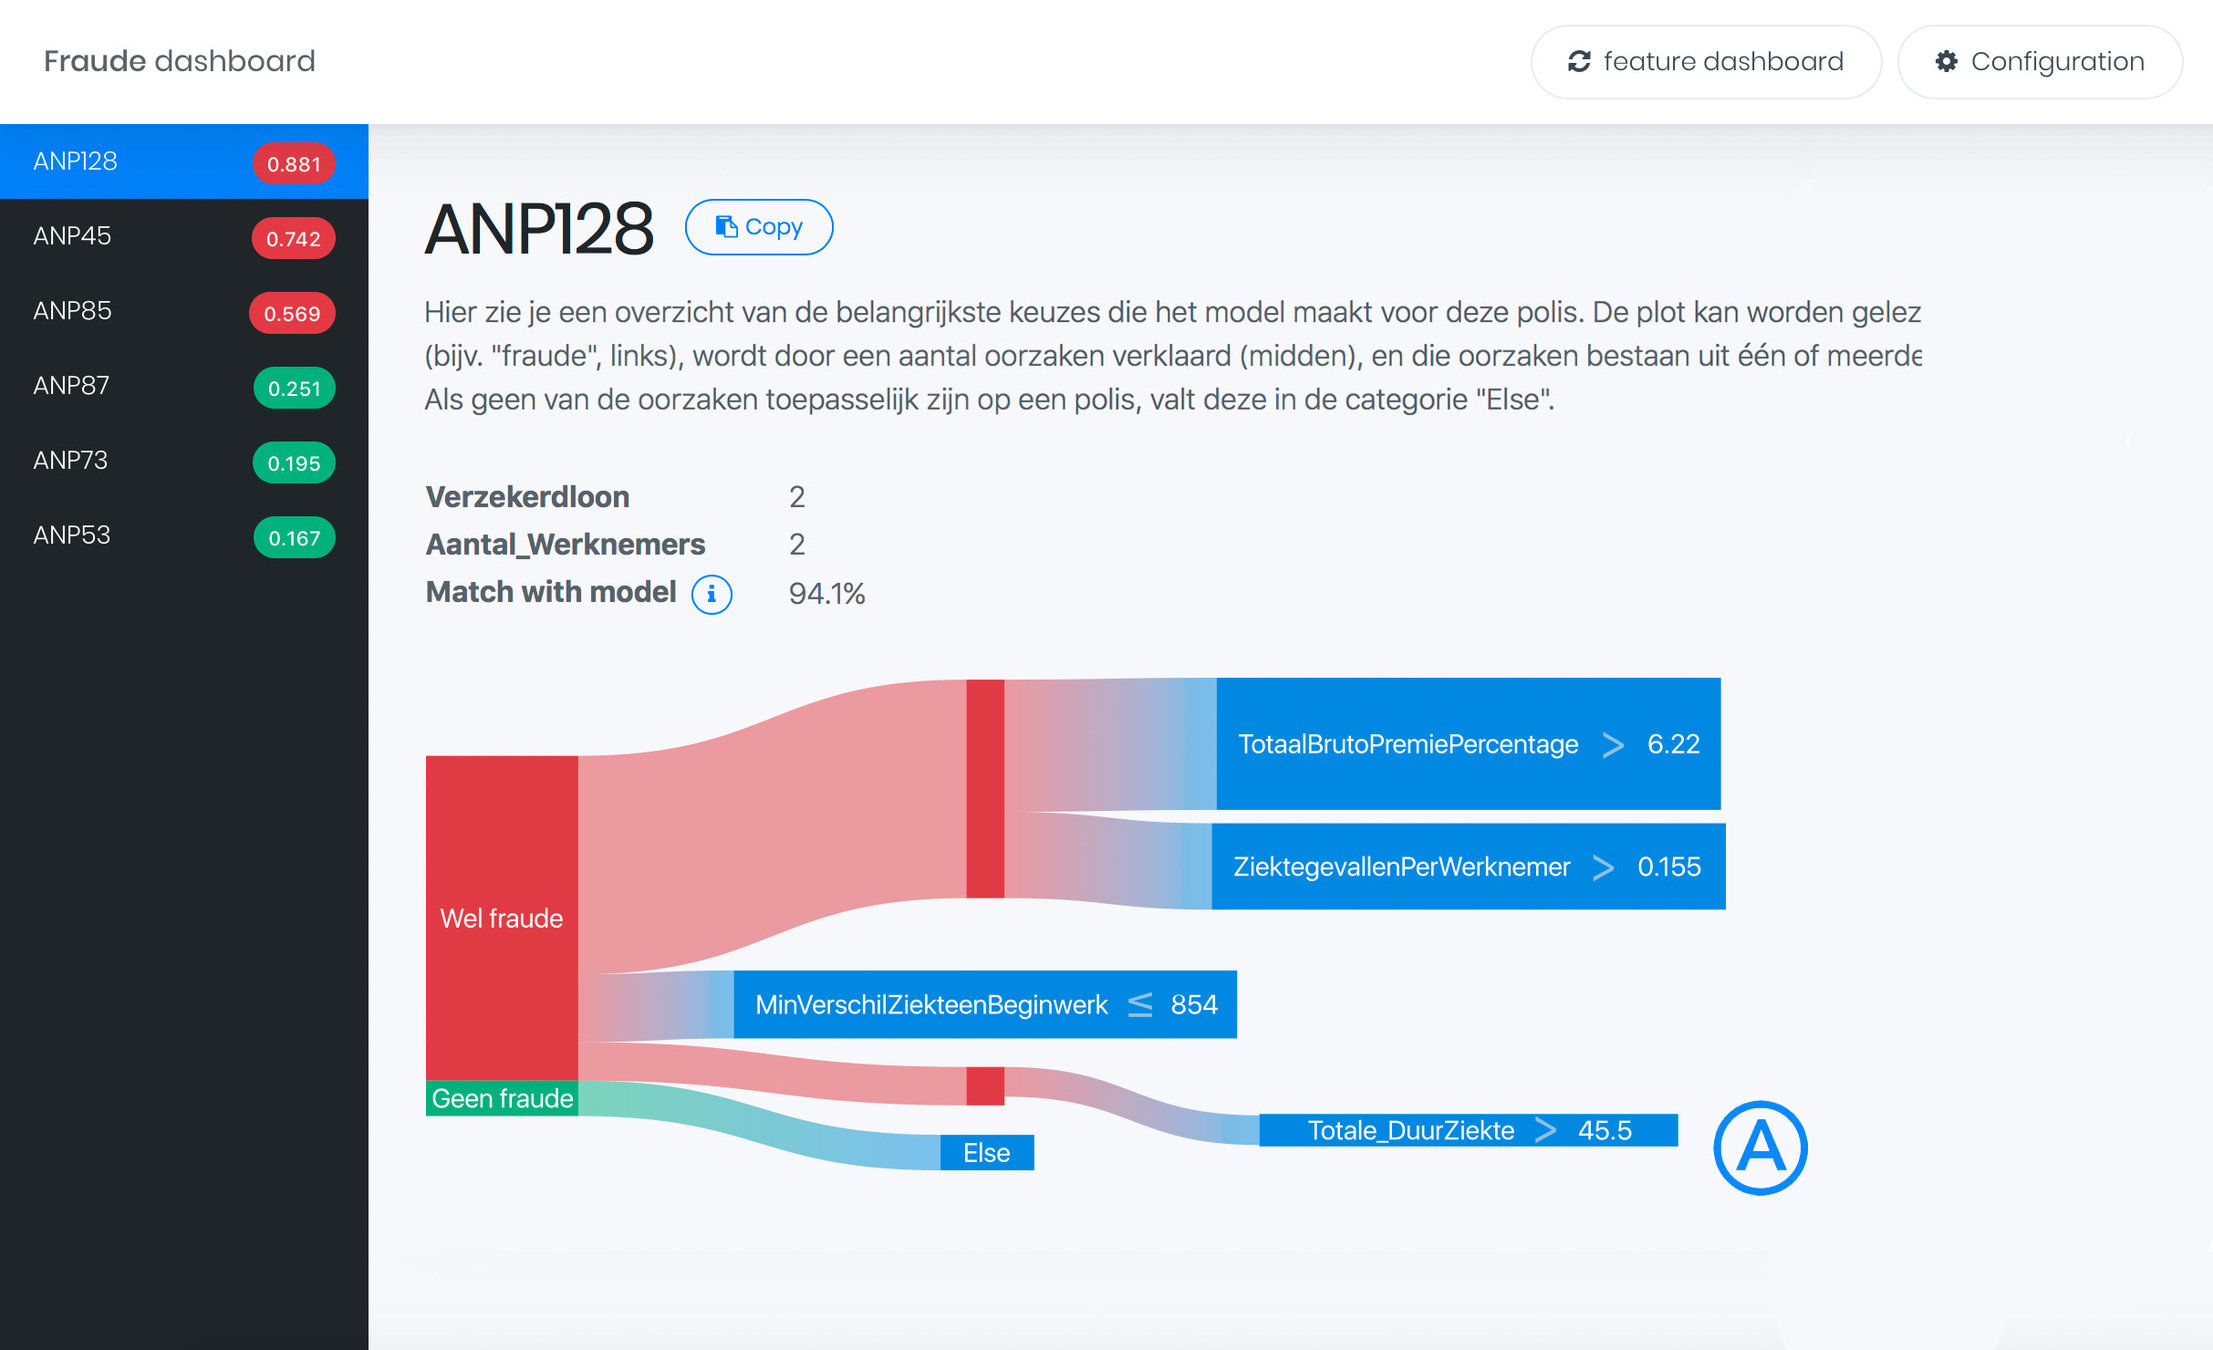
Fraud Dashboard
Overview
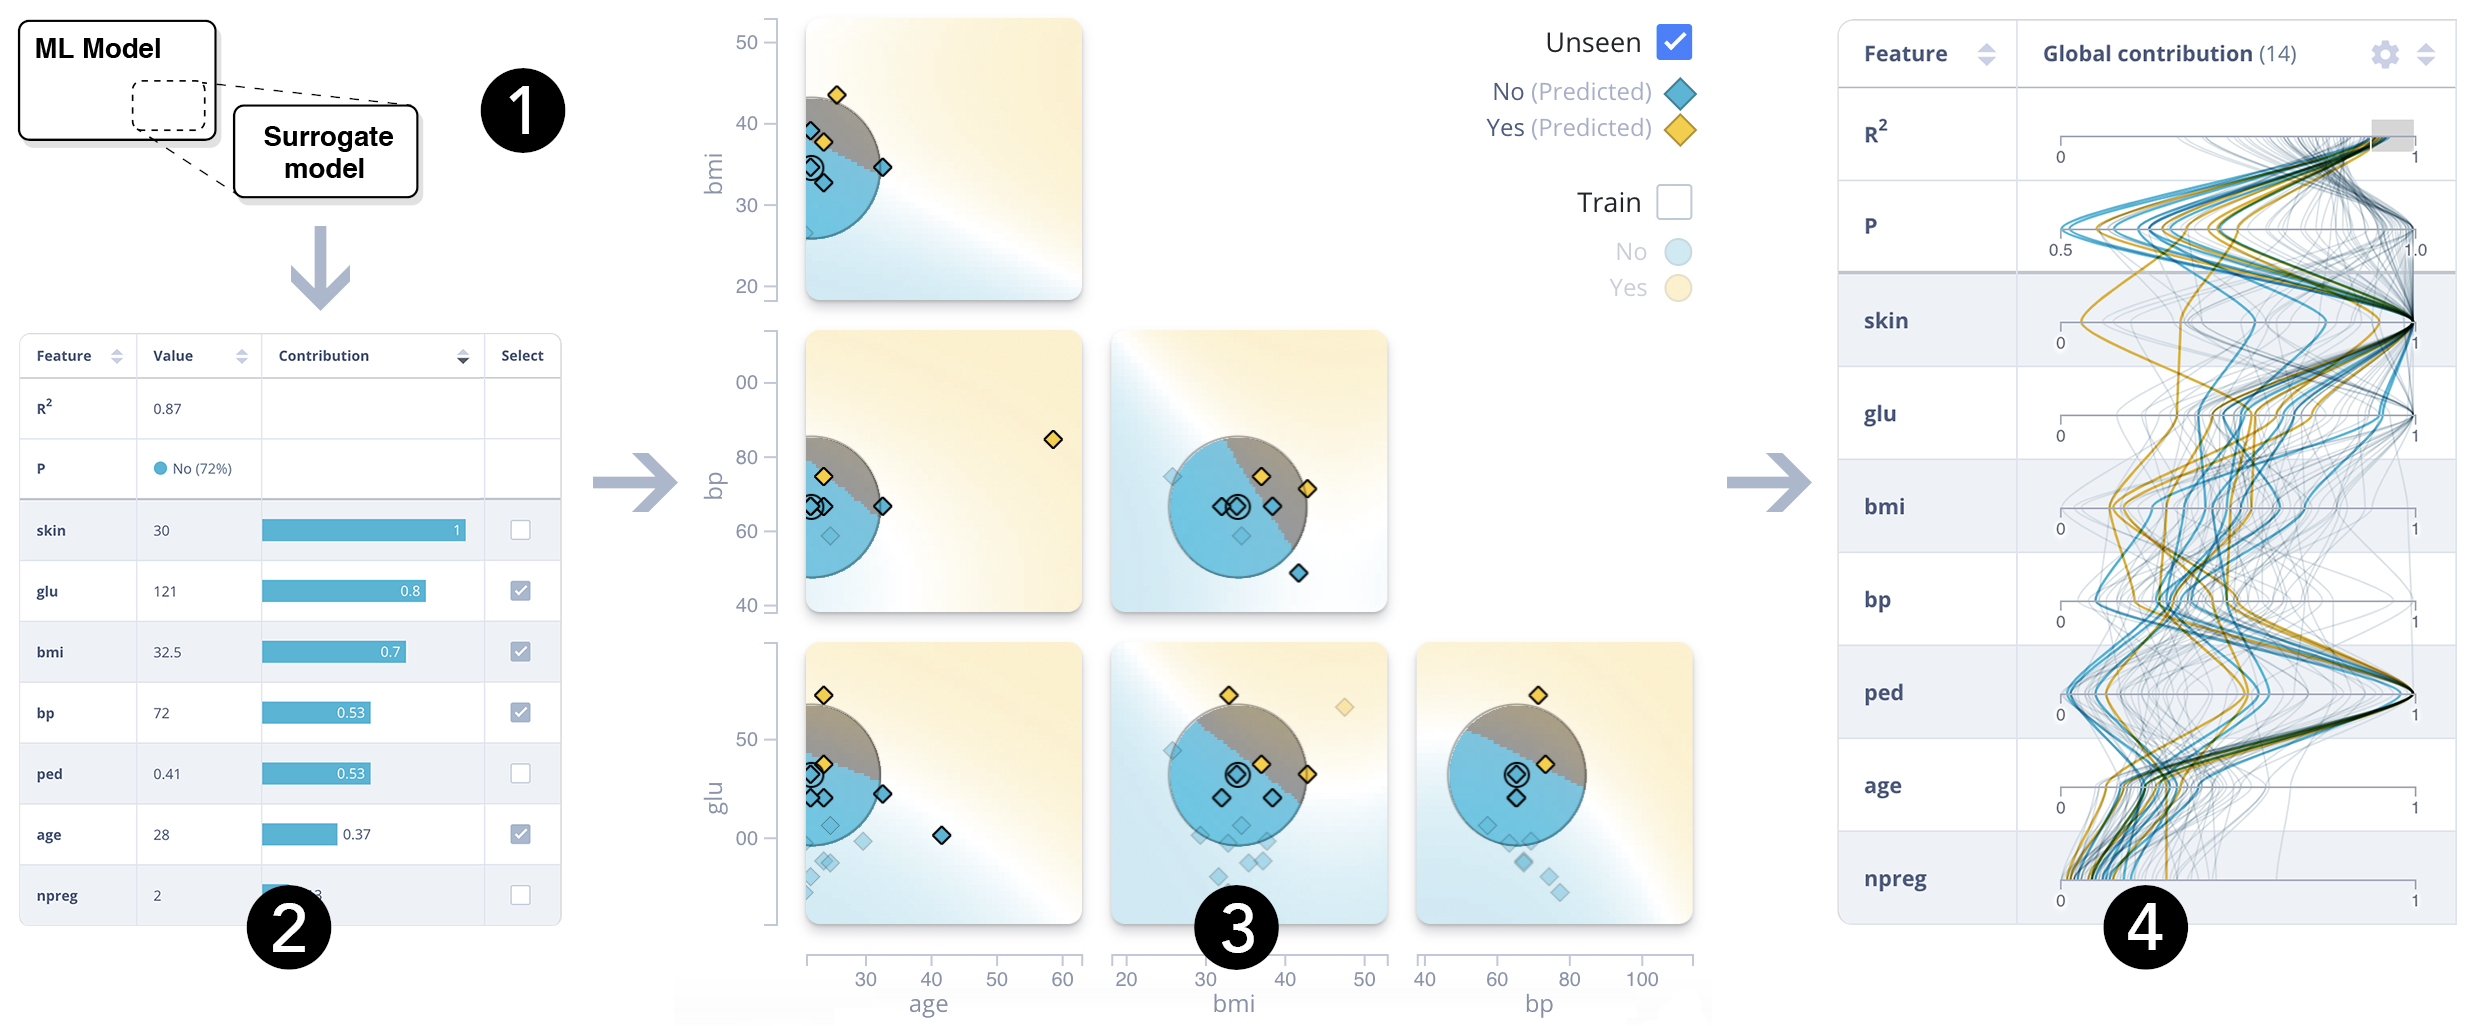
ExplainExplore
Global
Local
Fraud Dashboard
Overview
ExplainExplore
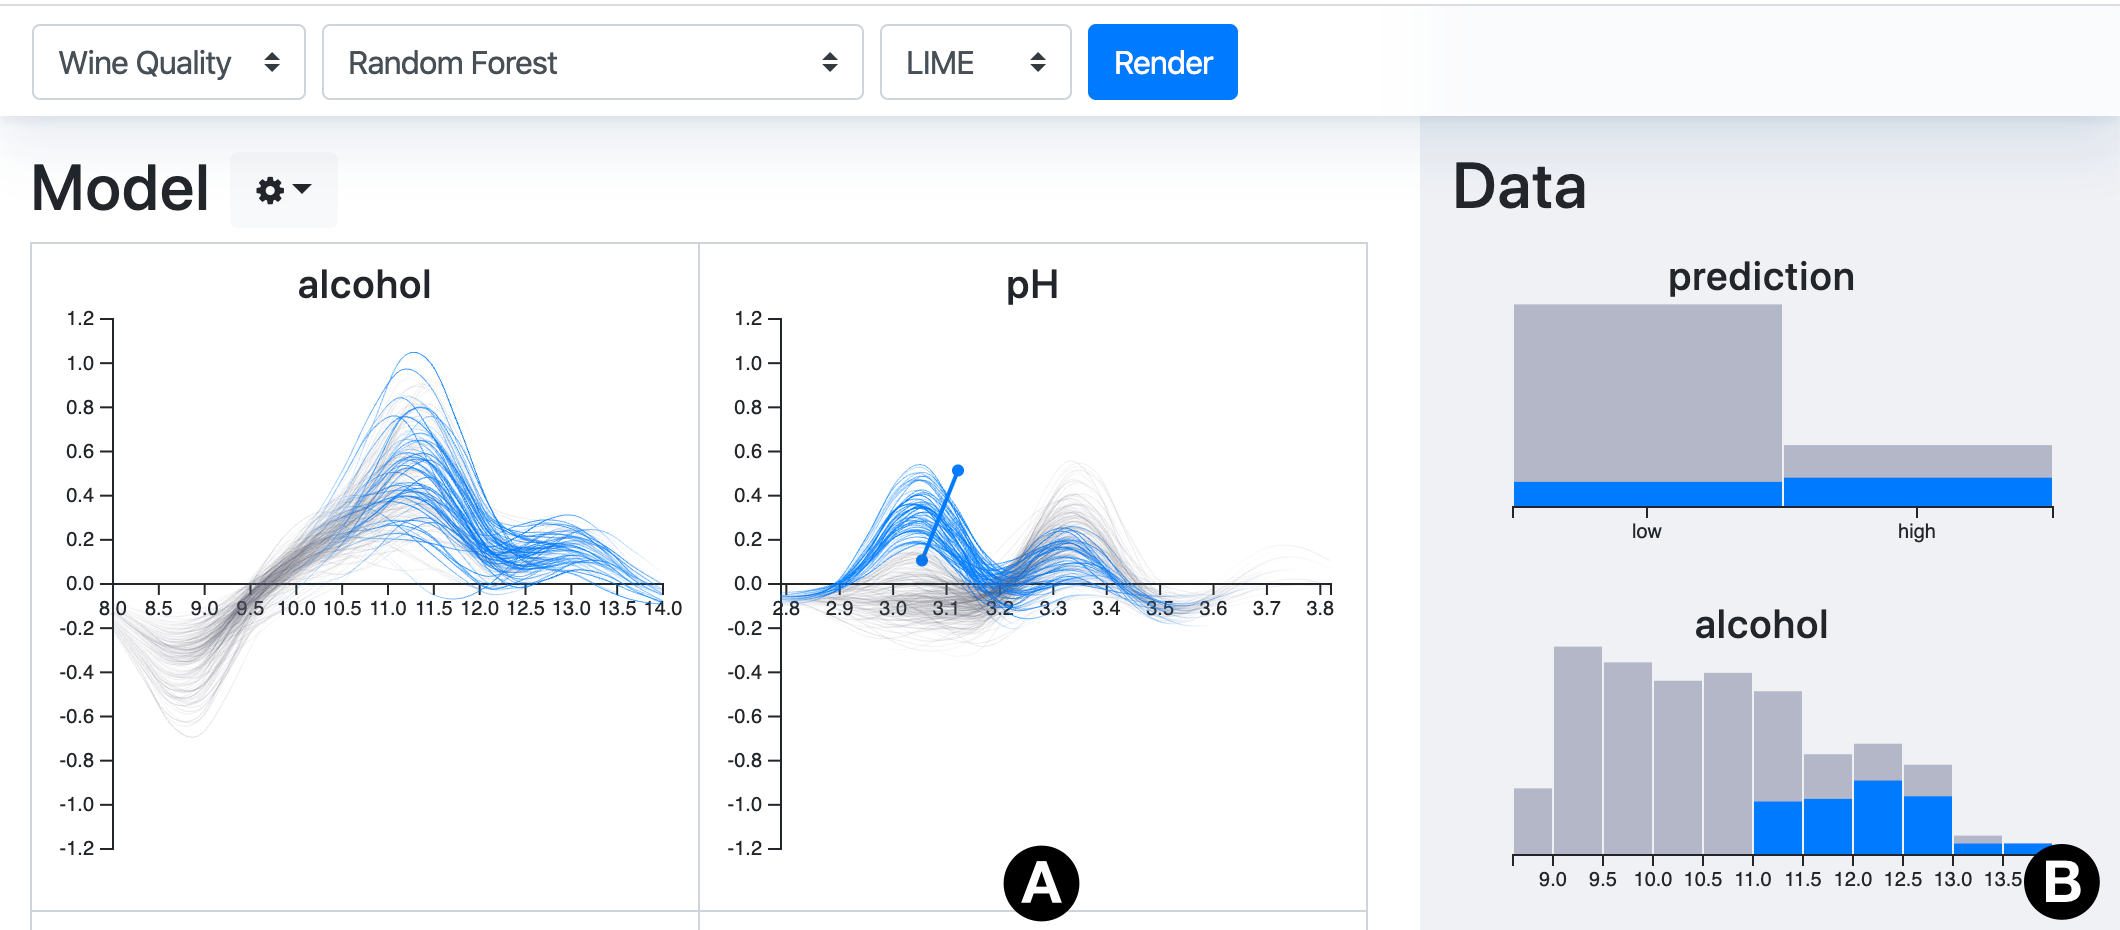
Contribution-Value Plots
Global
Local
Fraud Dashboard
Overview
ExplainExplore
CV Plots
Global
Local
Fraud Dashboard
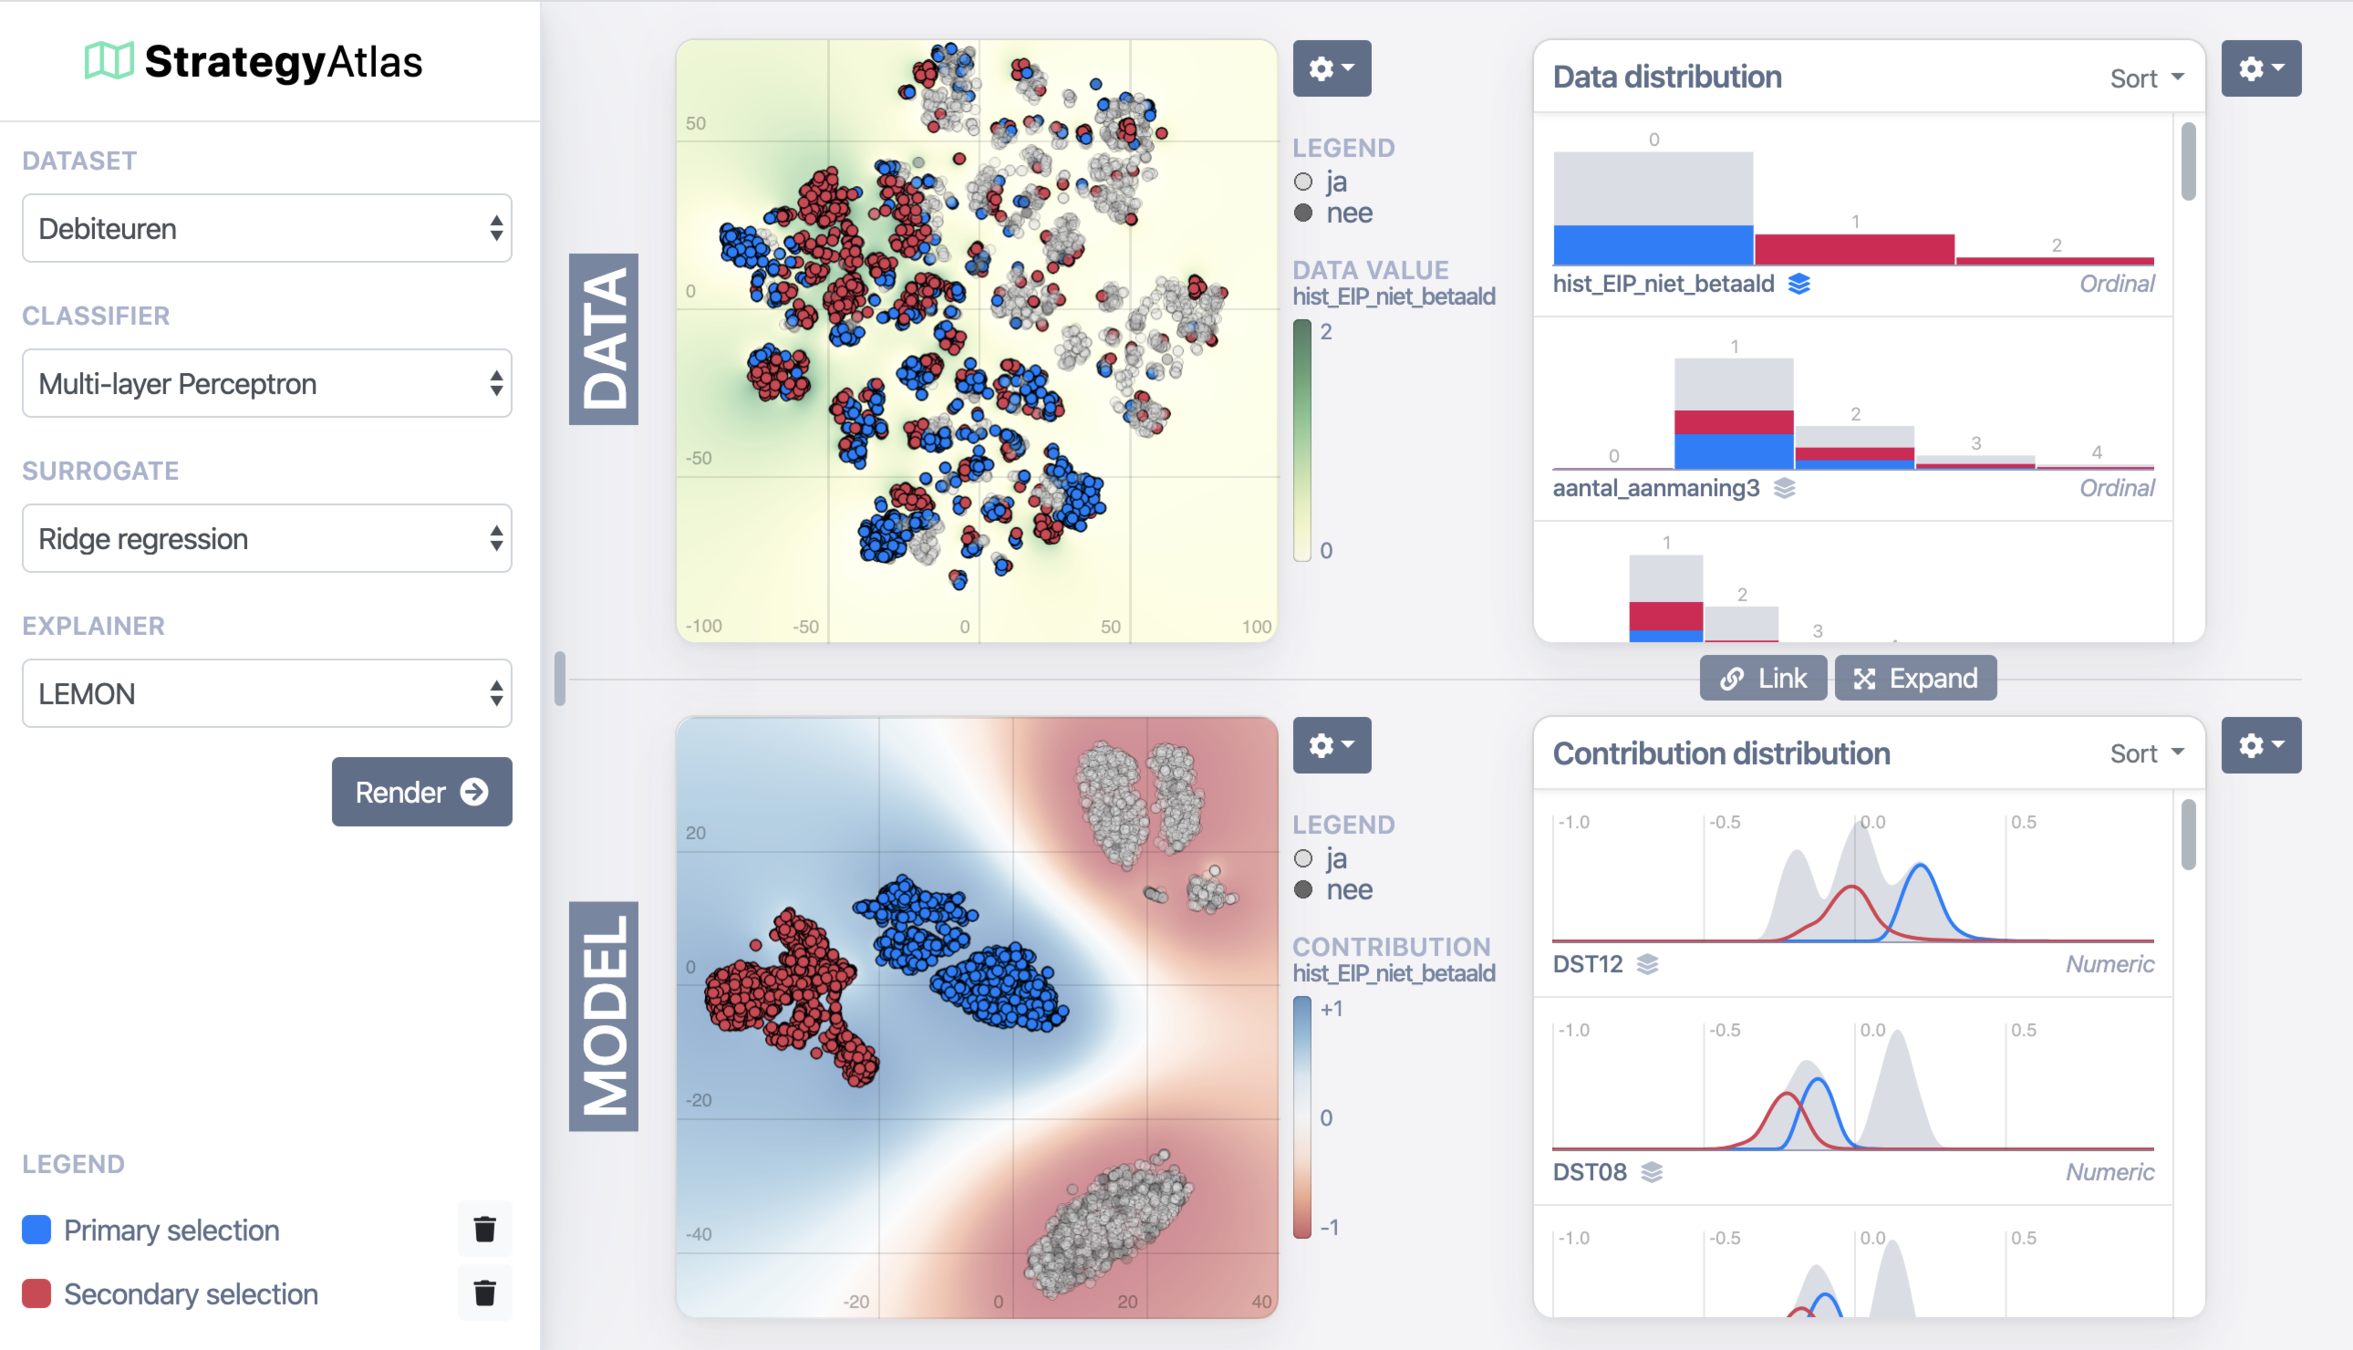
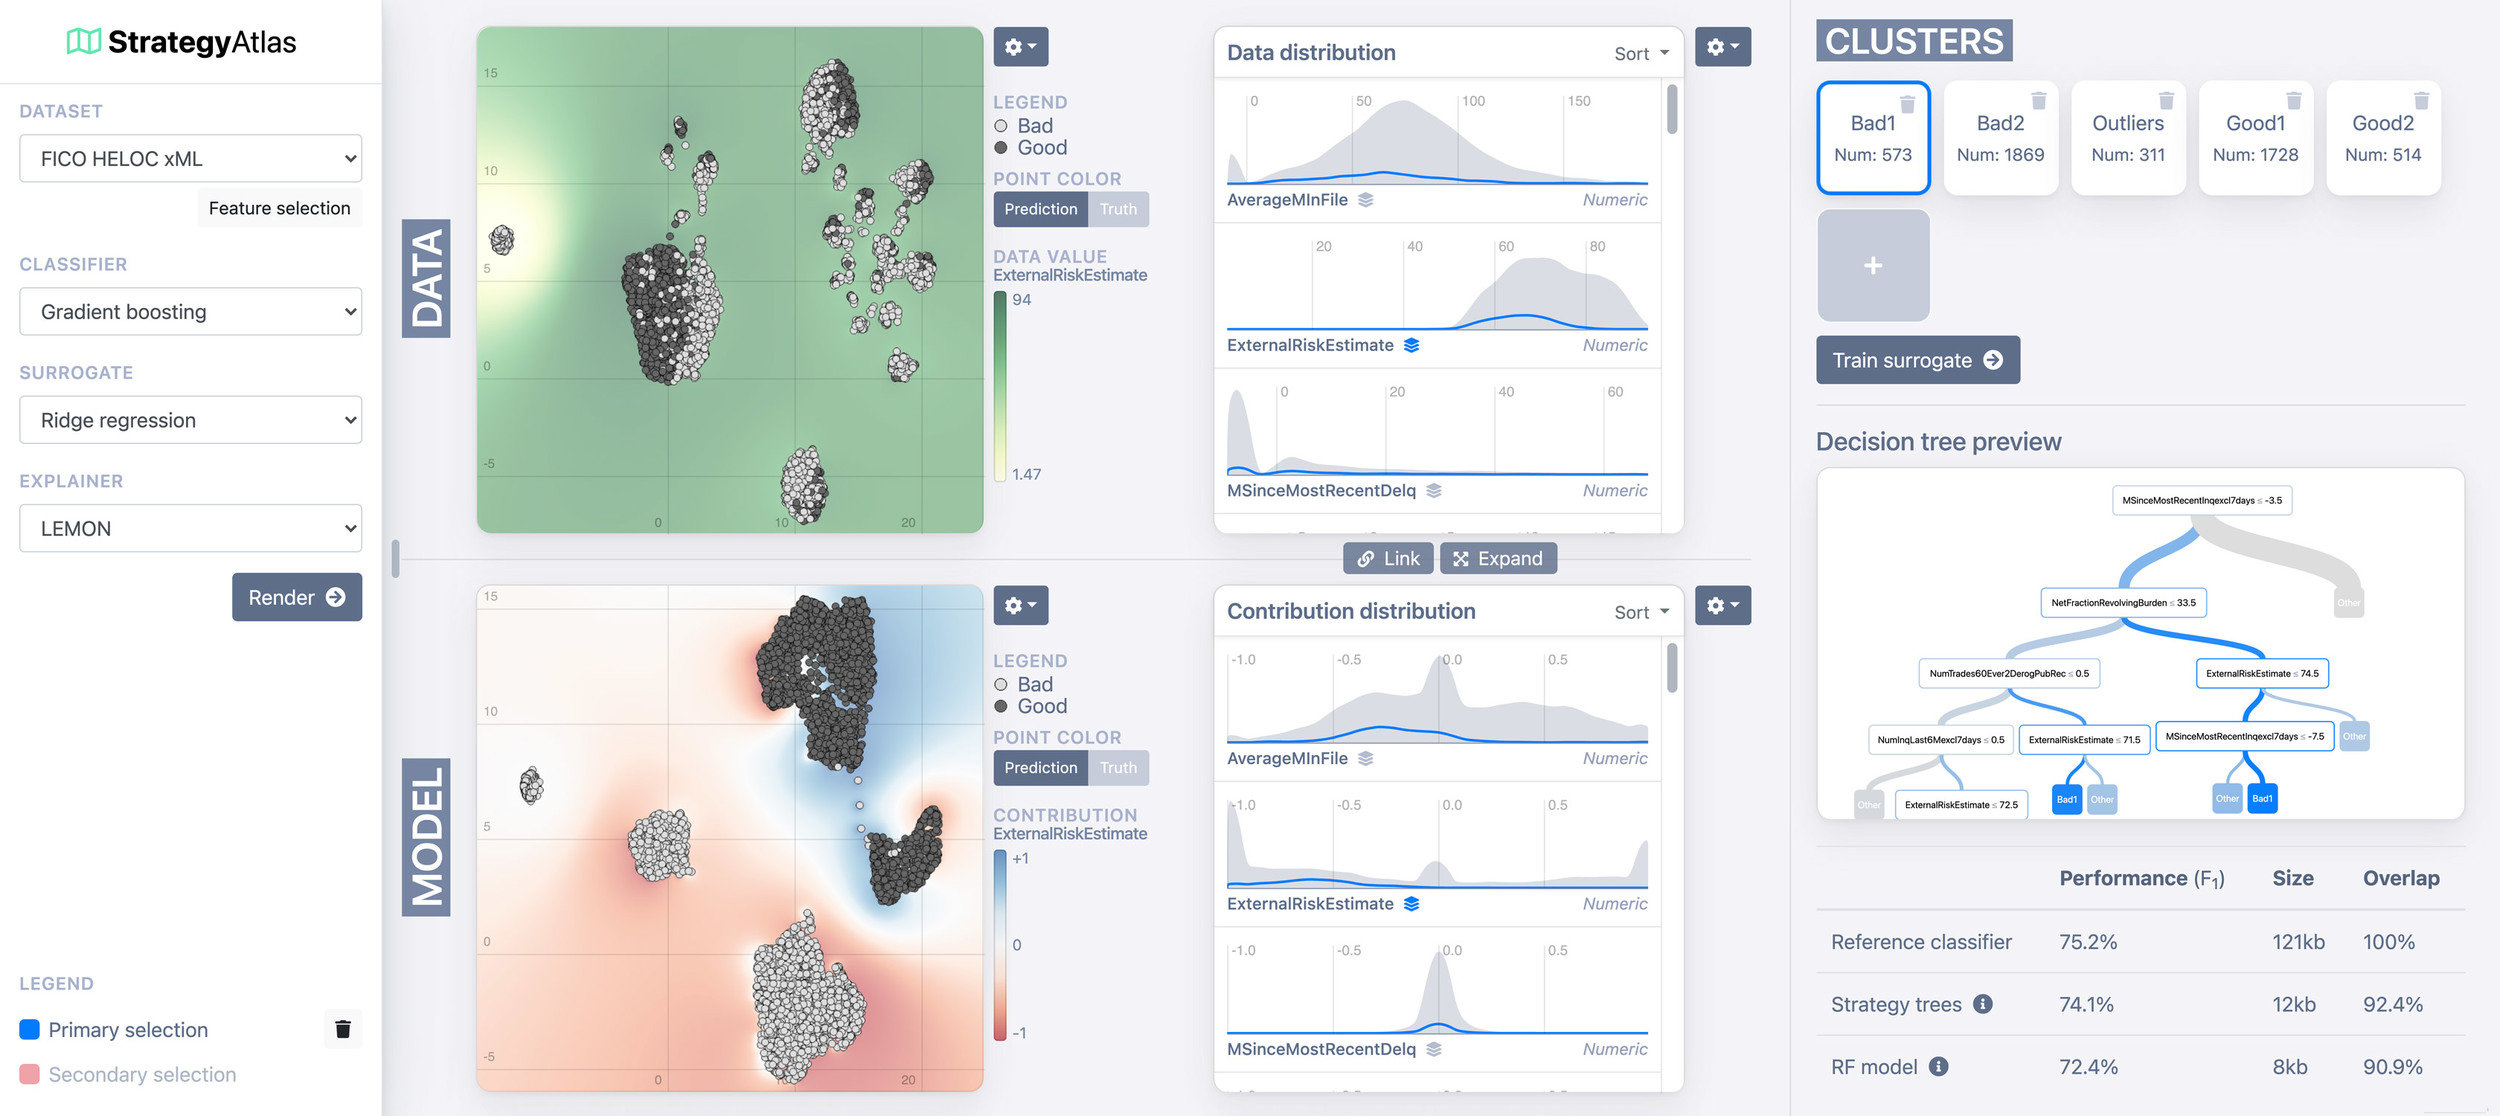
StrategyAtlas
Overview
How?

Strategy A
Strategy B
The basic principle
How?
The basic principle
| ID | Name | Age | Sex | Product | Branch | ... |
|---|---|---|---|---|---|---|
| 1 | 💤 | 💤 | 💤 | 🔥 | 💤 | ... |
| 2 | 🔥 | 💤 | 💤 | 💤 | 🔥 | ... |
| 3 | 💤 | 🔥 | 💤 | 🔥 | 🔥 | ... |
| ... | ... | ... | ... | ... | ... | ... |
| ID | Name | Age | Sex | Product | Branch | ... |
|---|---|---|---|---|---|---|
| 1 | Alice | 28 | F | Health | Zekur | ... |
| 2 | Bob | 57 | M | Car | FBTO | ... |
| 3 | Chad | 34 | M | Life | Intrpls | ... |
| ... | ... | ... | ... | ... | ... | ... |
2D projection
StrategyMap
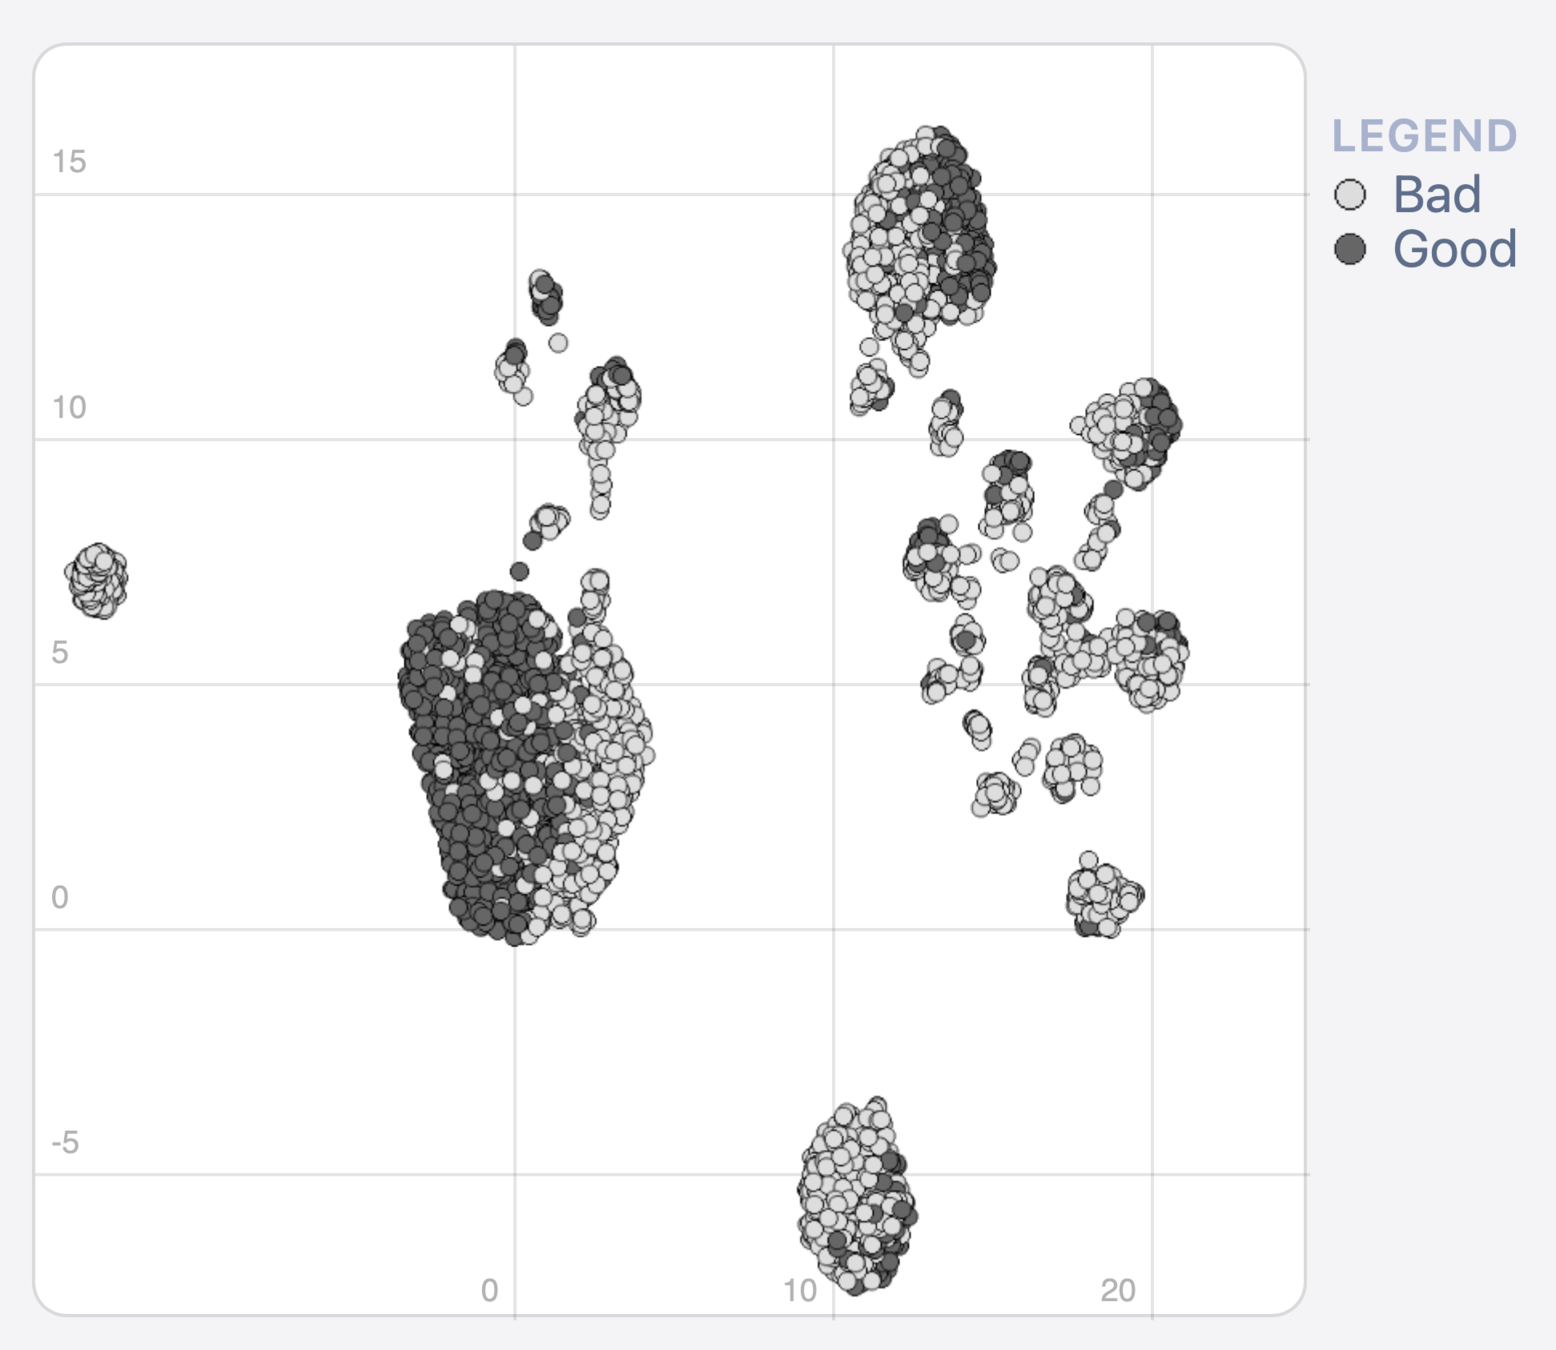
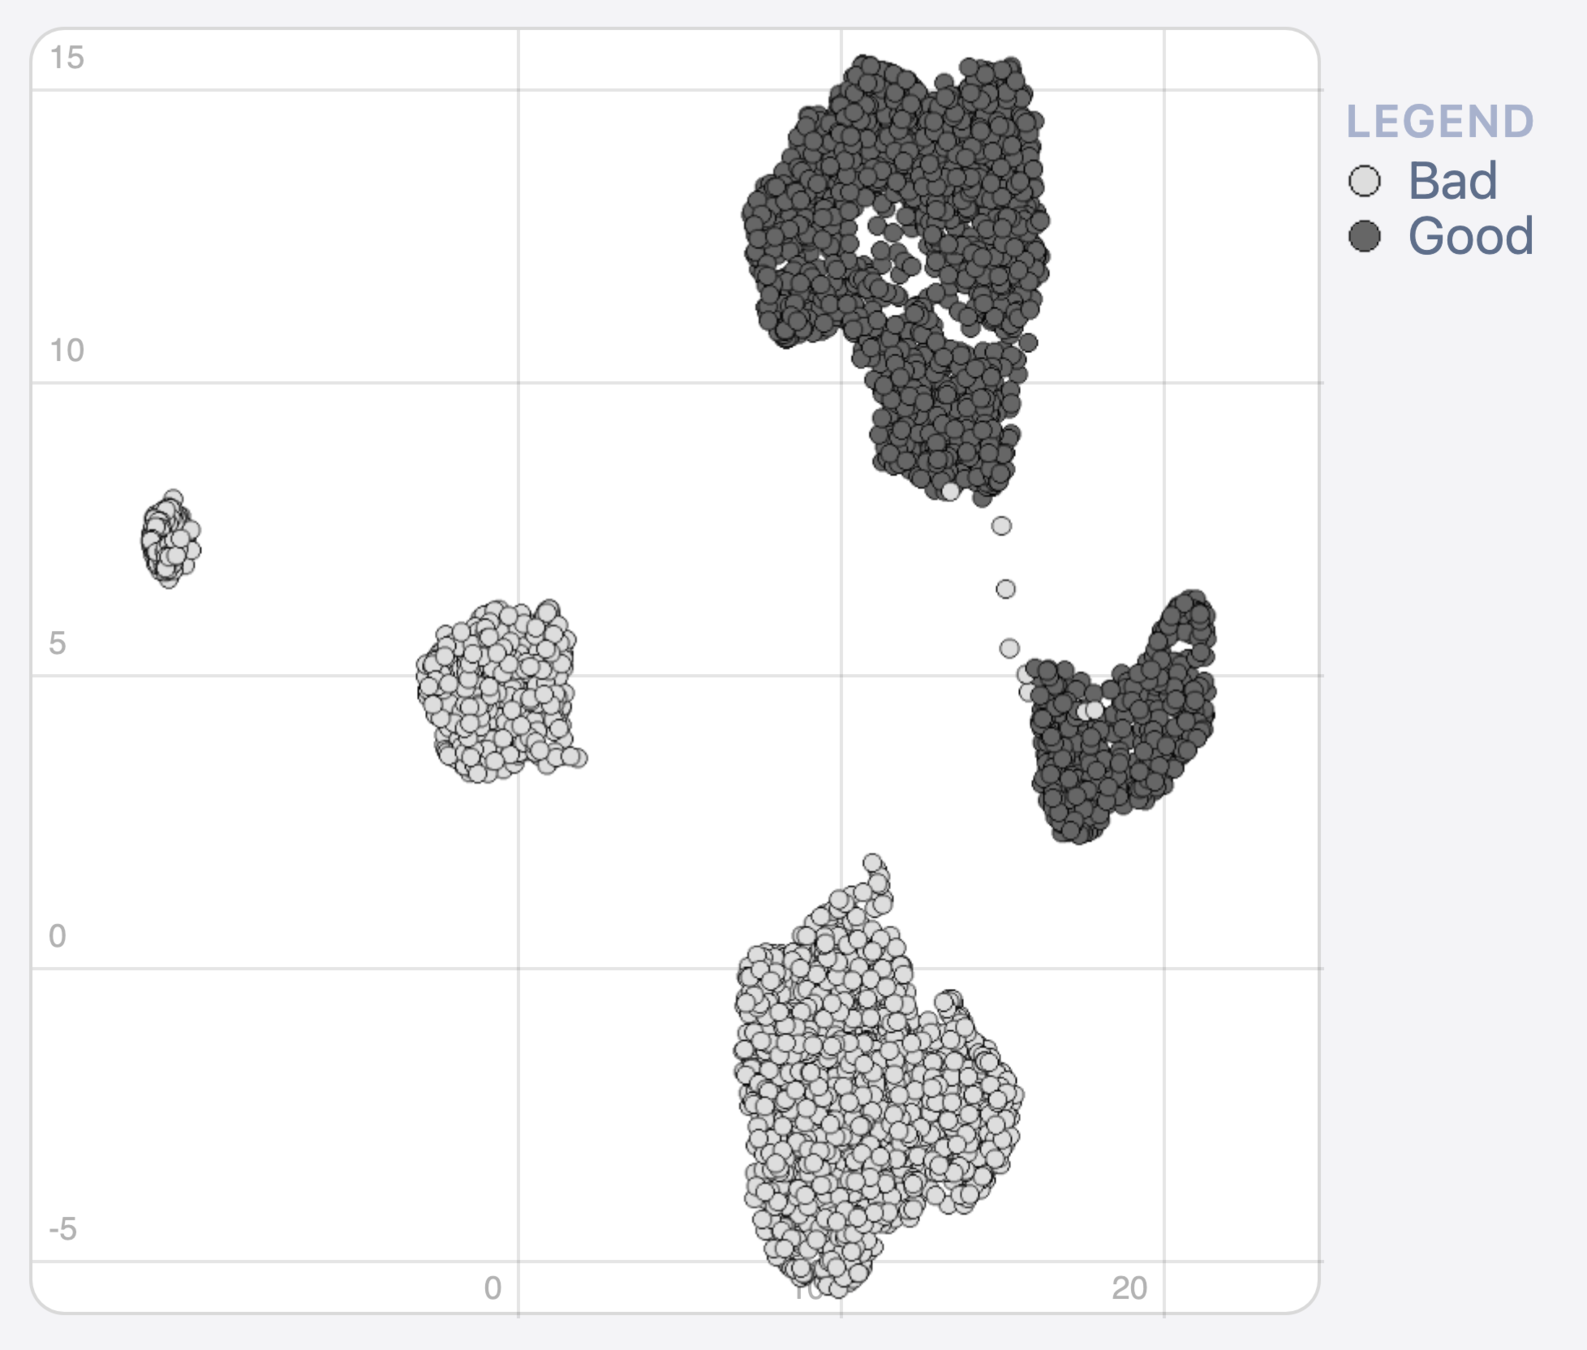
feature contribution (LIME)
What?
Method 1: Heat map cluster analysis
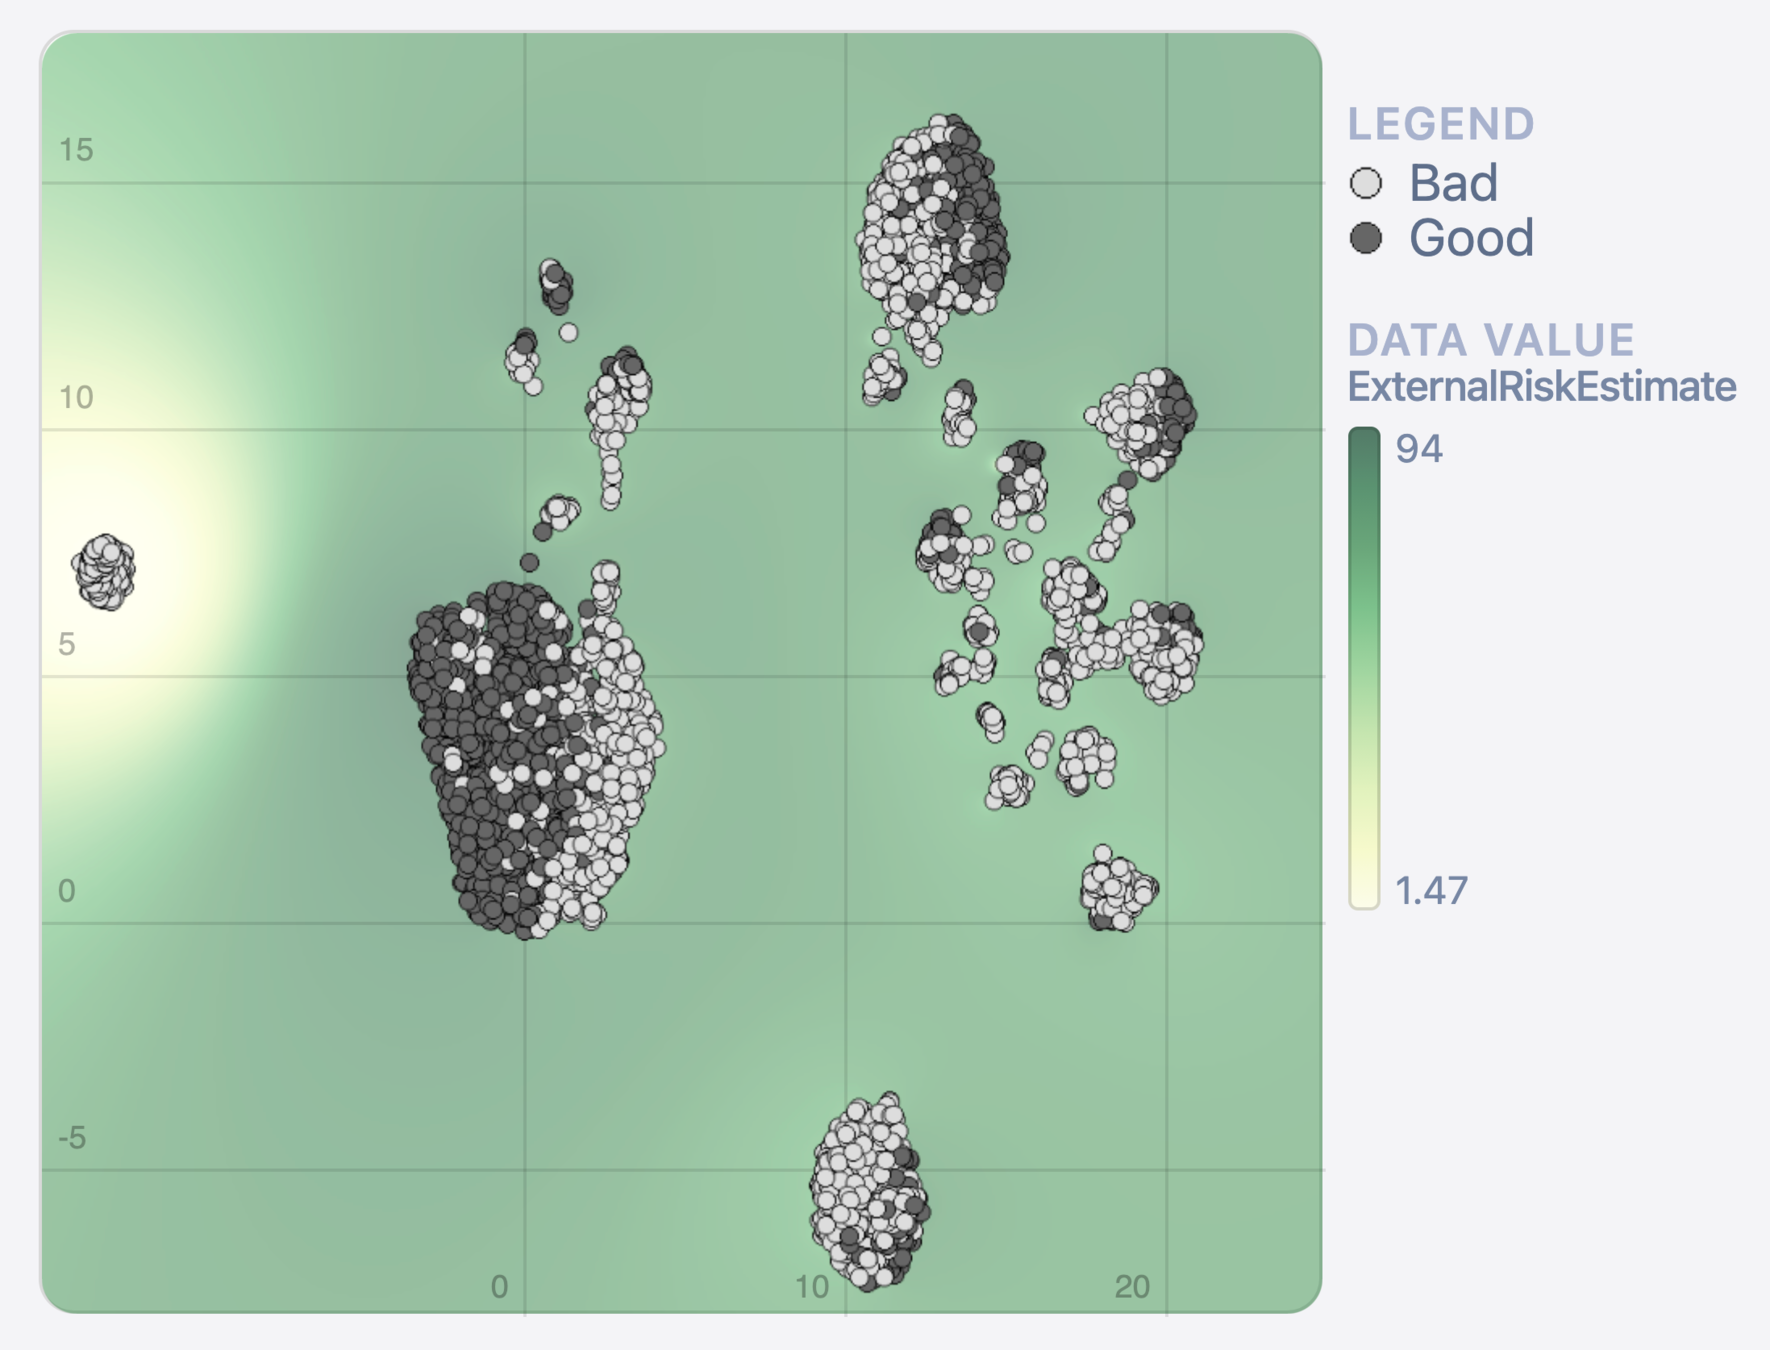
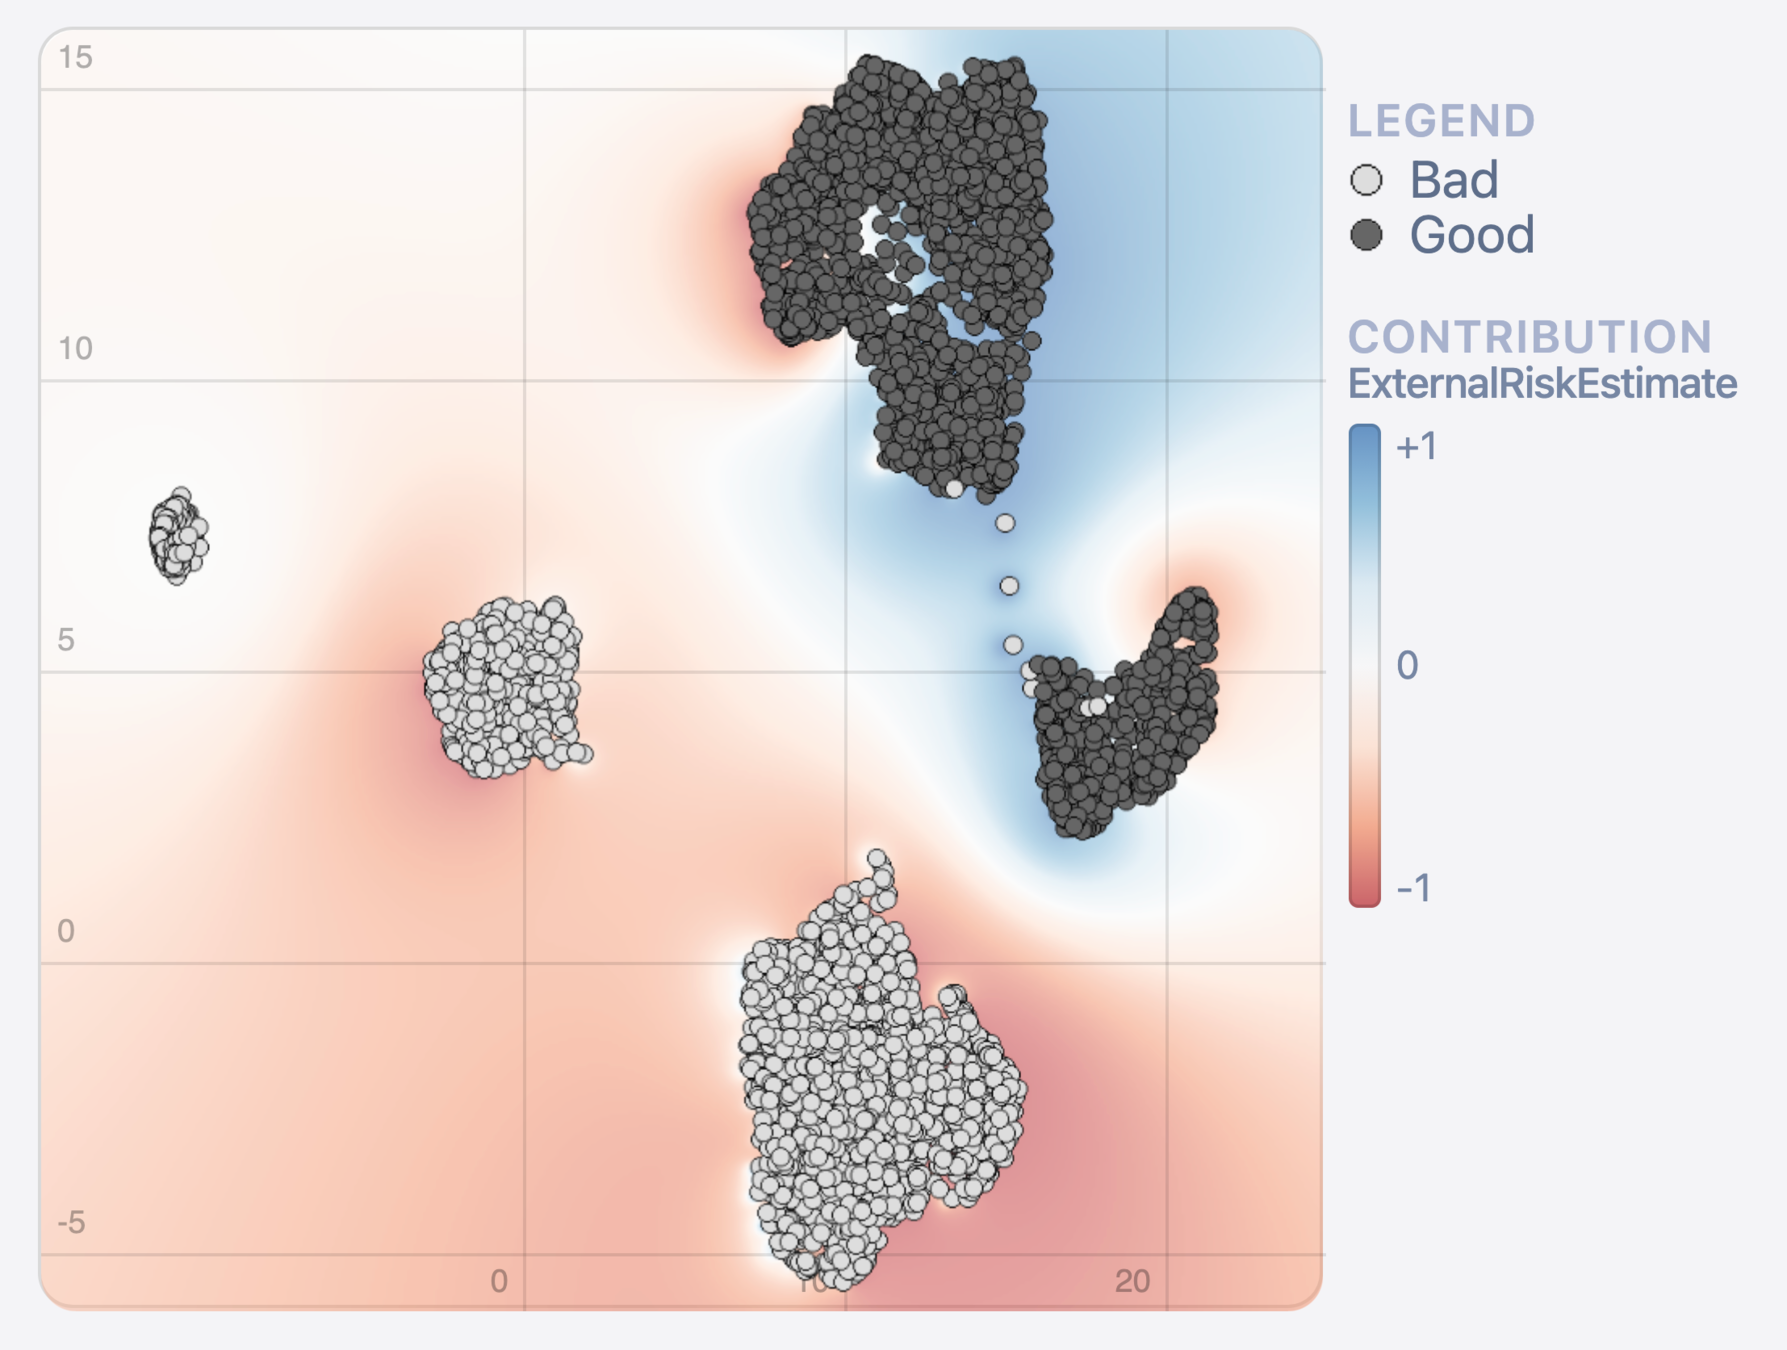
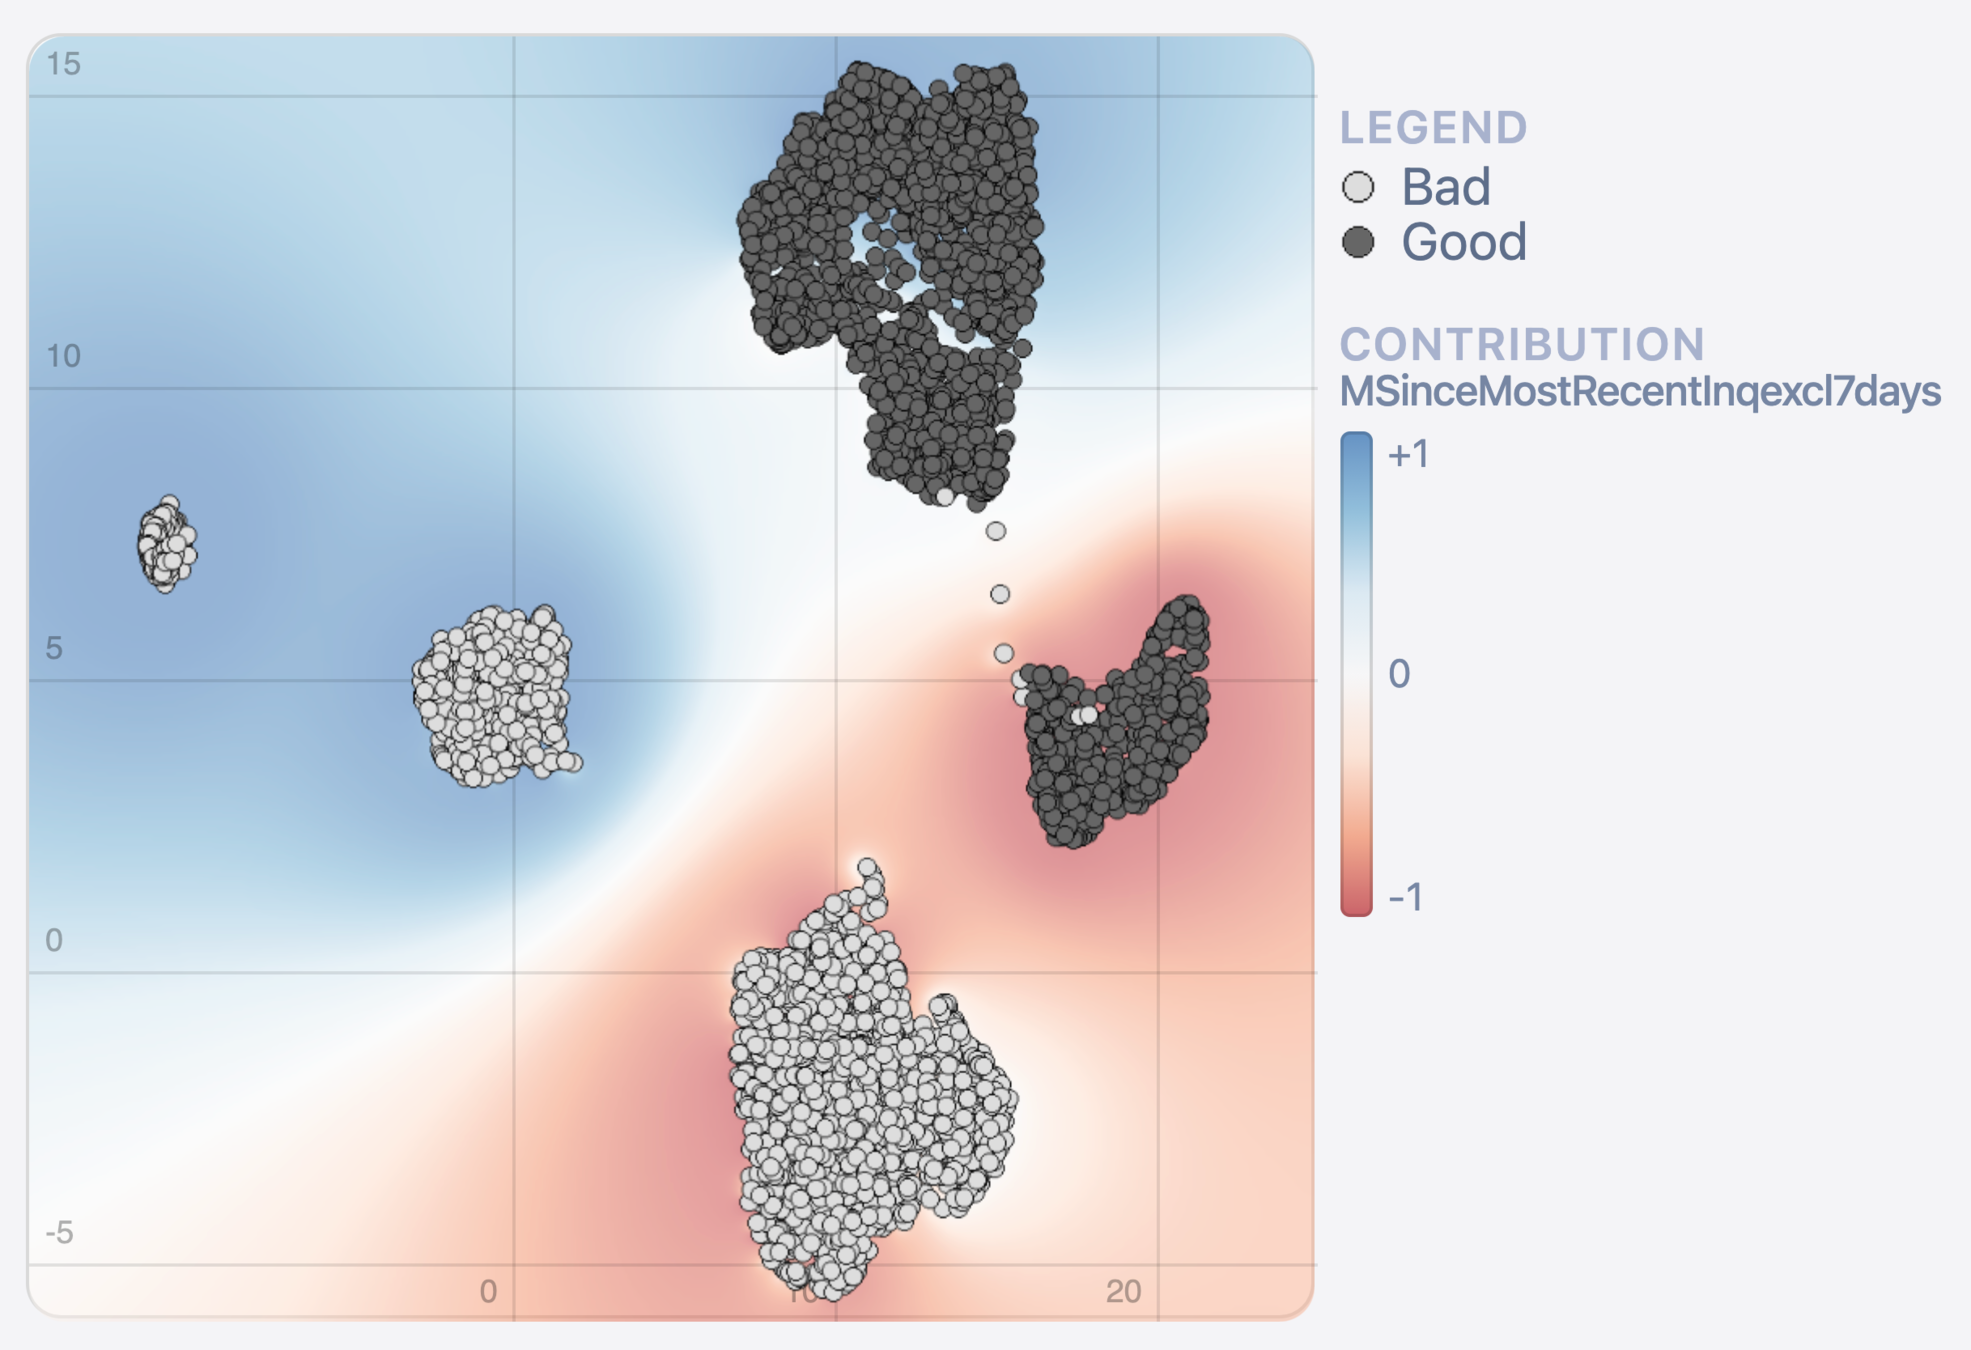
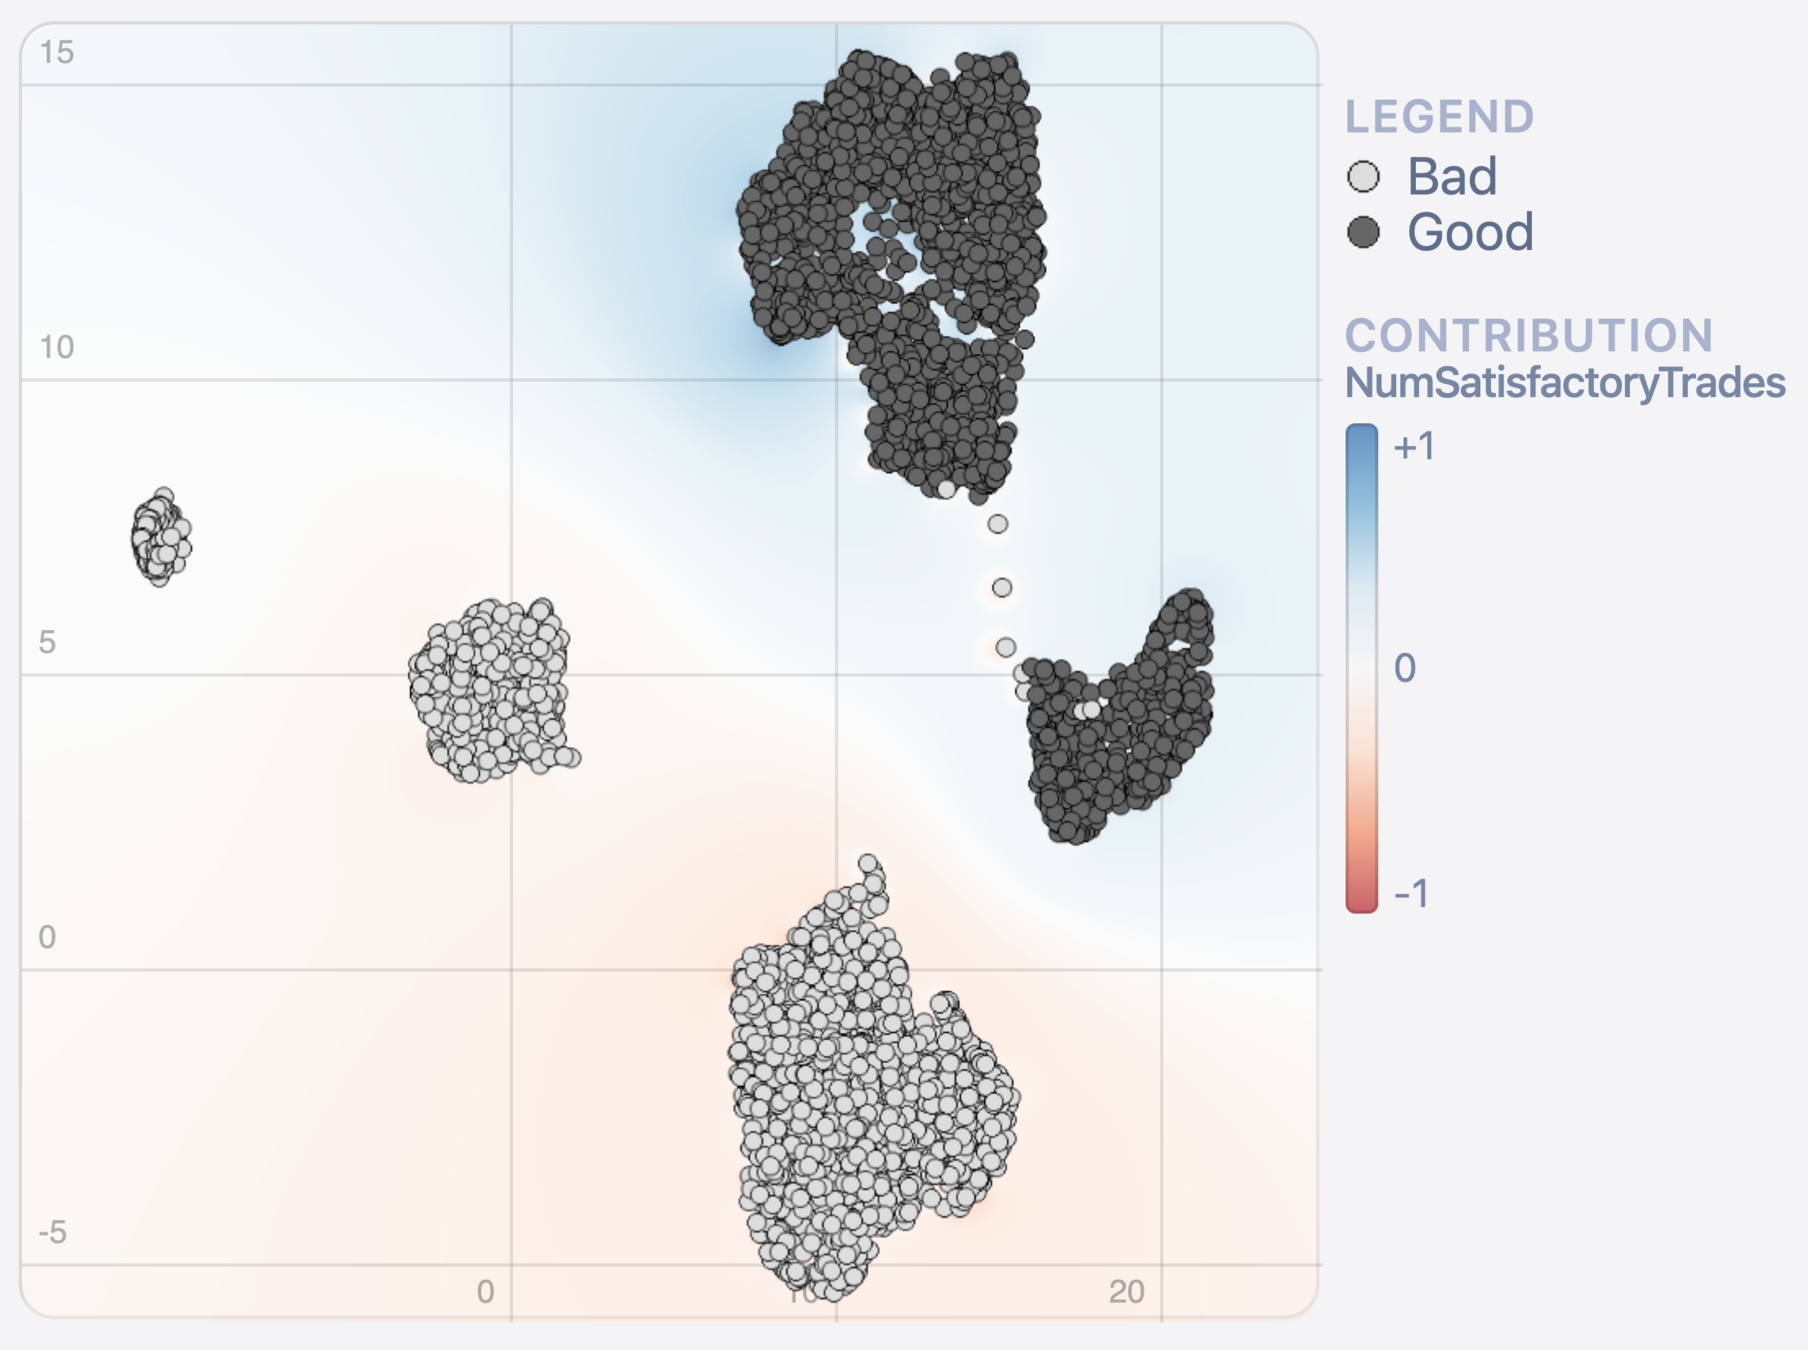
Data
Model
What?
Method 2: Density plots
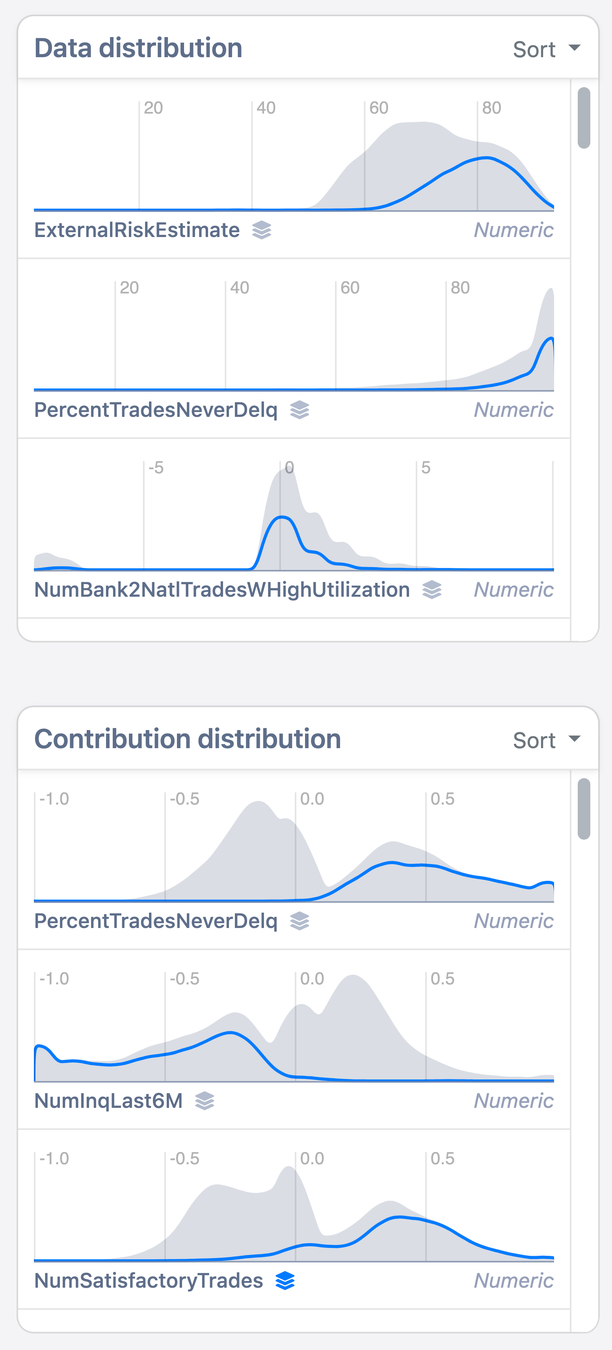
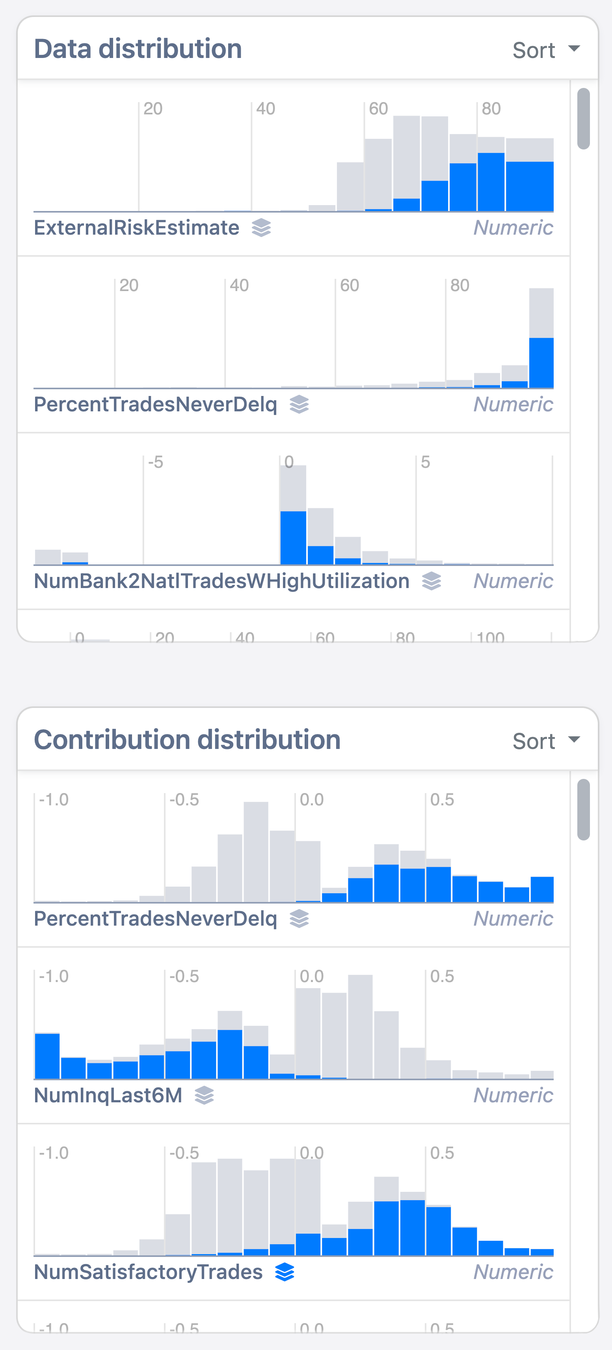
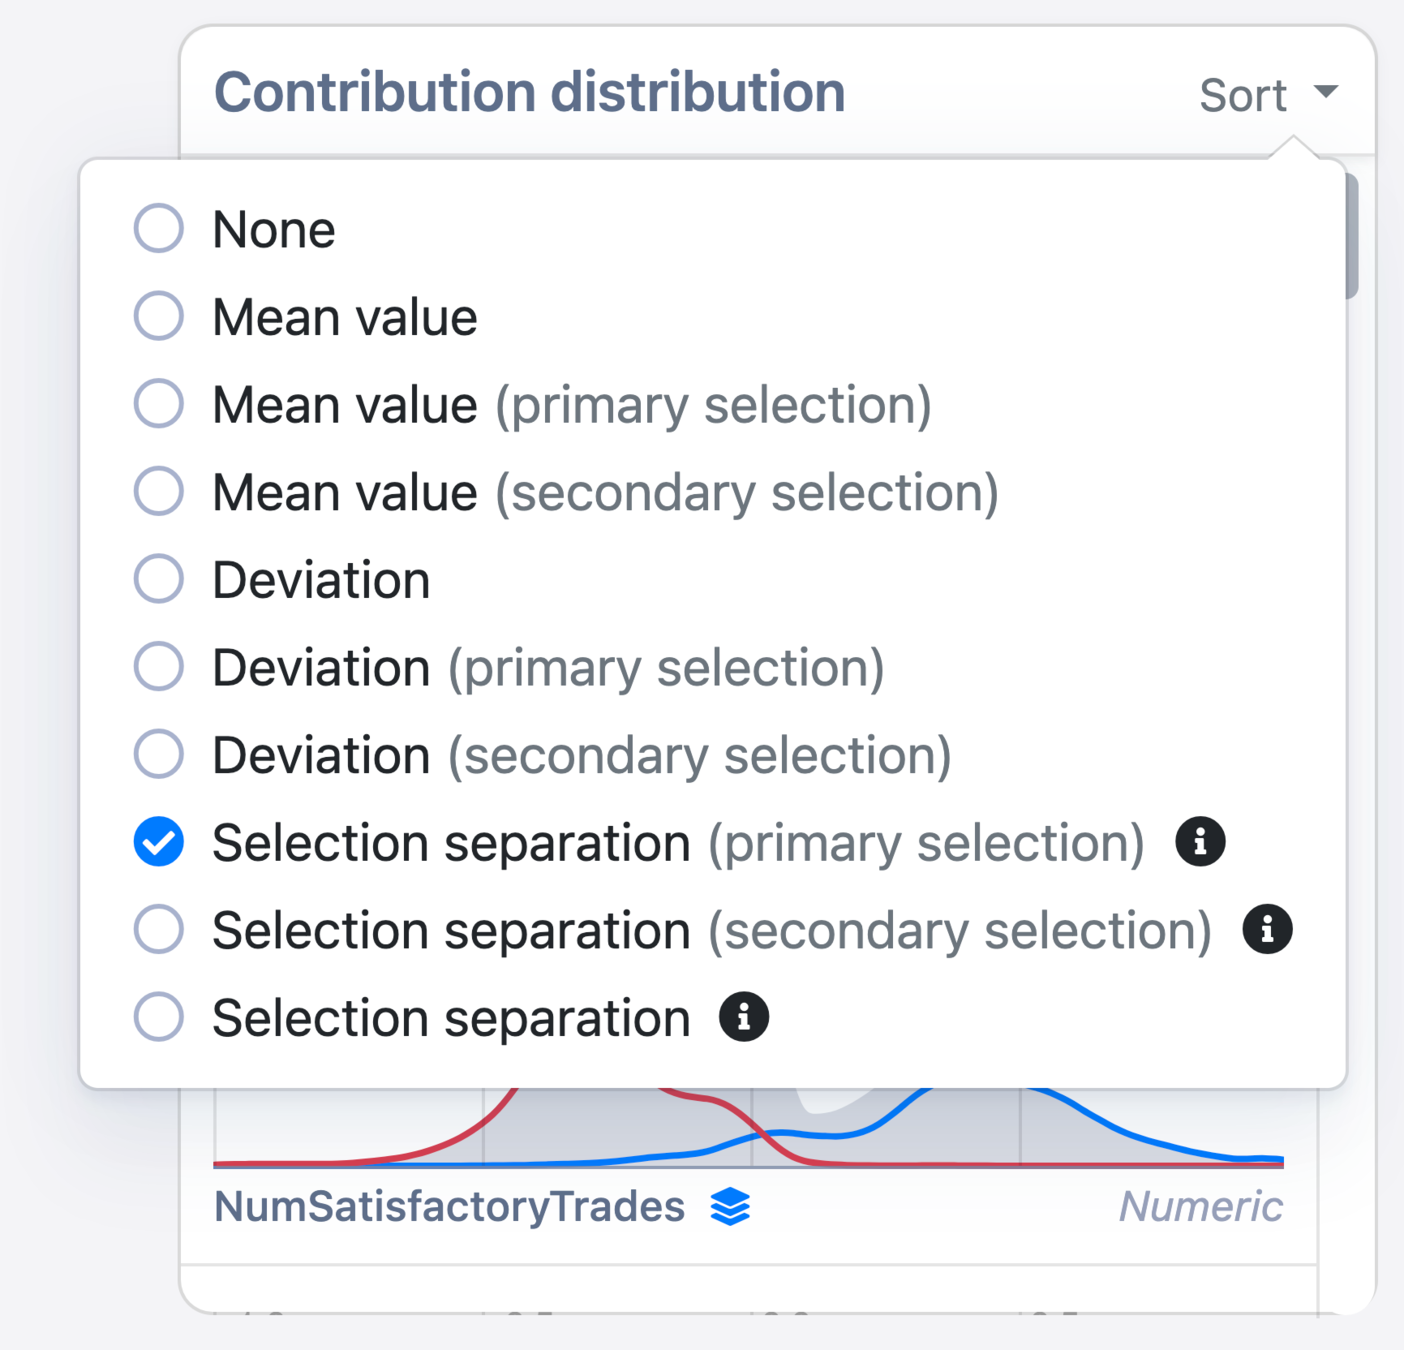
Data
Model
All data
Selection
What?
Method 3: Decision trees
Saved clusters →
DT for selected cluster →
Performance comparison →
What?
Demo of the system
Paper submitted to:
IEEE Transactions on Visualization and Computer Graphics


sklearn-pmml-model
bit.ly/
sklearn-pmml

or
Other projects
Importing models from R to Python
Other projects
Fundamental research on expert interpretation of feature importance

sklearn-pmml-model
bit.ly/
sklearn-pmml
or
explaining.ml
or


Links
Where you can find more information