StrategyAtlas introduction

Dennis Collaris, Jarke J. van Wijk
Eindhoven University of Technology


Data
Black
Box
Subject
80% risk
Why?
ML is often applied as a black box.
How?

Strategy A
Strategy B
The basic principle
How?
The basic principle
| ID | Name | Age | Sex | Product | Branch | ... |
|---|---|---|---|---|---|---|
| 1 | 💤 | 💤 | 💤 | 🔥 | 💤 | ... |
| 2 | 🔥 | 💤 | 💤 | 💤 | 🔥 | ... |
| 3 | 💤 | 🔥 | 💤 | 🔥 | 🔥 | ... |
| ... | ... | ... | ... | ... | ... | ... |
| ID | Name | Age | Sex | Product | Branch | ... |
|---|---|---|---|---|---|---|
| 1 | Alice | 28 | F | Health | Zekur | ... |
| 2 | Bob | 57 | M | Car | FBTO | ... |
| 3 | Chad | 34 | M | Life | Intrpls | ... |
| ... | ... | ... | ... | ... | ... | ... |
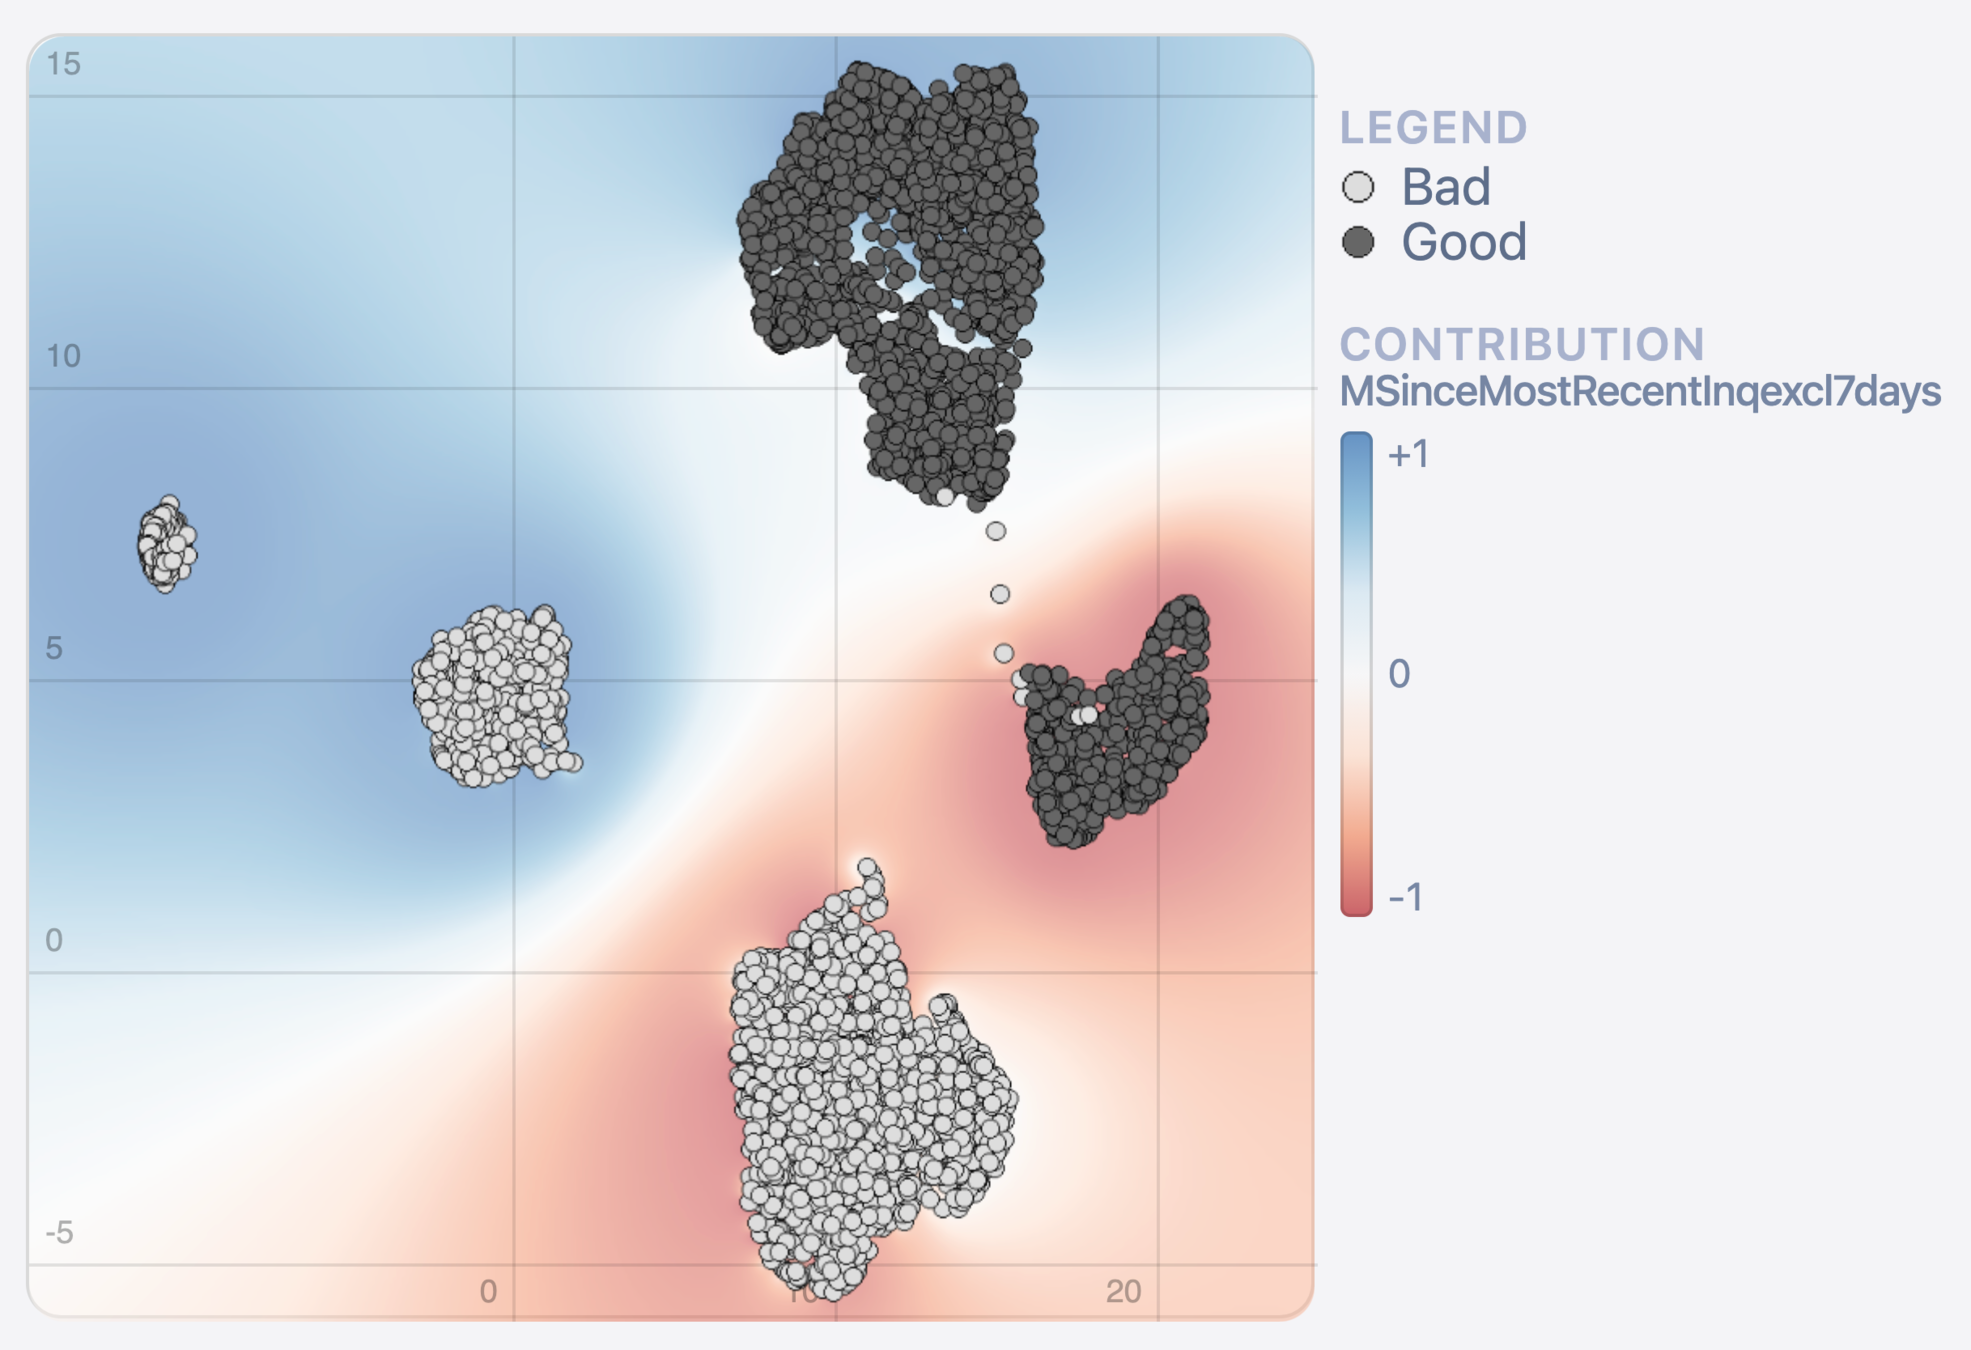
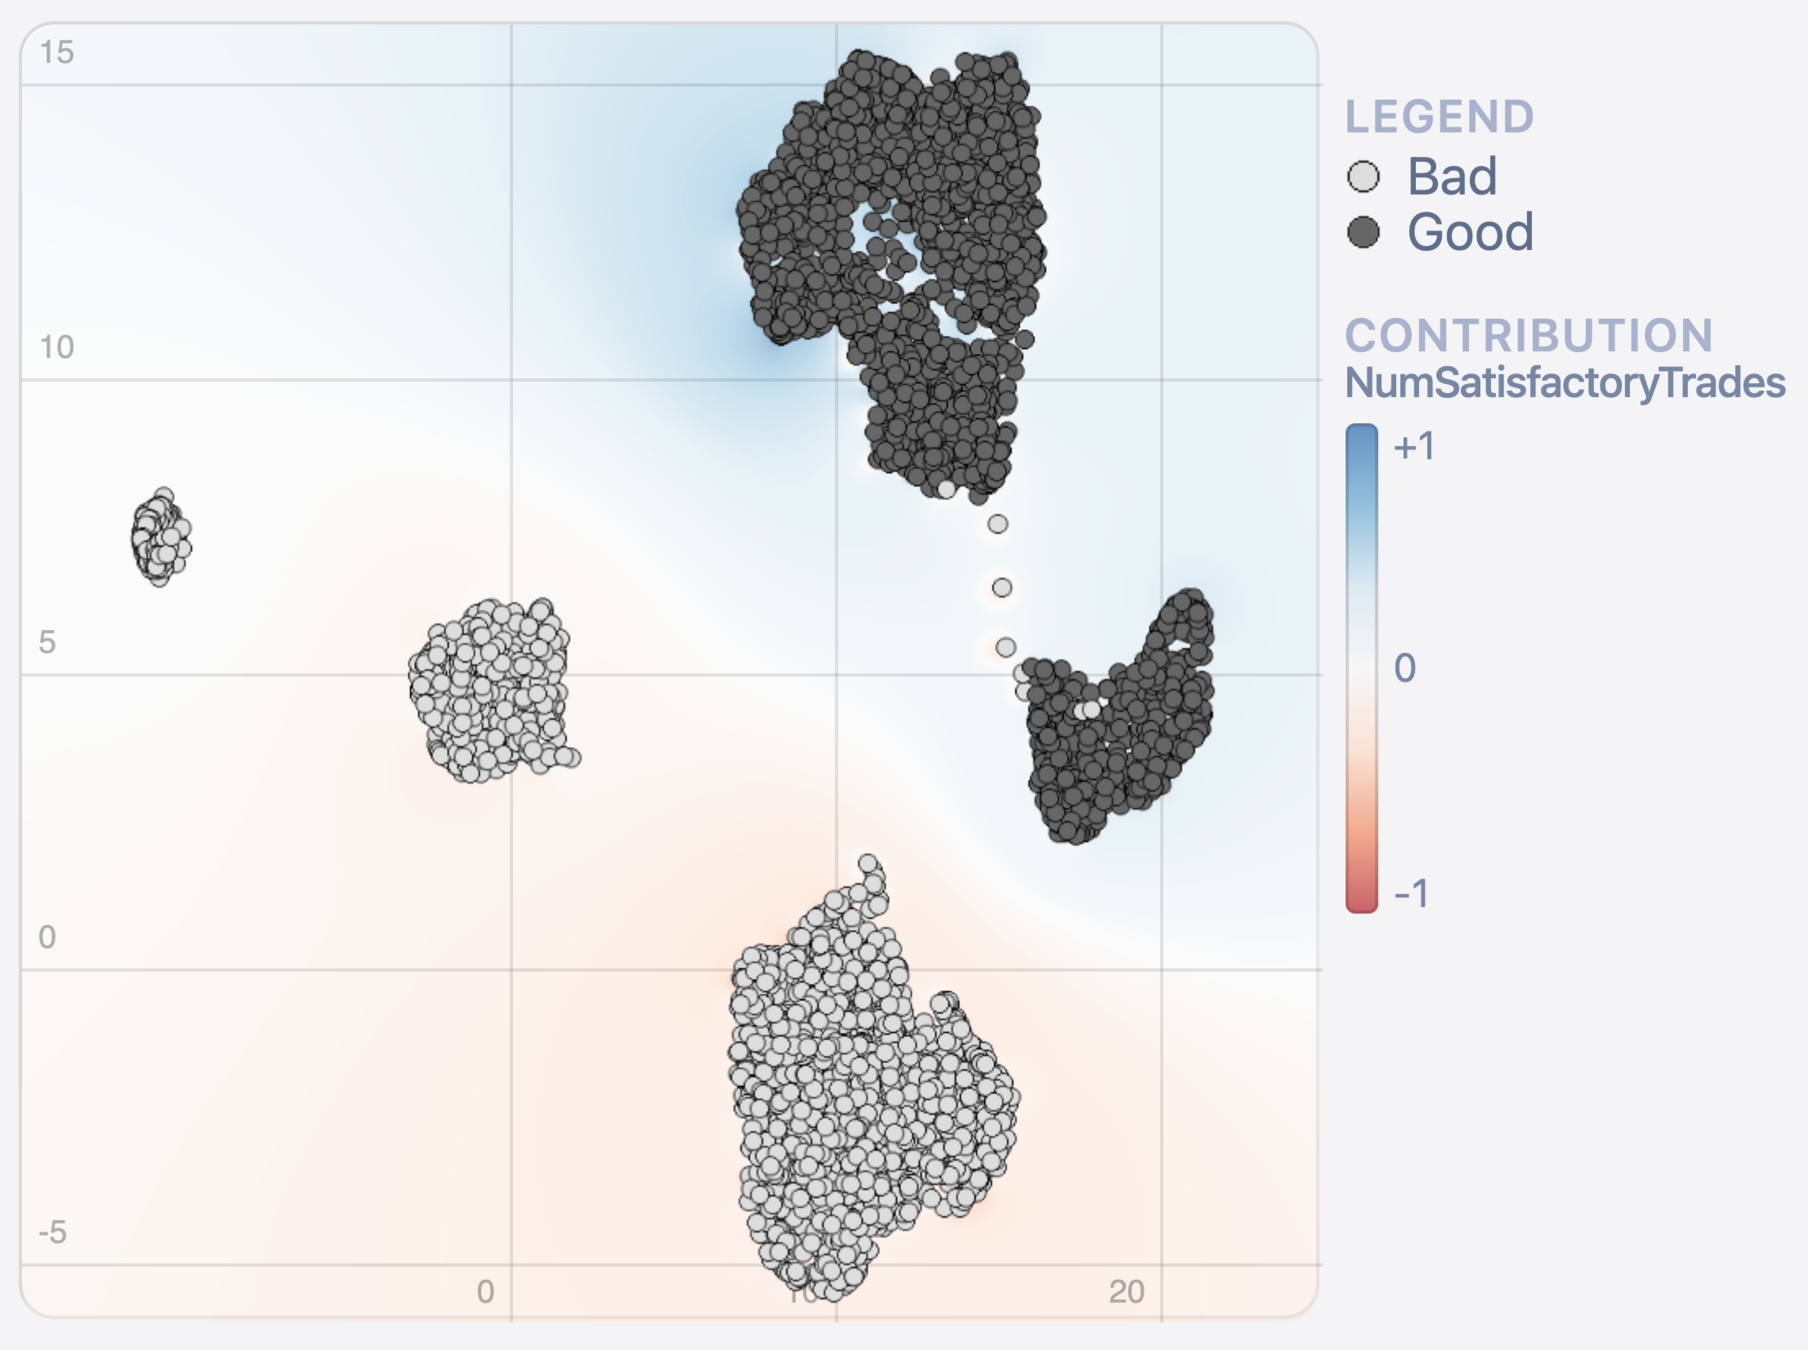
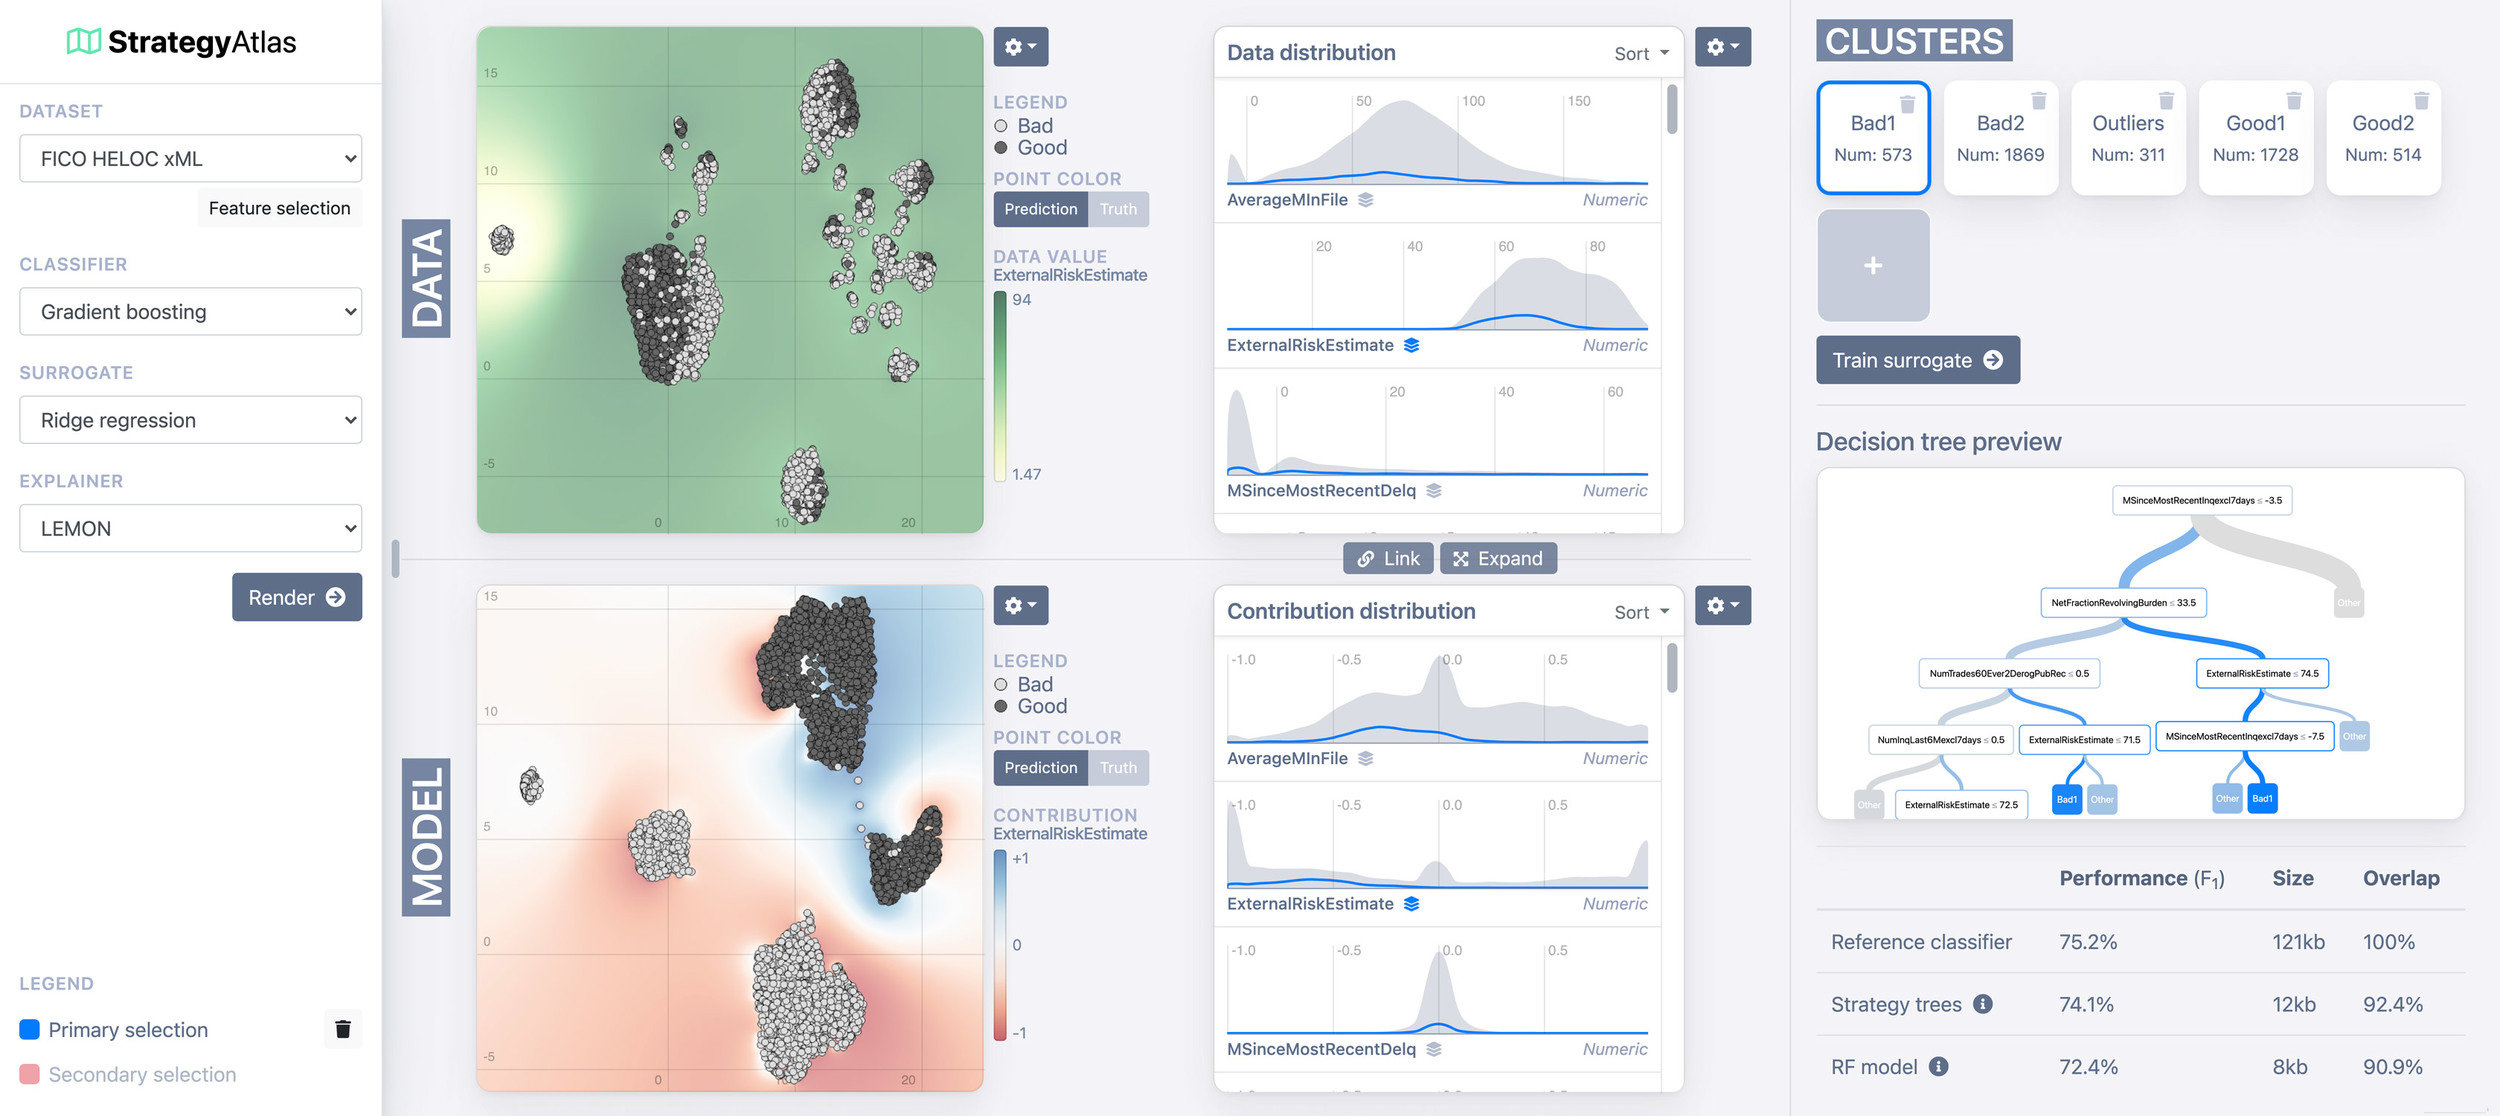
2D projection
StrategyMap
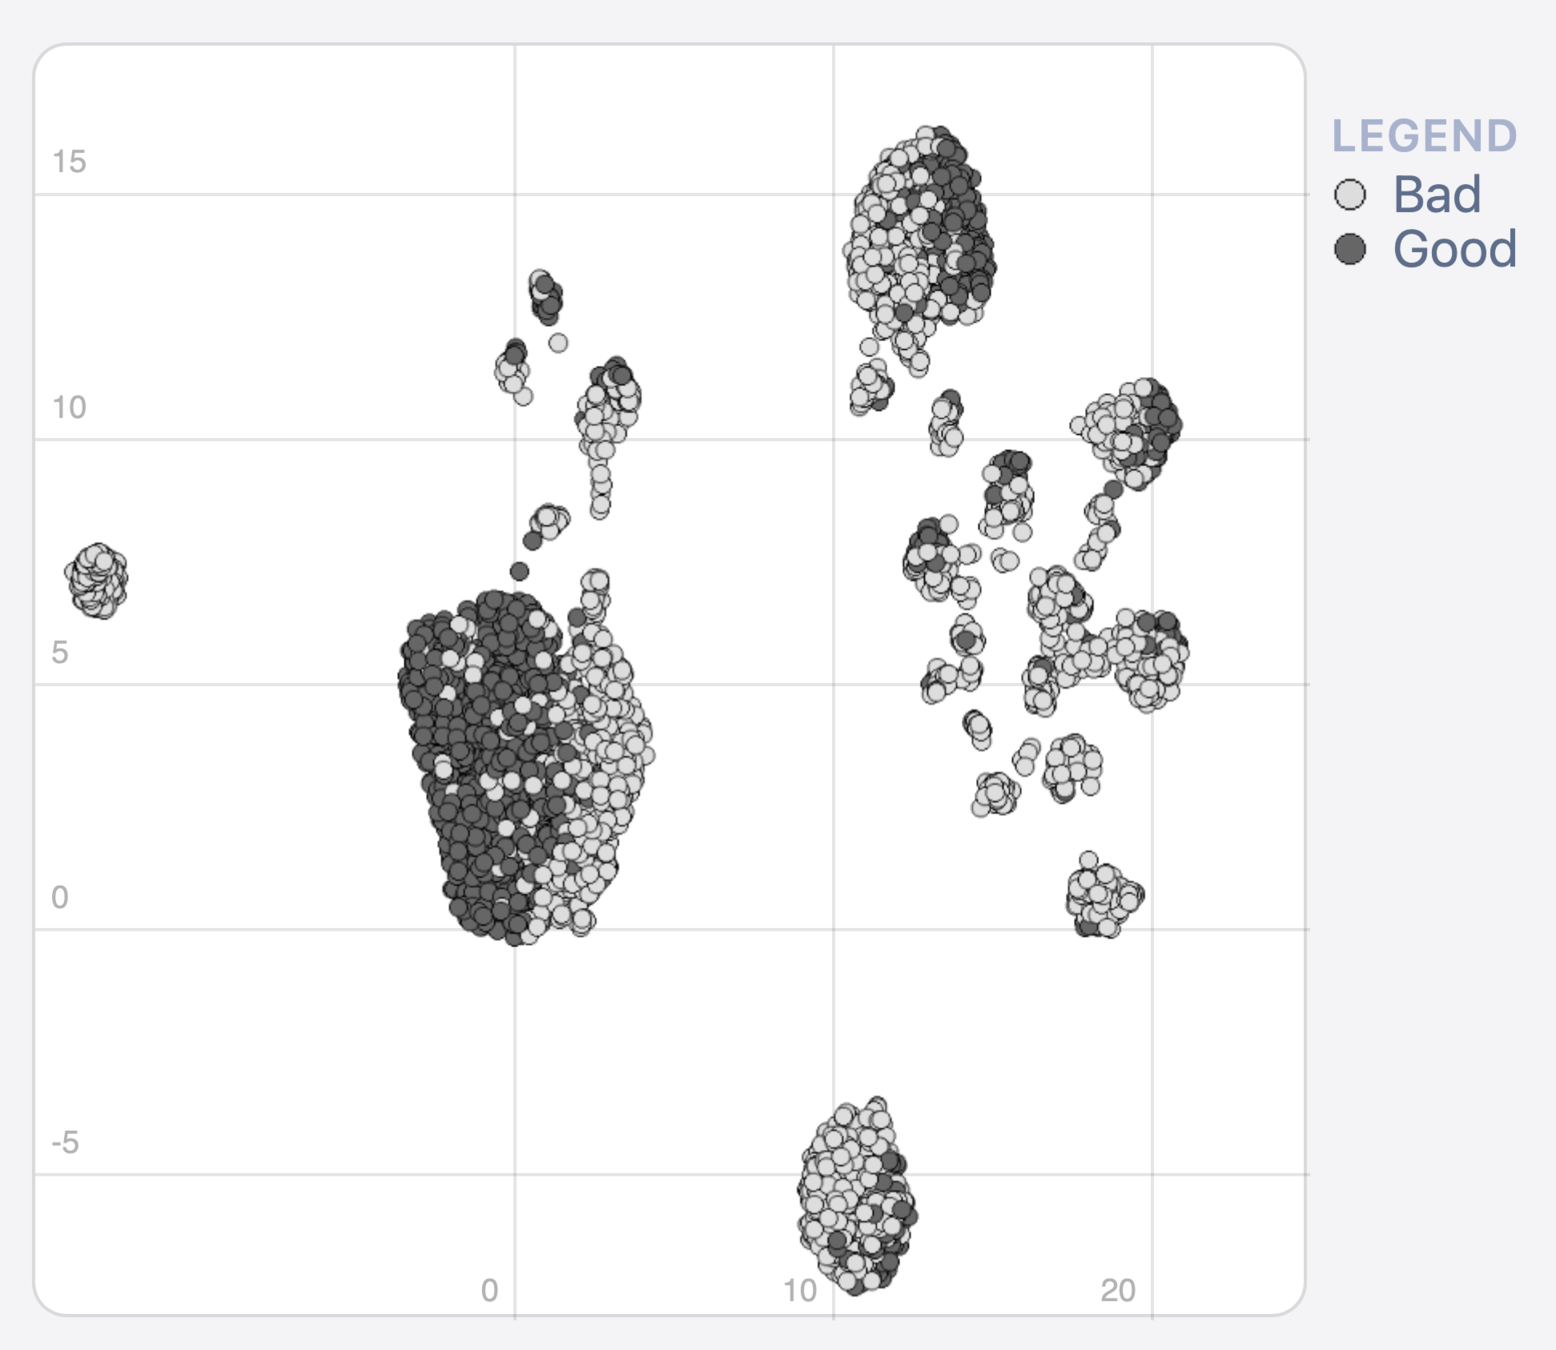
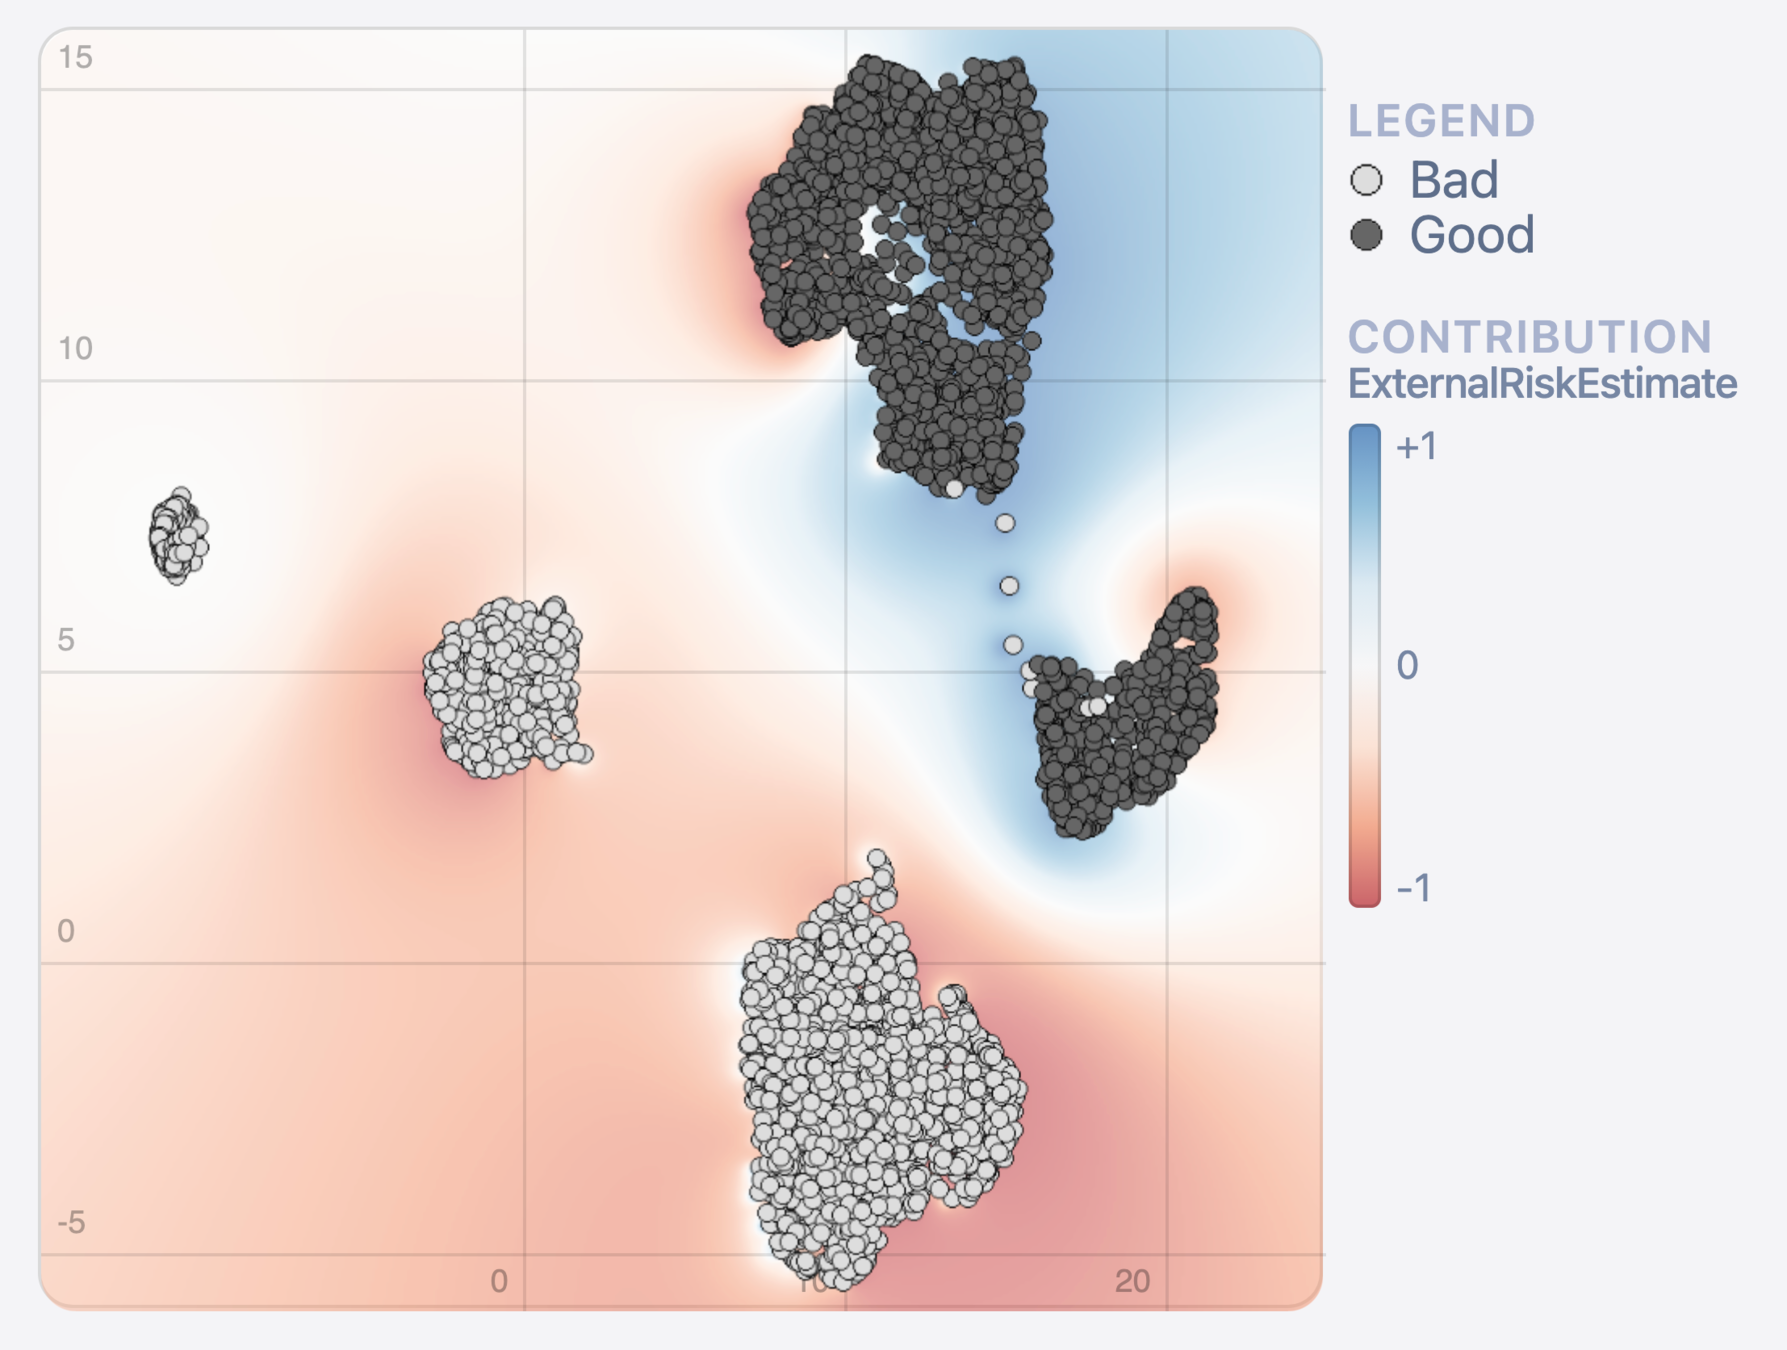
feature contribution (LIME)
What?
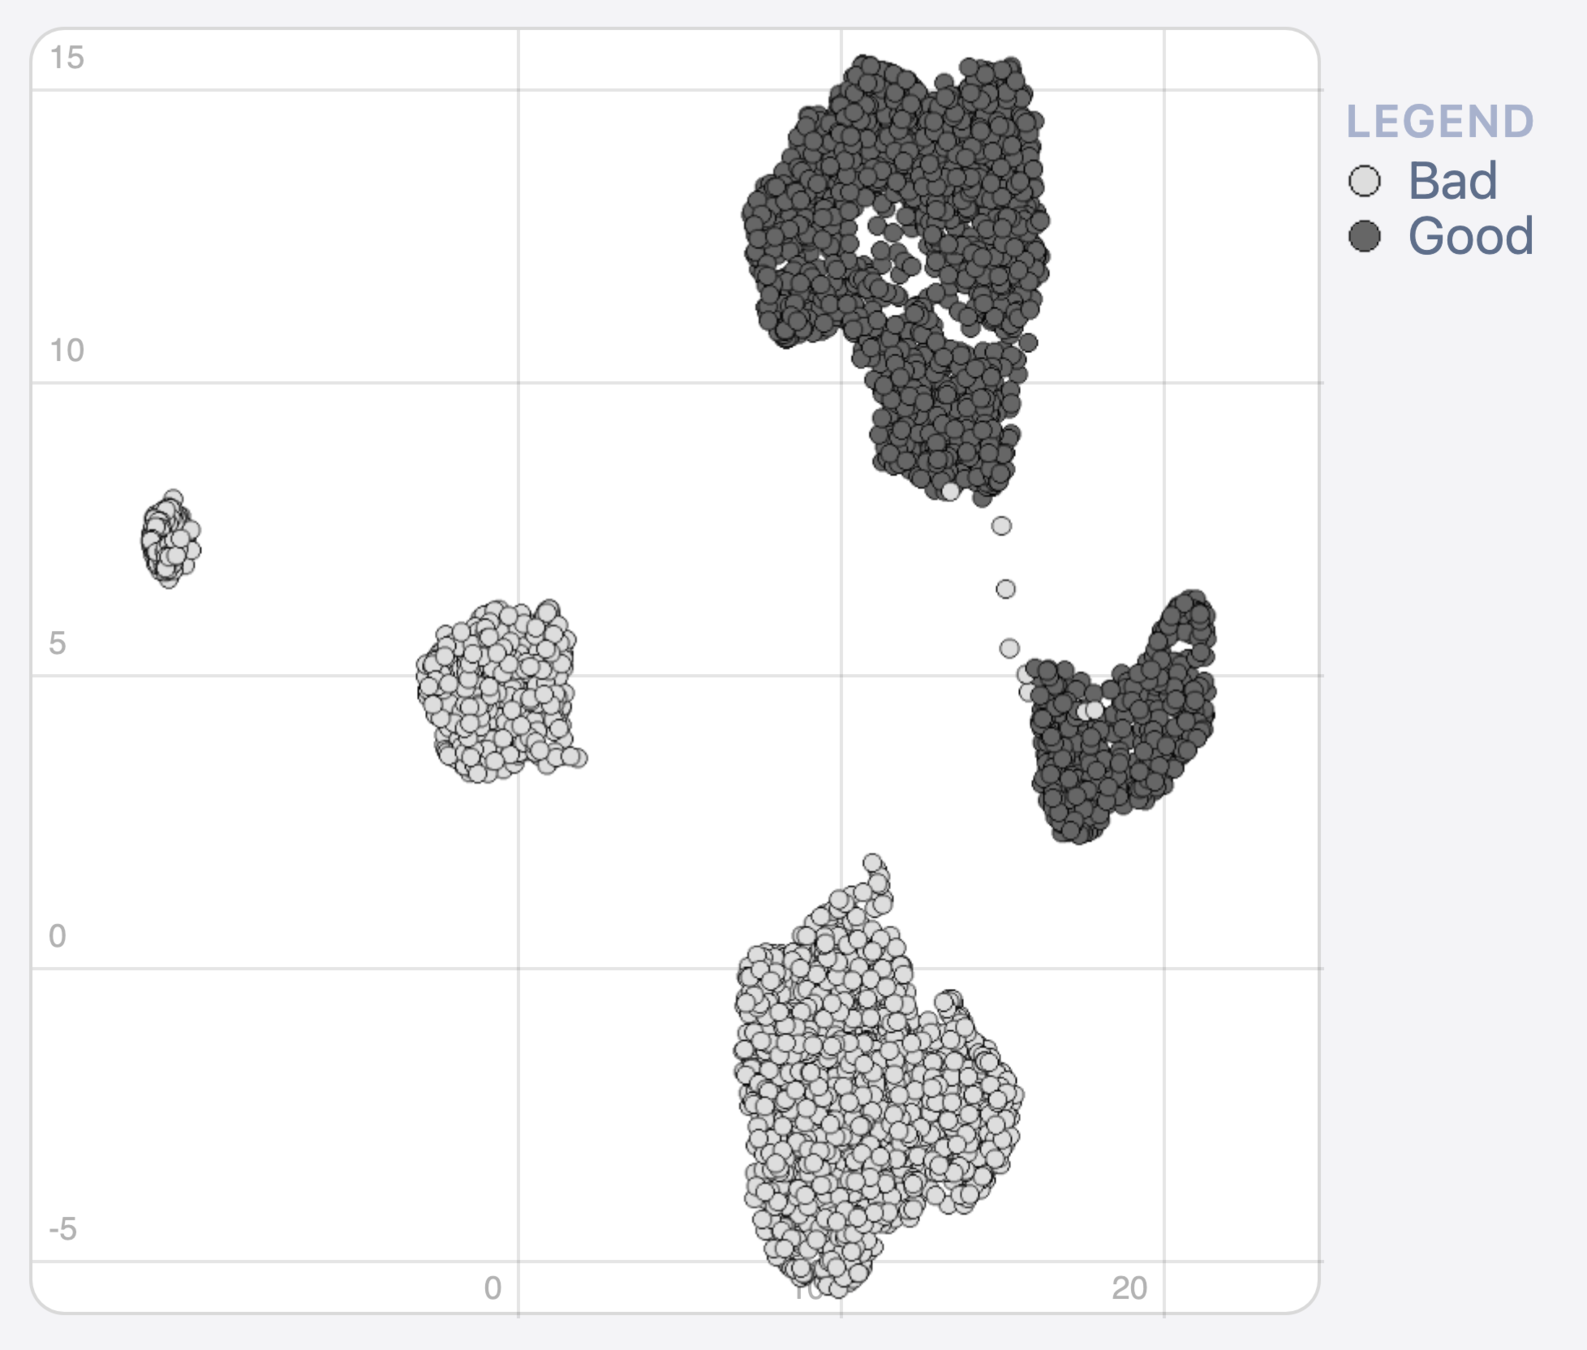
Method 1: Heat map cluster analysis
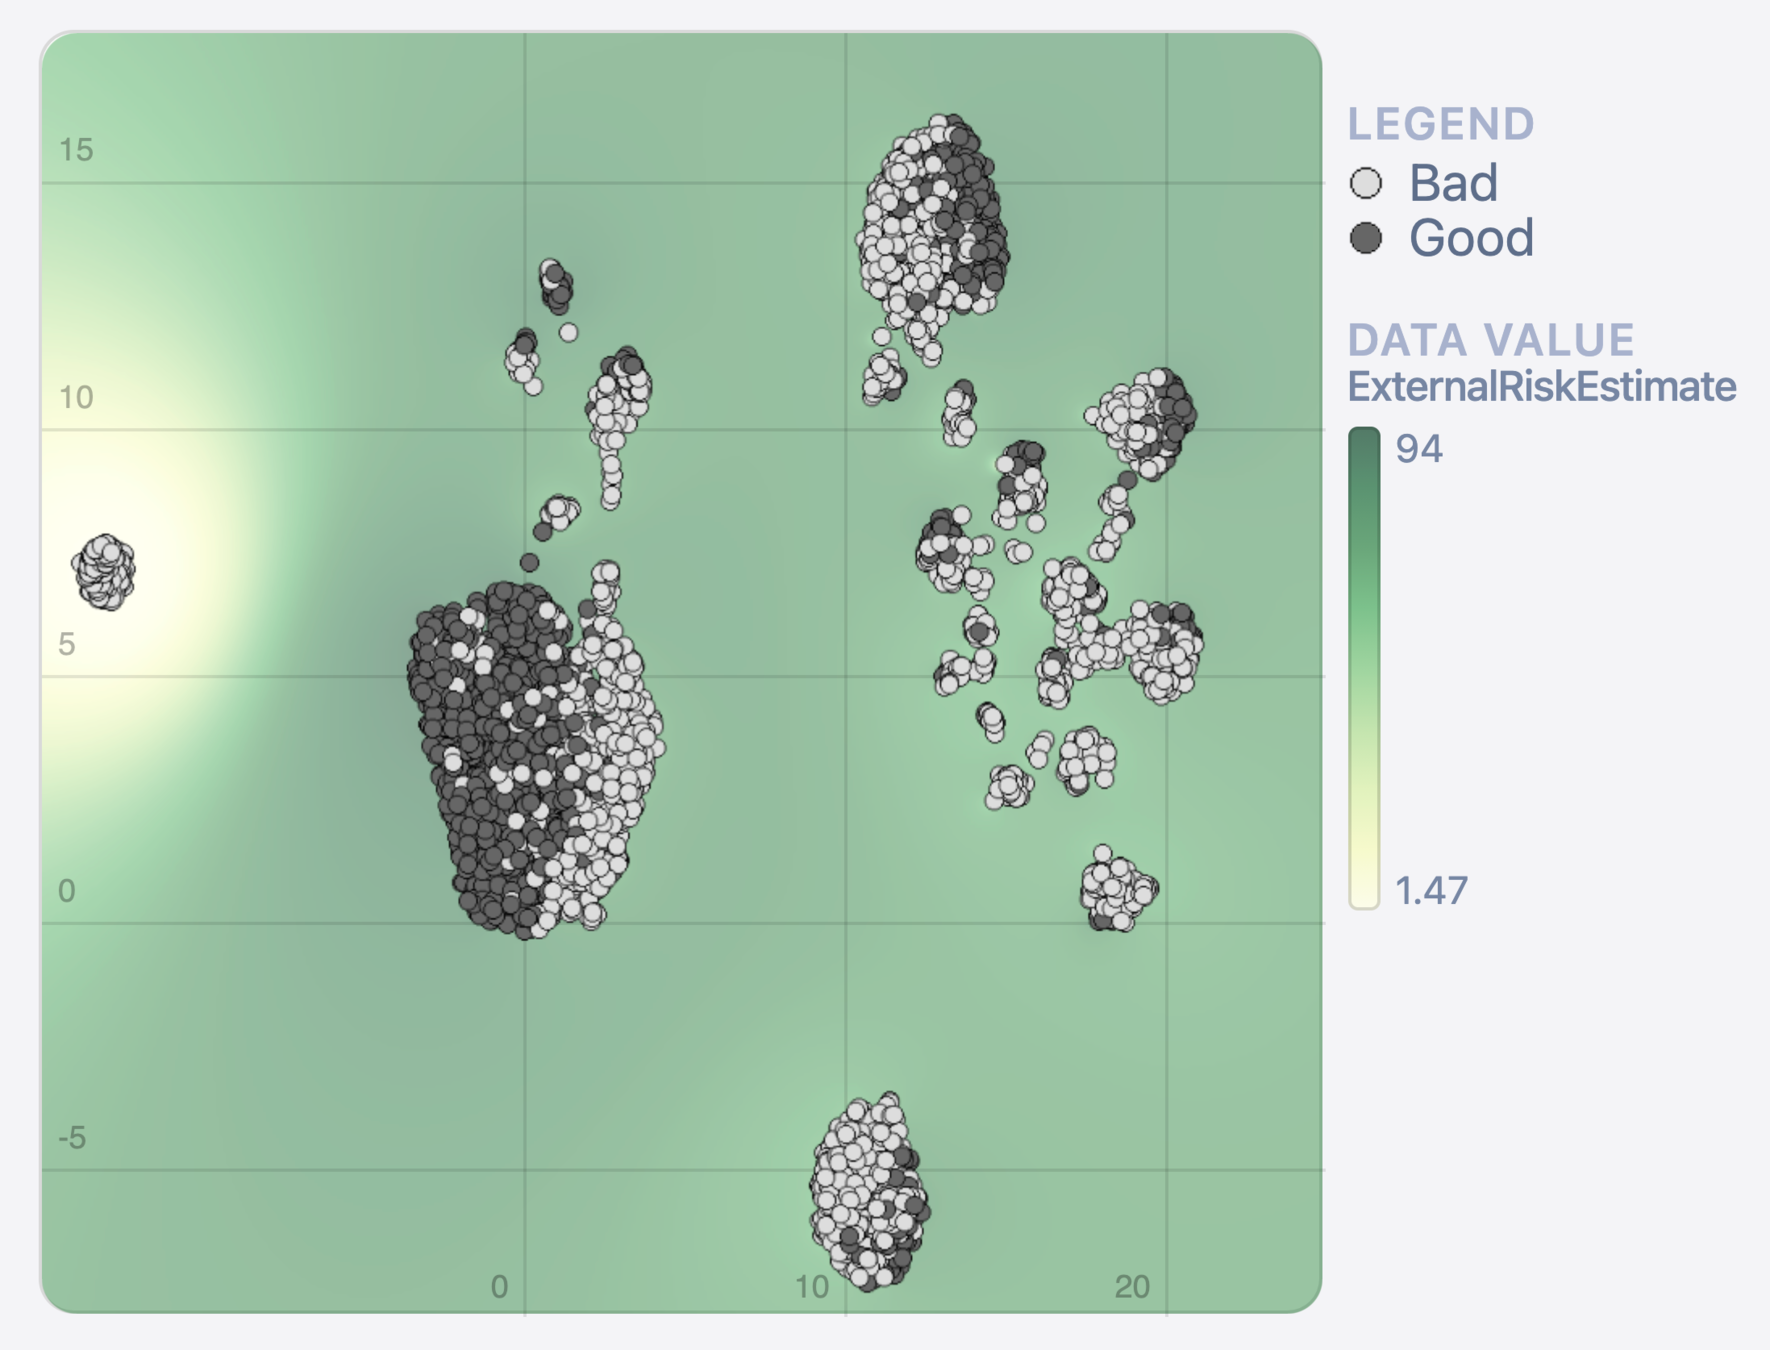
Data
Model
What?
Method 2: Density plots
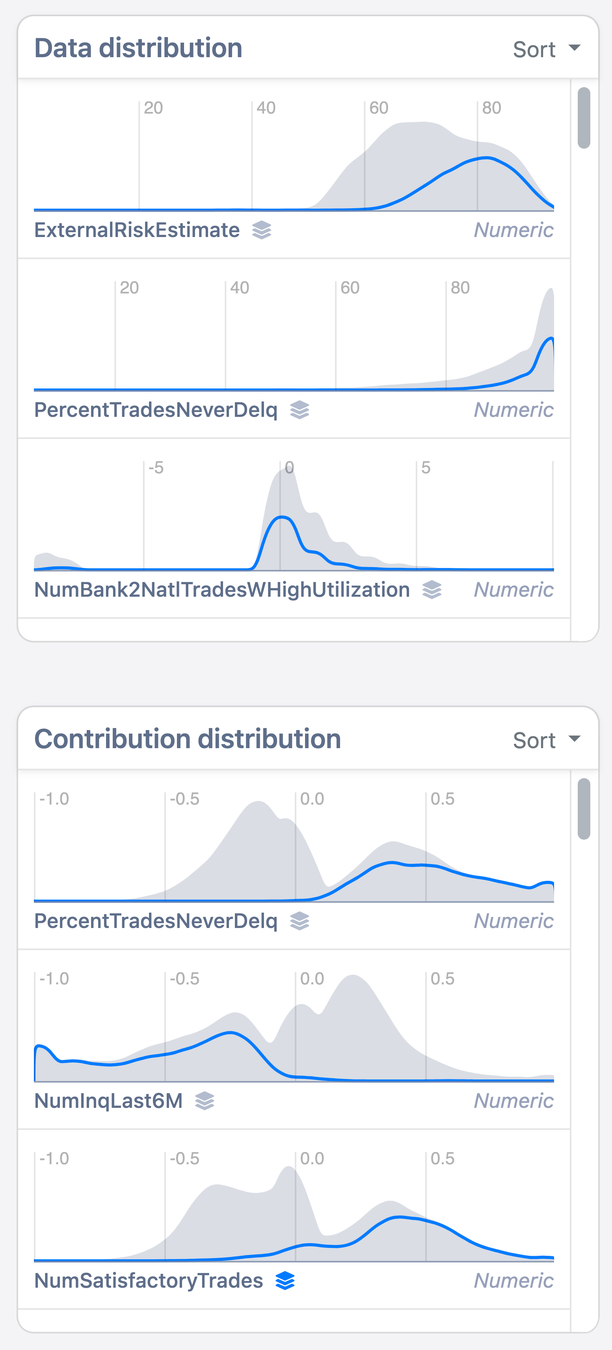
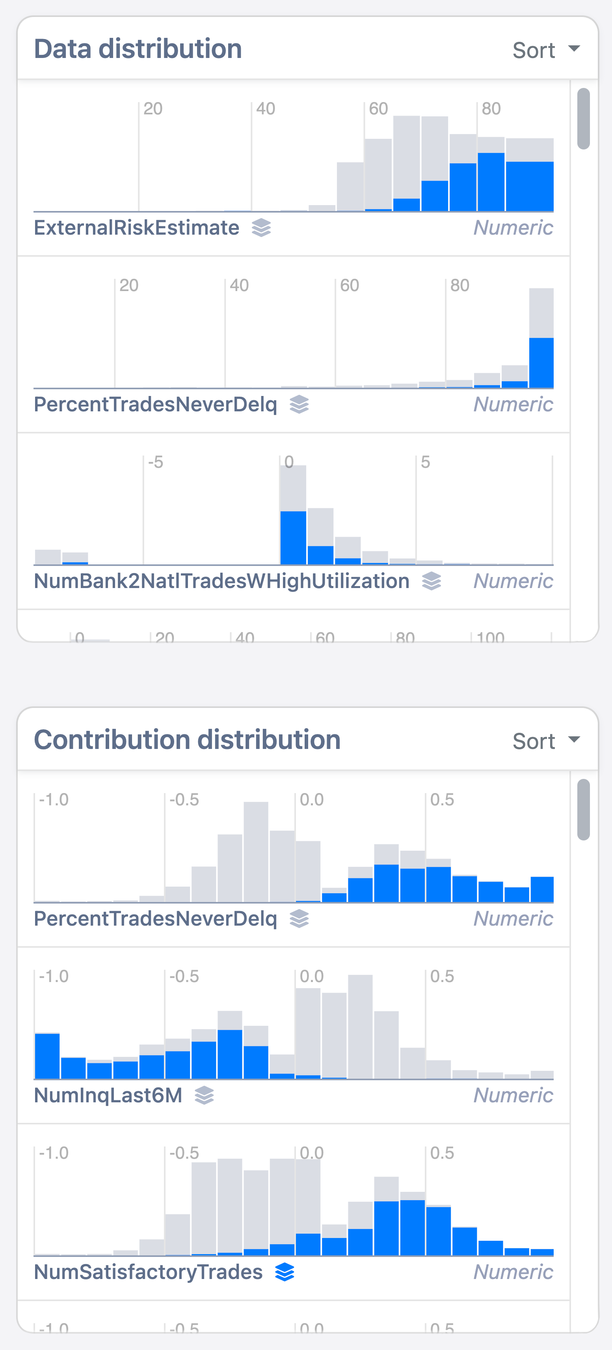
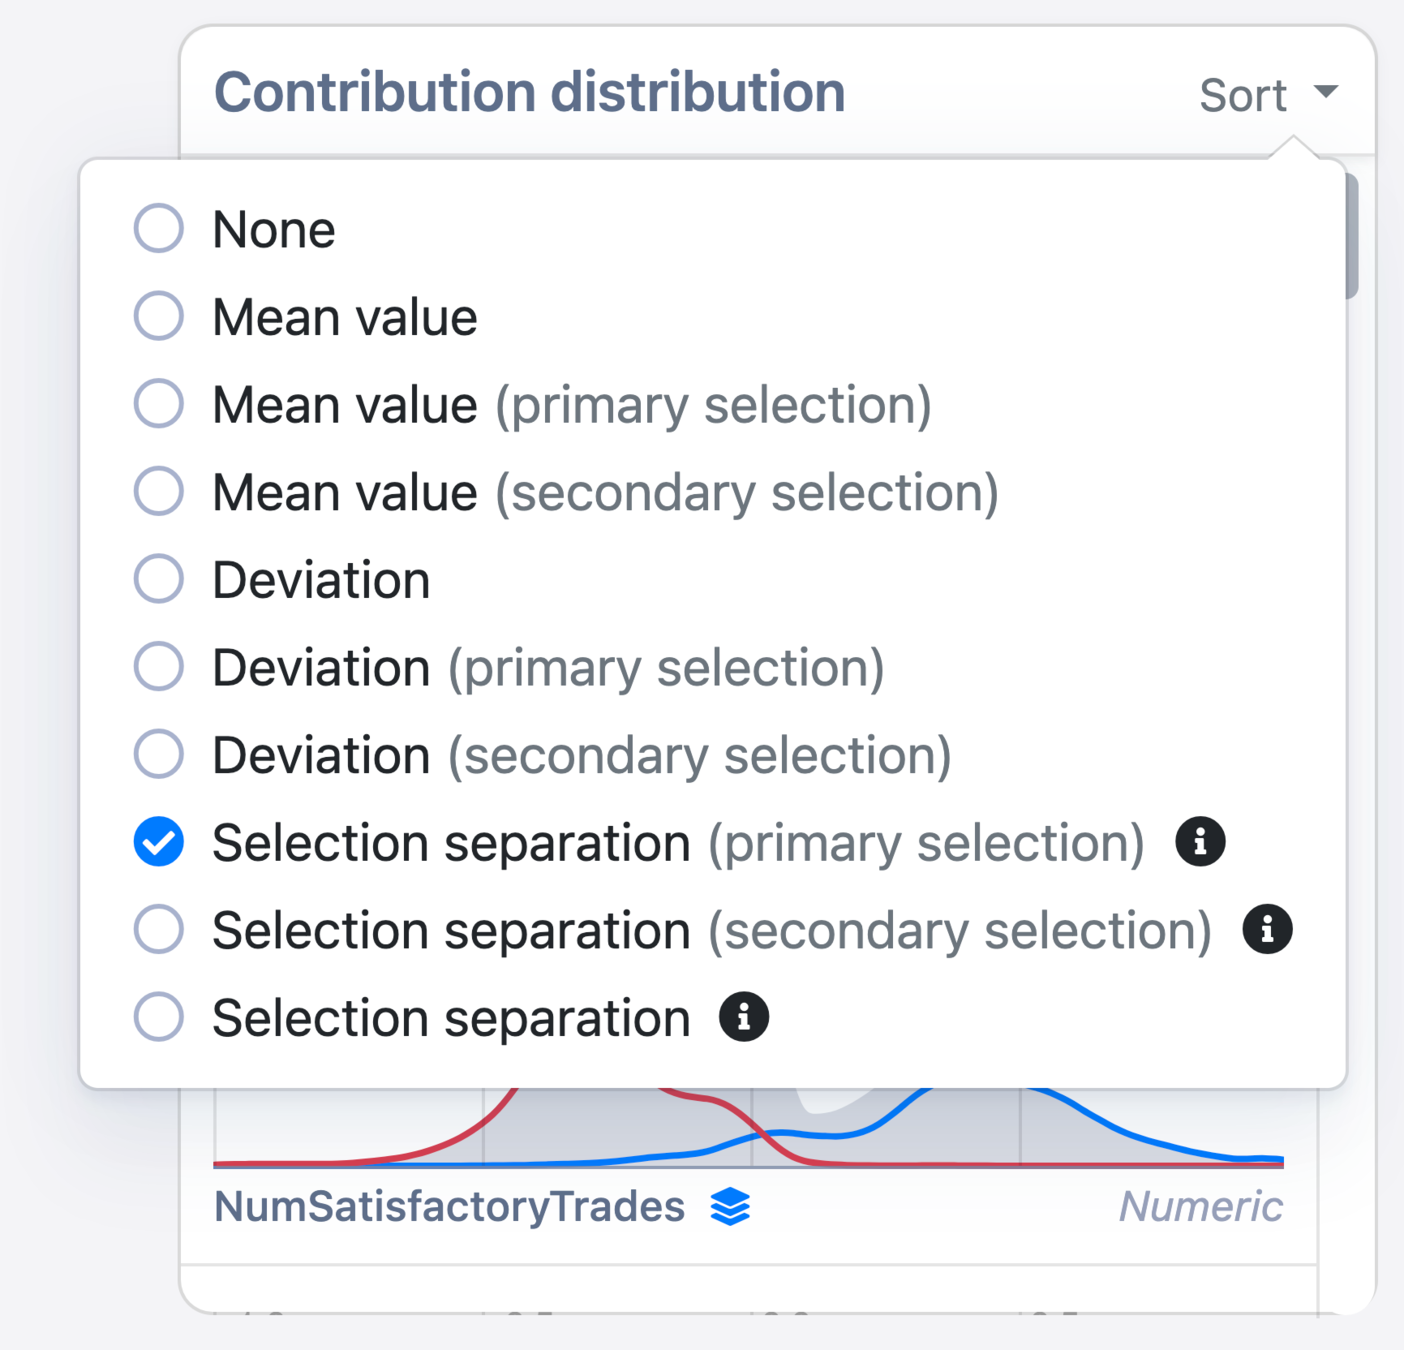
Data
Model
All data
Selection
What?
Method 3: Decision trees
Saved clusters →
DT for selected cluster →
Performance comparison →
What?
Demo of the system
| ID | Name | Age | Sex | Product | Branch | Risk? |
|---|---|---|---|---|---|---|
| 1 | Alice | 28 | F | Health | Zekur | - |
| 2 | Bob | 57 | M | Car | FBTO | - |
| 3 | Charlie | 34 | M | Life | Interpolis | ✓ |
| ... | ... | ... | ... | ... | ... | ... |