Model based tesing
presentation by Iryna Volnykh 🌝
Model-based testing
is a type of software testing method that uses a system’s model under test to generate test cases.
A model is a description of a system’s behavior.
Behavior can be described in terms of
It should be practically understandable and can be reusable, shareable must have a precise description of the system under test.
🔤 input sequences
🥊 actions
🤷♀️ conditions
🎖️ output
🌊 flow of data from input to output.
There are numerous models available, and it describes different aspects of the system behavior.
Examples of such models are:
Data Flow and Control Flow
Decision Tables
State transition
Dependency Graphs
UML (Unified Modeling Language)
There are numerous models available, and it describes different aspects of the system behavior.
Examples of such models are:
Data Flow and Control Flow
Decision Tables
State transition
Dependency Graphs - next workshop, probably🧐
UML (Unified Modeling Language) - next workshop, probably🧐
There are numerous models available, and it describes different aspects of the system behavior.
Examples of the model are:
👉 Data Flow and Control Flow
Decision Tables
State transition
Dependency Graphs
Data Flow refers to the movement and transformation of data within a system.
It describes how data enters the system, is processed, and eventually exits or is stored.
Data Flow is essential for understanding how information is handled and manipulated by different components or processes in a system.
Purpose:
🤖 To visualize and document how data moves through a system.
🤖 To identify and analyze data processing steps and interactions.
Key aspects:
▭ Processes: actions or functions that transform data.
▭ Data sources: origins of data entering the system.
▭ Data stores: locations where data is held for future use.
⇾ Data flows: arrows indicating the direction of data movement between processes, data sources, and data stores.
👉 Data Flow: example

There are numerous models available, and it describes different aspects of the system behavior.
Examples of the model are:
👉 Data Flow and Control Flow
Decision Tables
State transition
Dependency Graphs
Control Flow represents the sequence and decision-making processes within a system or program. It describes the order in which different operations or processes are executed, including conditional logic and loops.
It helps to document and visualize the order of operations and decision-making processes and analyze and design the control logic and flow of a system or program.
Key aspects:
▭ Processes: actions or functions that transform data.
⬦Decision Points: Points where decisions are made based on conditions, often depicted as diamonds (e.g., "Is the input valid?").
⇾ Loops: Repetitive sequences of operations that occur based on certain conditions.
⇾ Sequential Flow: The order in which processes or actions are executed.
dots - start and the finish
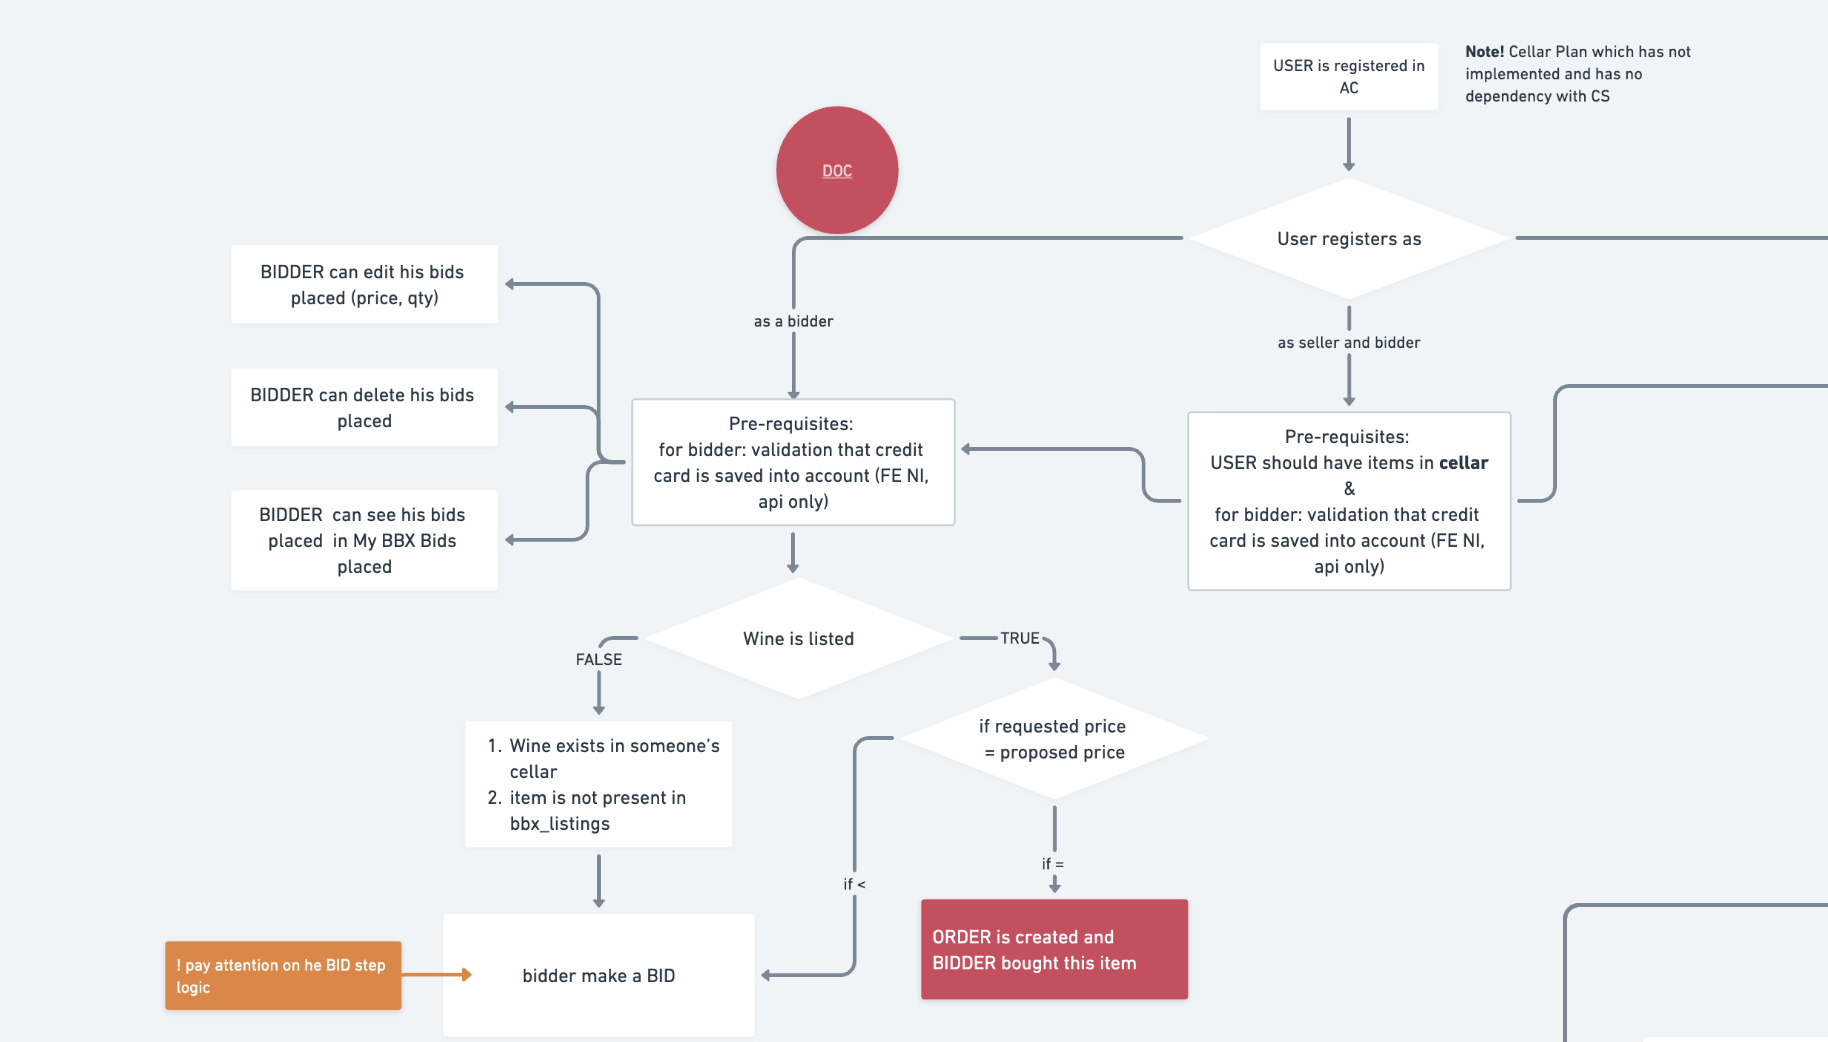
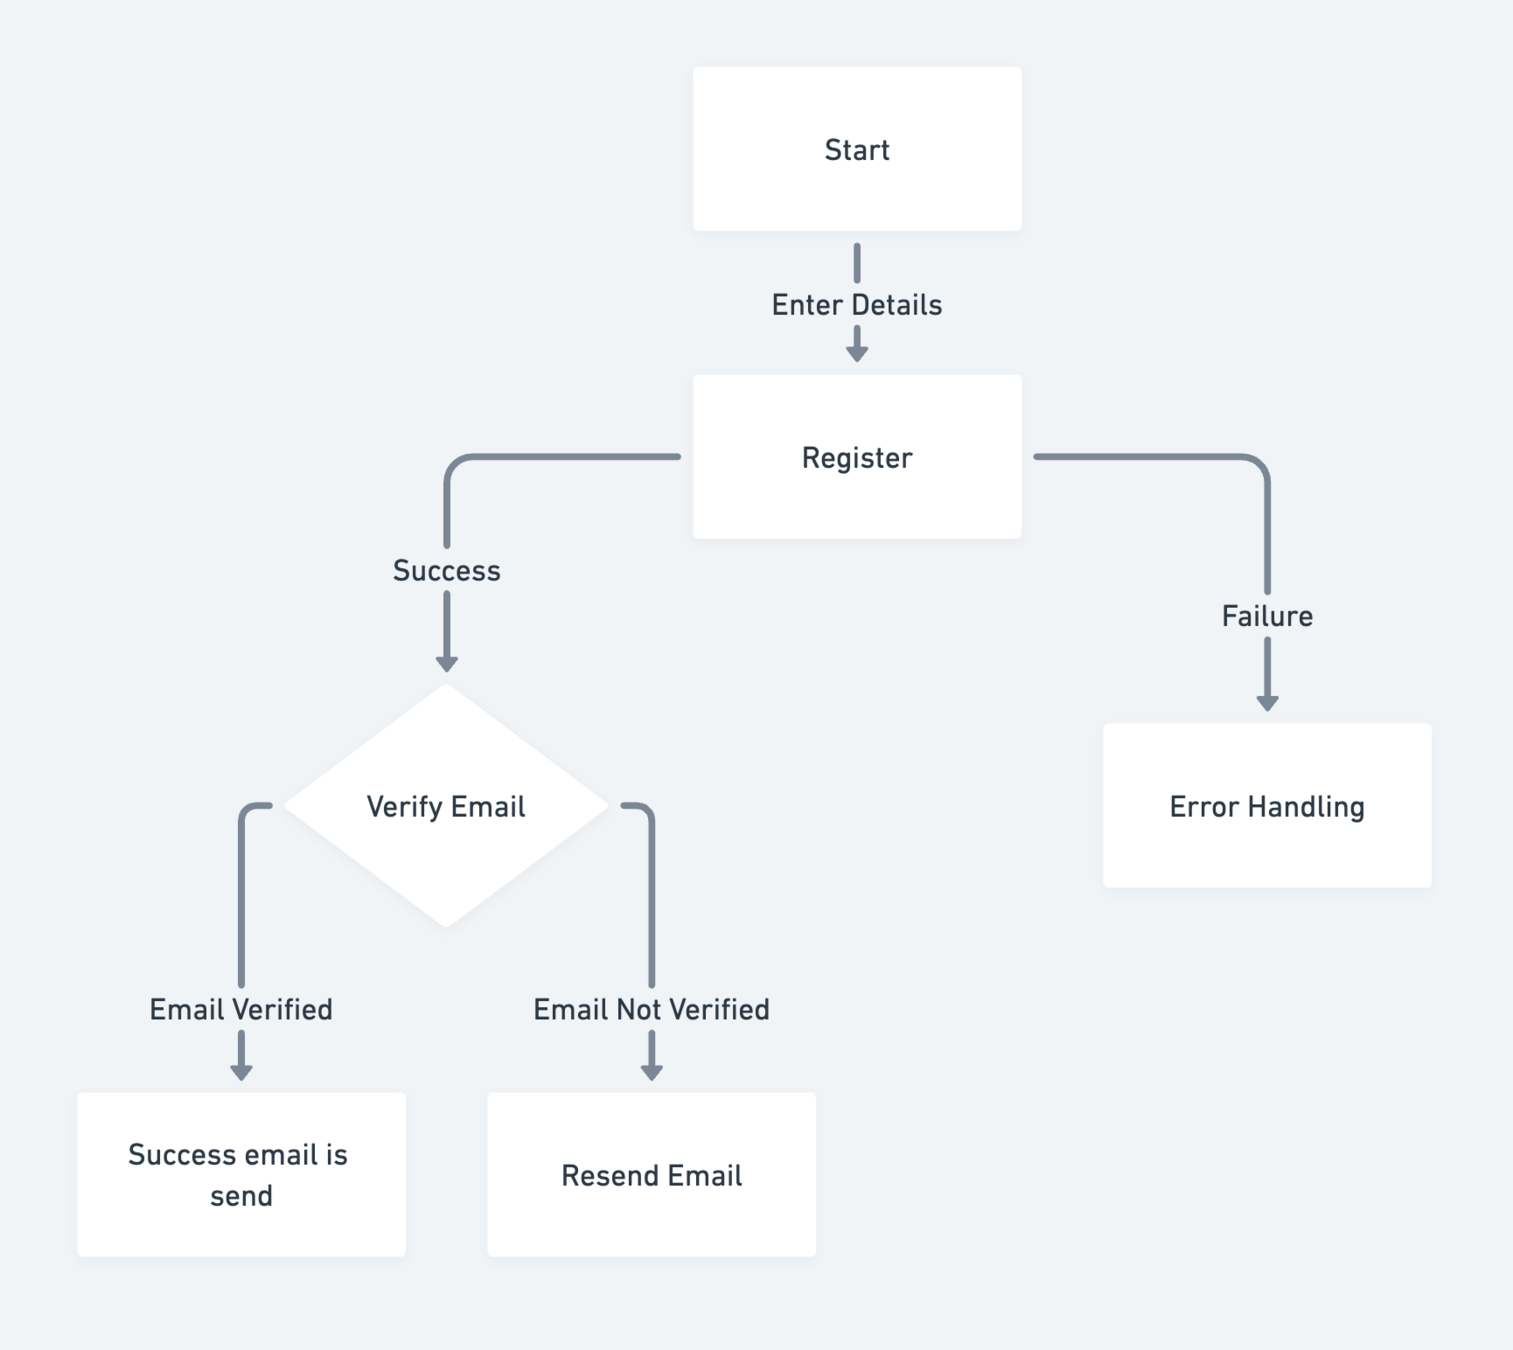
👉 Control Flow: example
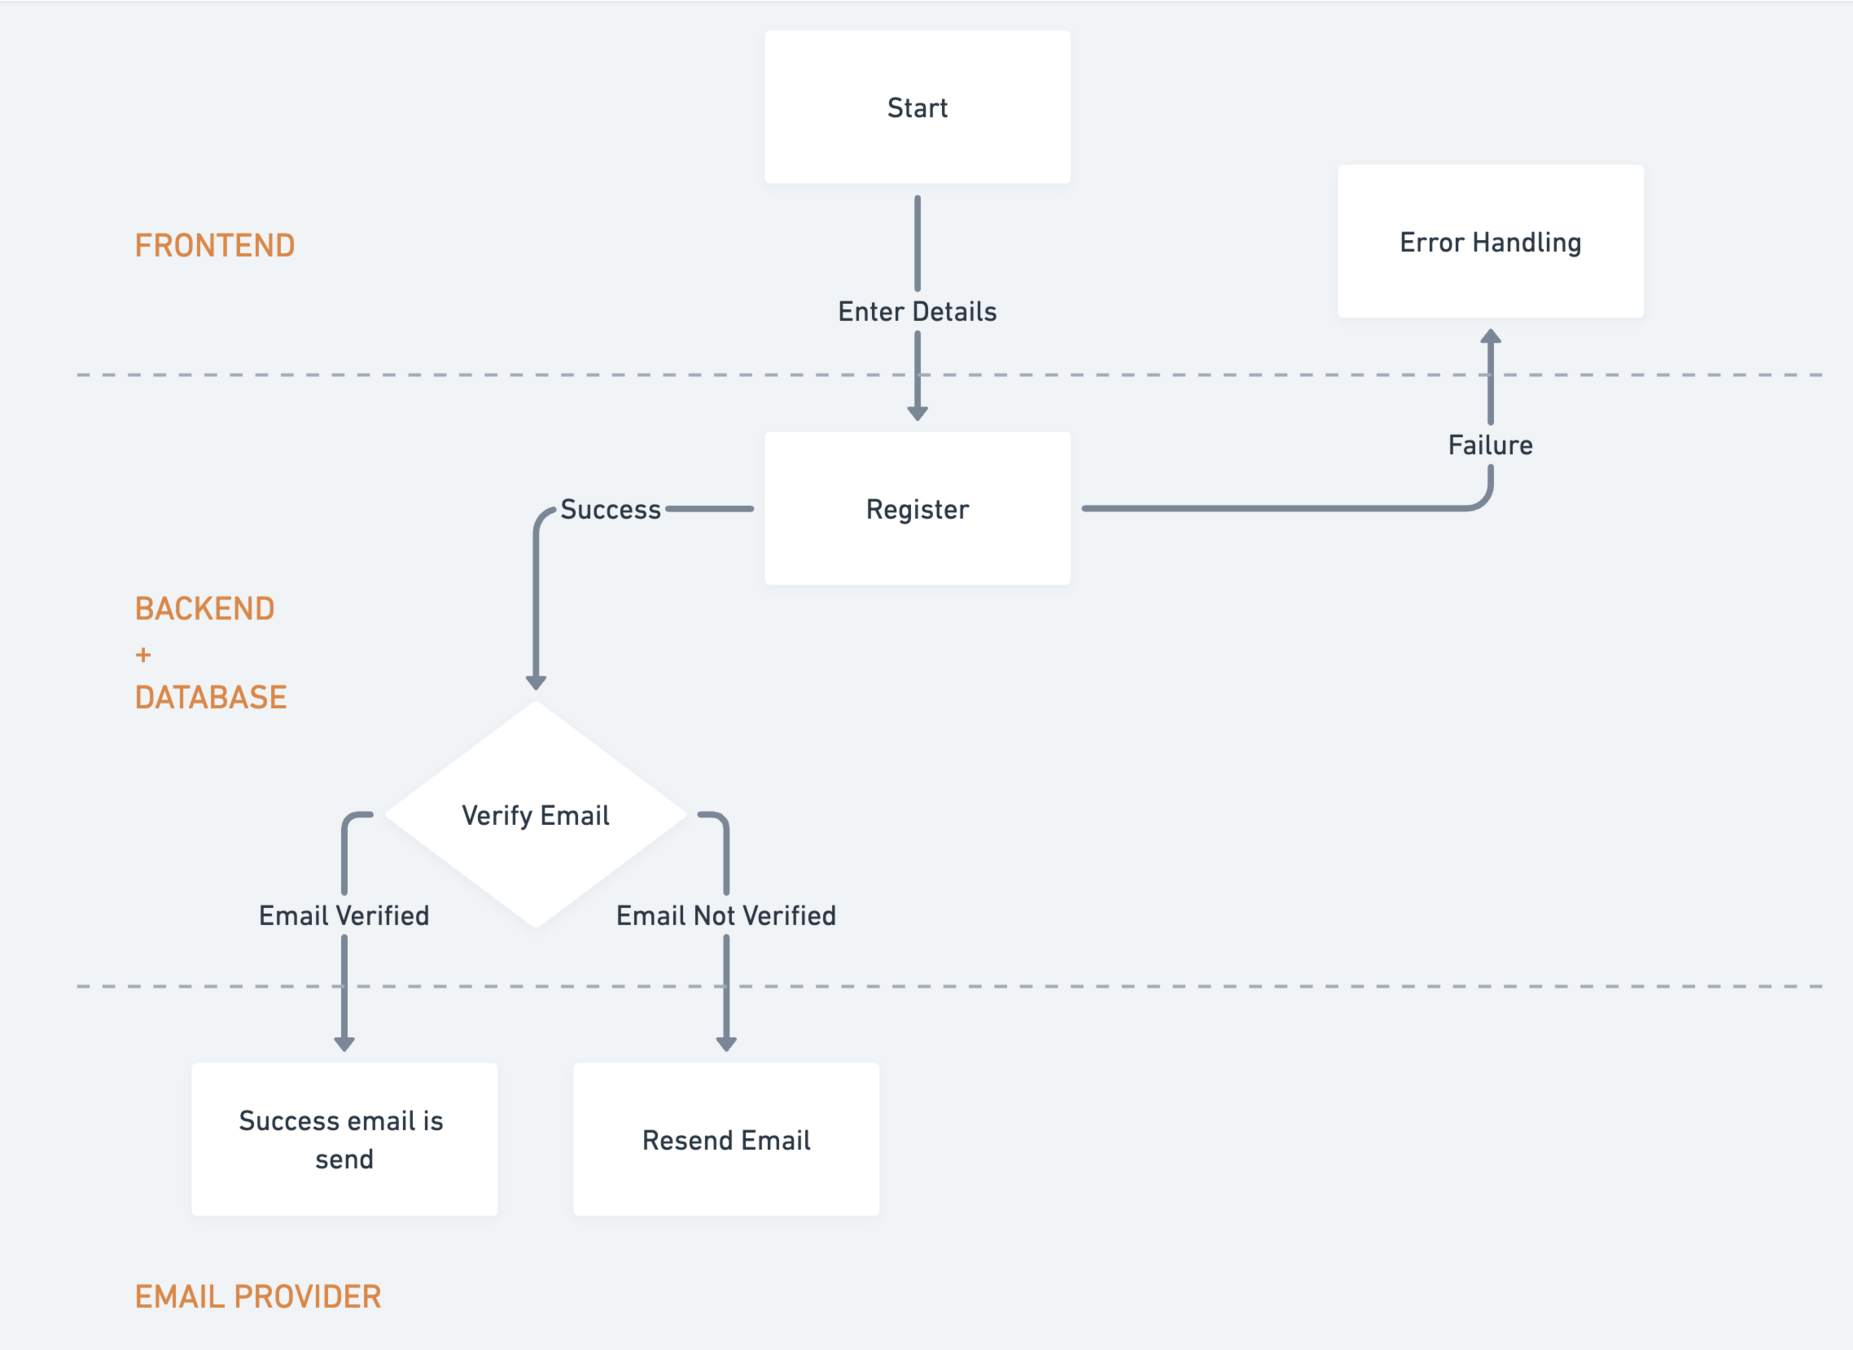
👉 Control Flow: example with layered systems
Both Data Flow and Control Flow diagrams are critical for system design and analysis, but they focus on different aspects:
---> Data Flow on the movement and transformation of data
---> Control Flow on the execution and logic of processes.
TASK 1: CONTROL FLOW DIAGRAM:
https://whimsical.com/task-1-control-flow-diagram-AXdo4R6fWmsUrfWhi8C5Lp
TASK 2: CONTROL FLOW DIAGRAM
https://whimsical.com/workshop-VhFQHTgK61Sjwik6Pc4wwq
TASK 3: DATA FLOW DIAGRAM
https://whimsical.com/task-3-data-flow-diagram-PrB9wzS3FFmUNM4QLoXgmQ
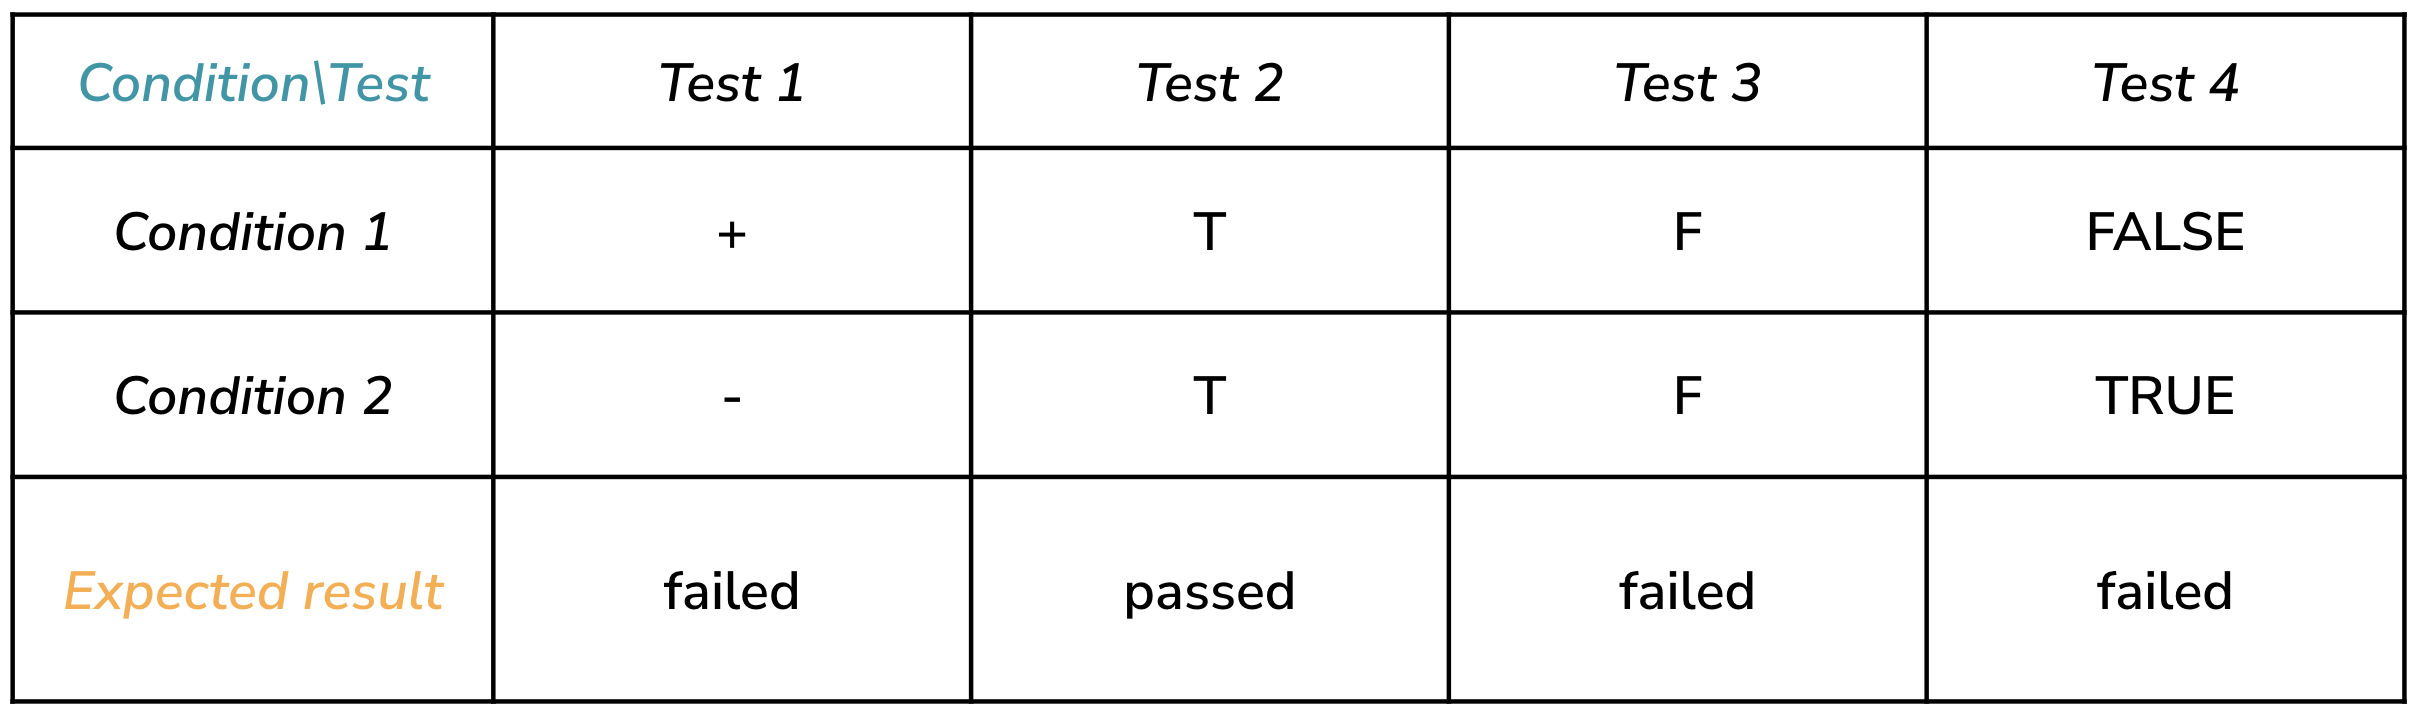
👉 Decision table is one of the black box test design techniques.
The decision-making table (decision table) is a way of easy made presentation of a model with complex logic where the connection between conditions and actions is established. And a schematic demonstration of logic is known as a causal graph.
A visual representation is used to obtain a decision table.
No. Of combinations = No. Of condition 1 values * No. Of condition 2 values
No. Of combinations = 2 ^ No. Of True/False conditions (in case we have only True/False conditions)
👉 Decision table example:
We have to test all possible successful, declined and pending statuses for all payment methods.
Conditions:
User:
1) registered
2) guest
3) registered but making an order as a guest
(registered guest)
Payment:
1) Debit card
2) Saved card
3) Google pay
4) ApplePay
Status:
1) successful
2) declined
3) pending
No. Of combinations = No. Of condition 1 values * No. Of condition 2 values
No. Of combinations = 2 ^ No. Of True/False conditions (in case we have only True/False conditions)
No. Of combinations (TESTs) 36 = 3 (User condition) * 4 (Payment condition) * = 3 (status condition)
No. Of combinations = 2 ^ No. Of True/False conditions (in case we have only True/False conditions)
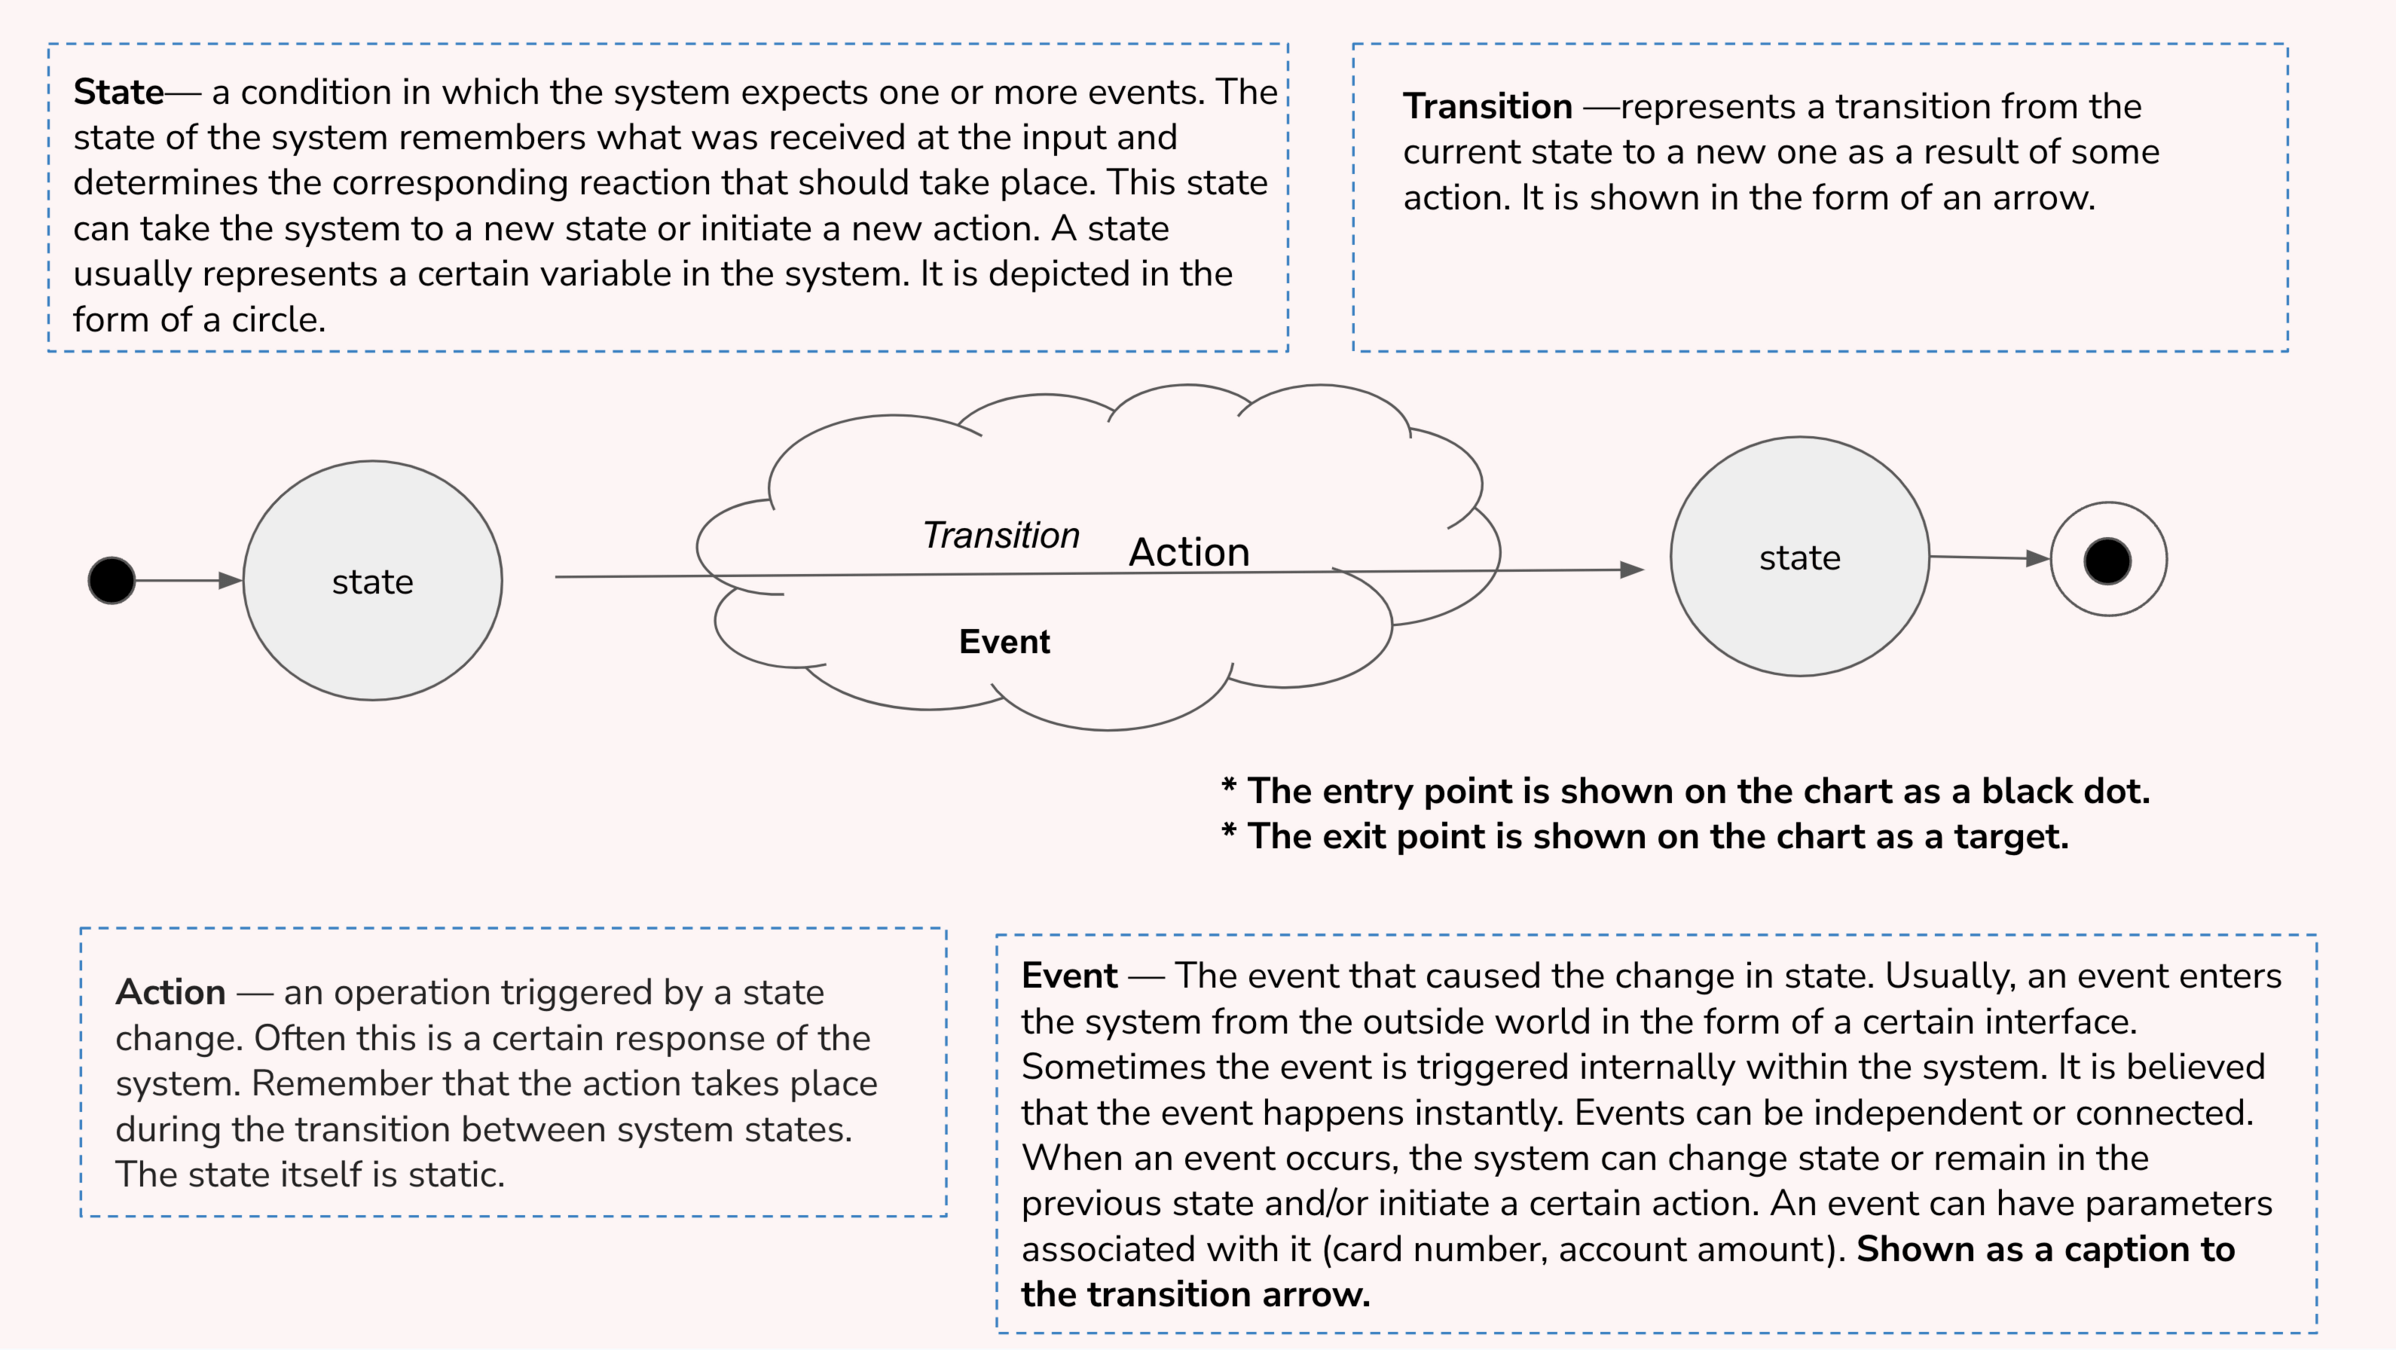
State transition diagram testing is one of the black box test design techniques, based on the concept that a system can be defined as a set of states, and the transition from one state to another occurs as a result of some event.
State Transition Testing — development of tests using the black box method, when test scenarios are built based on the execution of correct and incorrect state transitions.
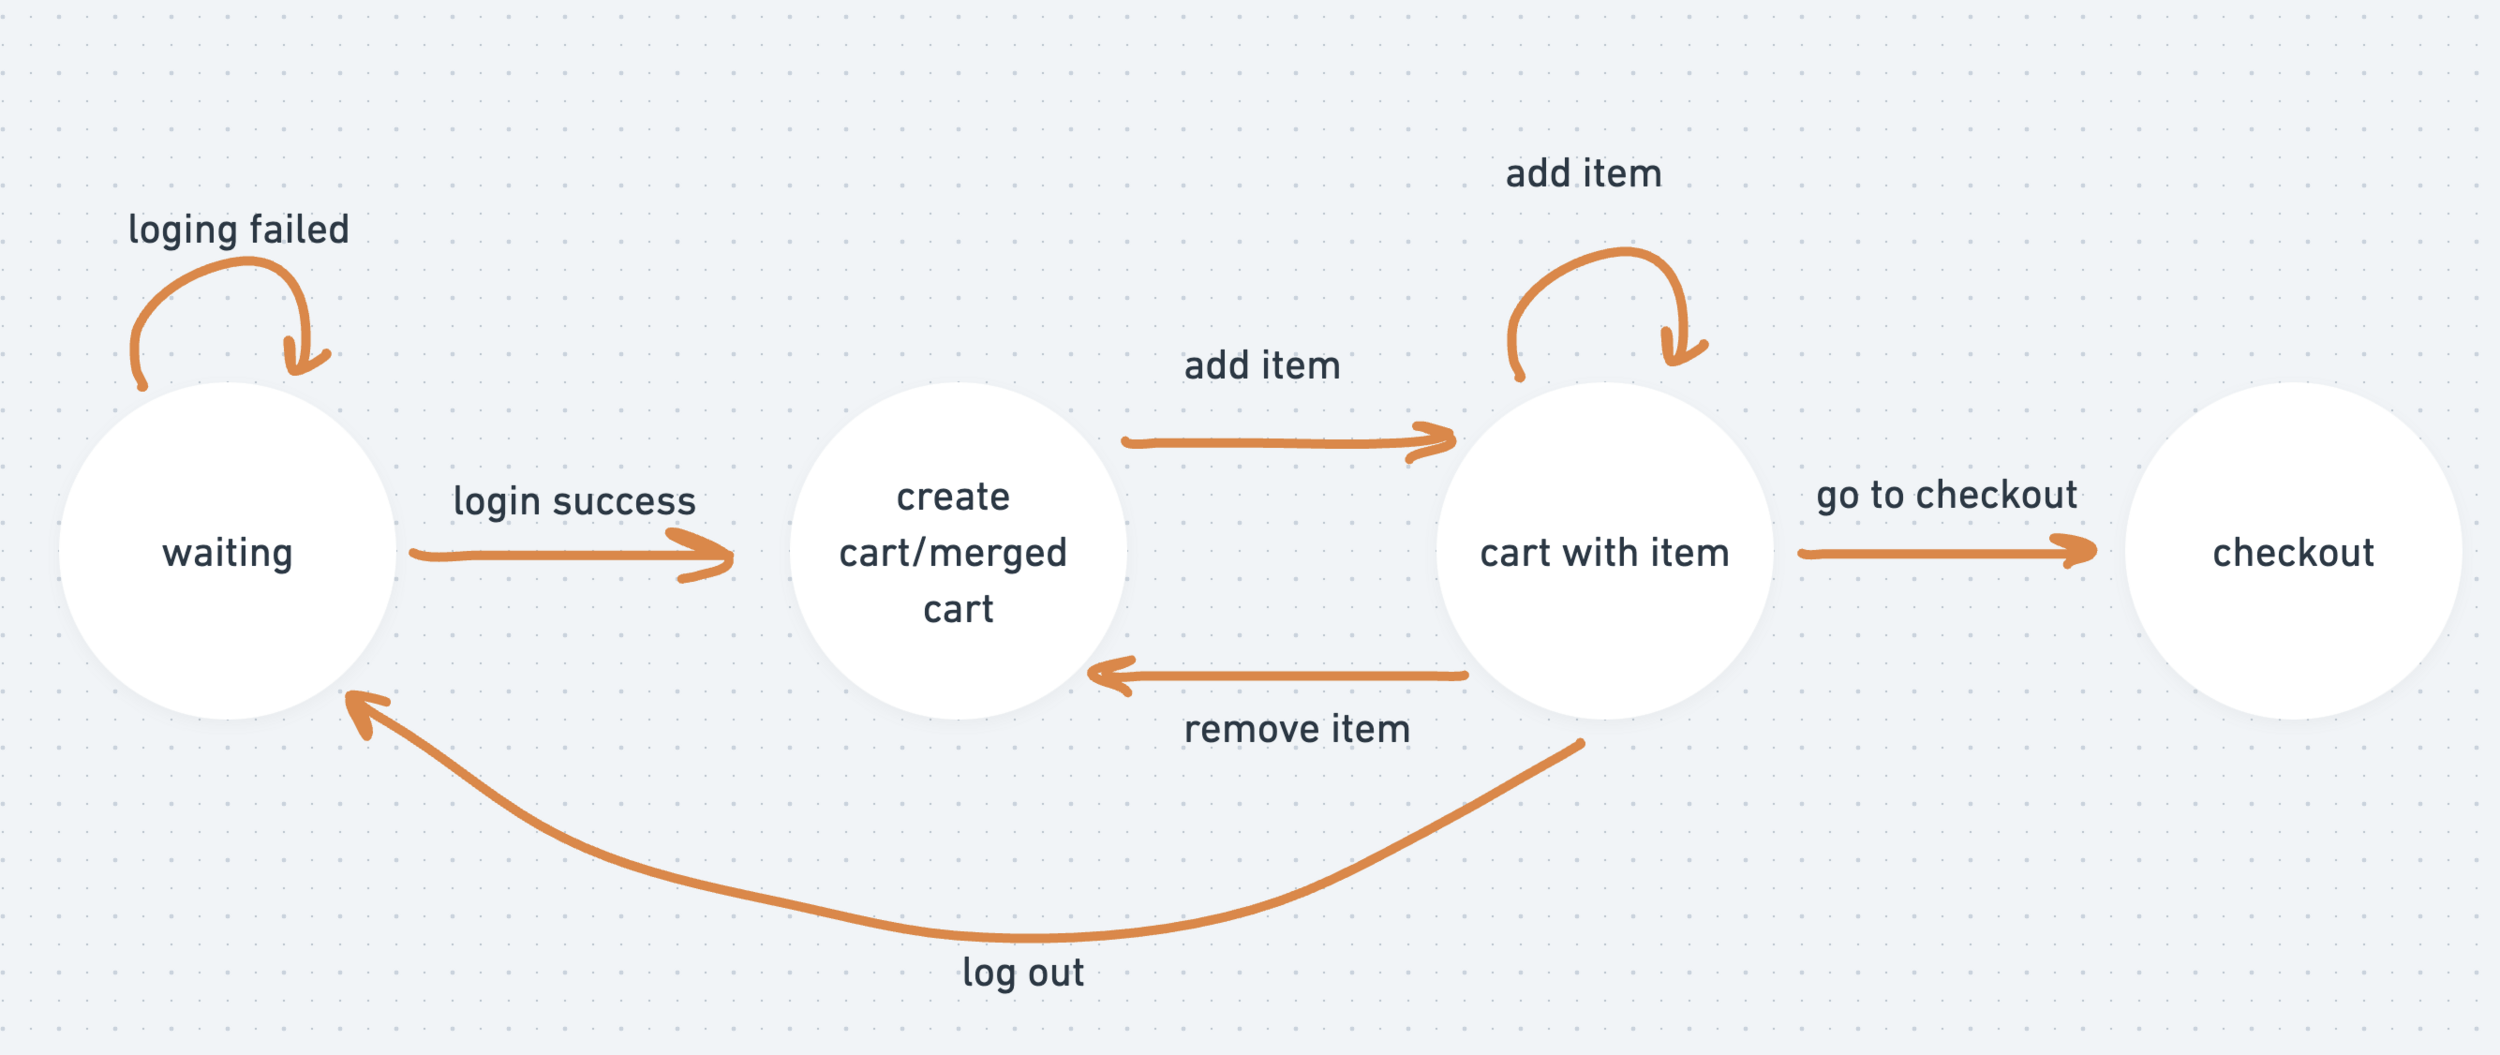
State transition diagram Example:
Useful links
👽 Sequence Diagrams | Unified Modeling Language (UML) : https://www.geeksforgeeks.org/unified-modeling-language-uml-sequence-diagrams/
☠️ Adobe examples: https://experienceleague.adobe.com/en/docs/commerce-operations/security-and-compliance/reference/data-m2
🤖 What is Model Based Testing? Guru99: https://www.guru99.com/model-based-testing-tutorial.html
Thank you!