Workflow Browser
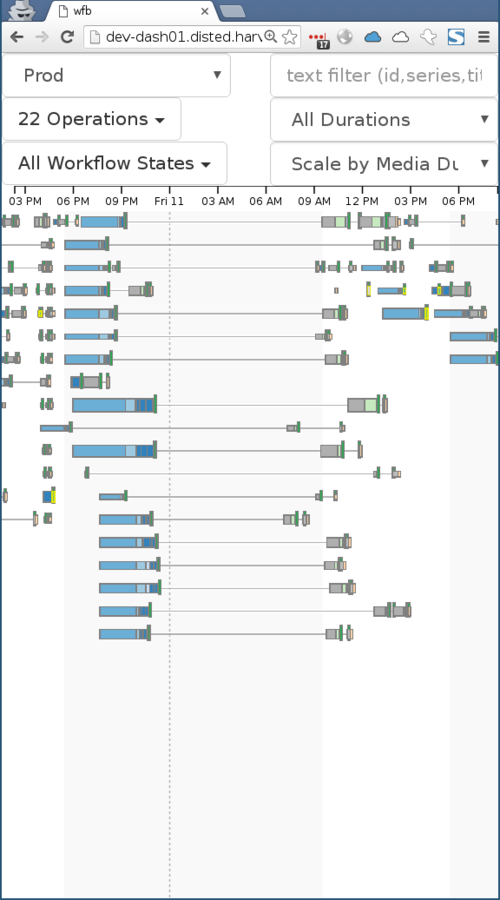
- d3-based workflow visualization
- Each workflow rendered as a timeline showing duration of individual operations
- Pan, zoom and filter
- Mouse-over operations to display details
- Goal was to allow visual id of problem workflows and/or operations
WPI Dashboard
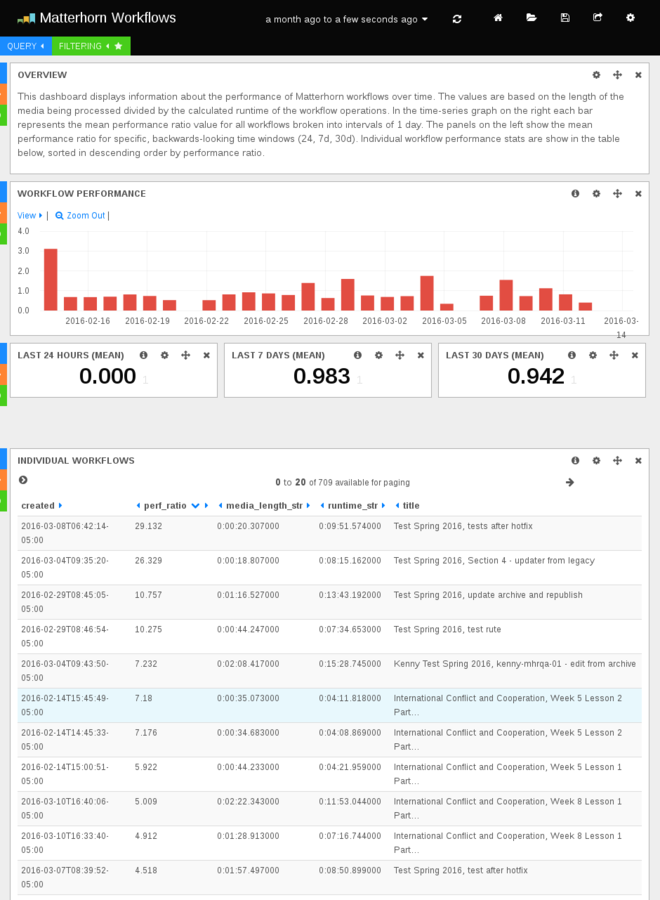
- Workflow Performance Index
- WPI = media length divided by workflow run time
- run time calculation excludes operations not related to actual video production
- Time-series graphs of active user sessions
- Filter by live vs on demand, identified vs anonymous
- Top terms: course, IP address, browser, device, OS
- User location mapping based on geoip lookups
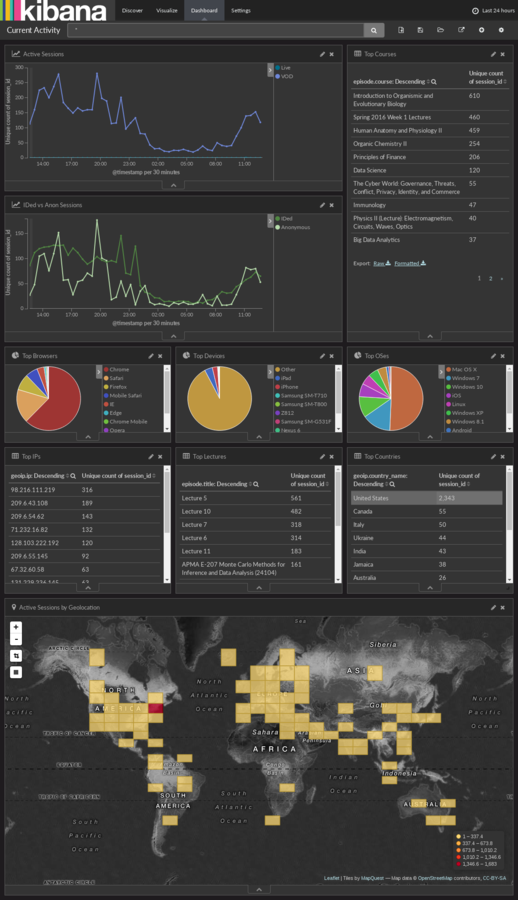
User Activity
Dashboard
user session dashboard demo