CryptoSandra
IE,Sandra Becker, 05/2018 MAD
CryptoSandra
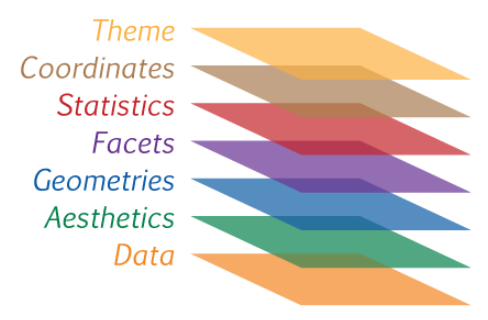
WHAT IS GGPLOT2?
SESSION01
CryptoSandra
"A GRAMMAR OF GRAPHICS IS A TOOL THAT EN ABLES US TO CONCISELY DESCRIBE THE COMPONENTS OF A GRAPHIC . "
HADLY WICKHAM

SESSION01
CryptoSandra
SESSION01
CryptoSandra
HOW TO LEARN GGPLOT2?
SESSION01
CryptoSandra
SEARCH
TRY OUT
SESSION01
CryptoSandra
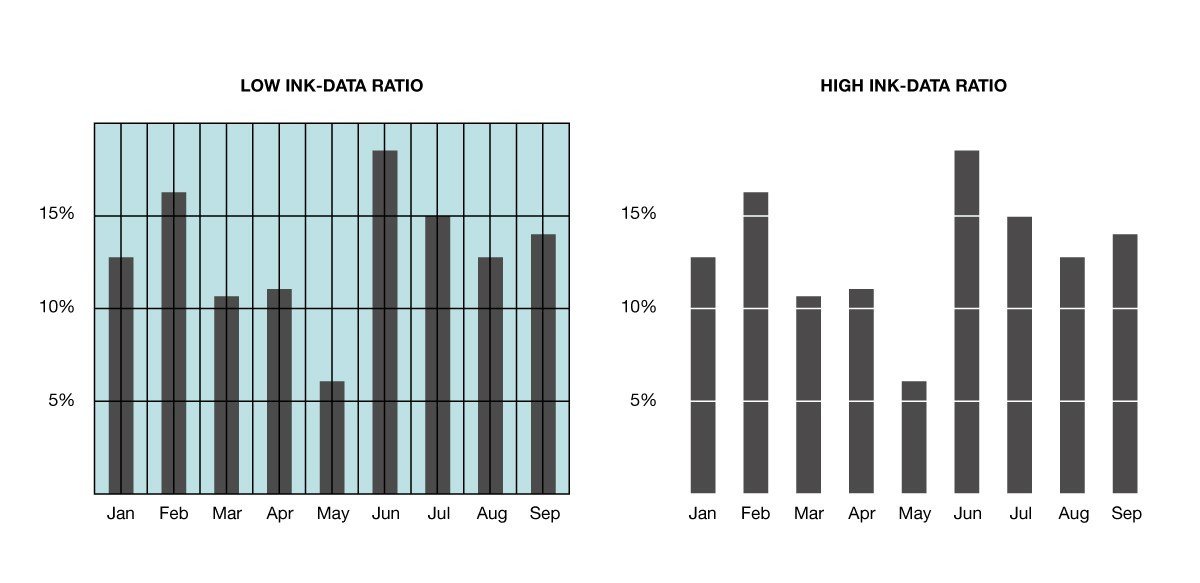
"EXCELLENCE IN STATISTIC GRAPHS CONSISTS OF COMPLEX IDEAS COMMUNICATED WITH CLARITY, PRECISION AND EFFICIENCY ." "
EDWARD R. TUFTE
SESSION01
CryptoSandra
BASIC CHARTS
SESSION02
CryptoSandra
SESSION02
ggplot(diamonds, aes(x=carat, y=price)) +
  geom_point(color="blue")
BASIC GRAPHIC
CryptoSandra
SESSION02
ggplot(diamonds, aes(x=carat, y=price, color=cut)) +
  scale_colour_brewer(palette = "Accent") +
  geom_point(size=0.5)

COLORS
CryptoSandra
SESSION02
ggplot(diamonds, aes(x=carat, y=price, color=cut)) +
  scale_colour_brewer(palette = "Accent") +
  geom_point(size=0.02, alpha=0.09) +
  facet_wrap(color ~ cut)
SMALL MULTIPLES

CryptoSandra
TUFTE IN R"
SESSION03
CryptoSandra
CryptoSandra
SESSION03
CryptoSandra
theme_tufte(base_size = 11, base_family = "serif", ticks = TRUE)TUFTE THEME
SESSION03
CryptoSandra
CryptoSandra

SESSION03
CryptoSandra
TUFTE BOX PLOT
SESSION03
CryptoSandra
CryptoSandra
The Visual Display of Quantitative Information,P.118

SESSION03
CryptoSandra
CryptoSandra
library(ggthemes)
library(ggplot2)

ggplot(quakes, aes(factor(mag),stations)) +
  theme_tufte(base_size = 7, ticks=F) +
  geom_tufteboxplot(outlier.colour="transparent", color= "blue") +
  theme(axis.title=element_blank()) +
  annotate("text", x = 8, y = 120, adj=1,  family="serif", label = c(""))
SESSION03
CryptoSandra
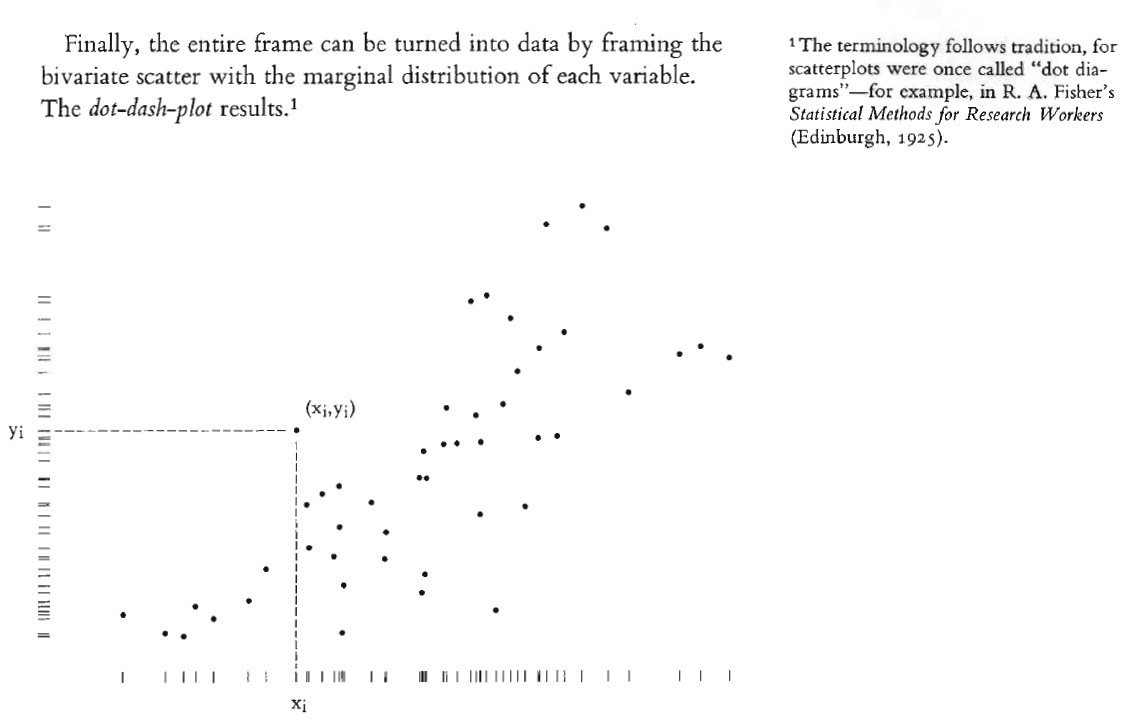
DOT DASH PLOT
SESSION03
CryptoSandra
CryptoSandra
The Visual Display of Quantitative Information,P.128
SESSION03
CryptoSandra
CryptoSandra

library(ggthemes)
library(ggplot2)

ggplot(diamonds, aes(carat, price)) +
  geom_point(size=0.02, alpha=0.09, color="blue") +
  geom_rug(size=0.03, alpha=0.08, color="blue") +
  theme_tufte(base_size = 5, ticks=F) +
xlab("") + ylab("")SESSION03
CryptoSandra
MINIMAL LINE CHART
SESSION03
CryptoSandra
CryptoSandra

The Visual Display of Quantitative Information,P.68
SESSION03
CryptoSandra
CryptoSandra

library(ggthemes)
library(ggplot2)

x <- 1967:1977
y <- c(0.5,1.8,4.6,5.3,5.3,5.7,5.4,5,5.5,6,5)
d <- data.frame(x, y)

ggplot(d, aes(x,y)) +
  geom_line(size=0.5, color="blue") +
  geom_point(size=1, color="blue") +
  theme_tufte(ticks = FALSE, base_size = 8) +
  theme(axis.title=element_blank()) +
  geom_hline(yintercept = c(5,6), lty=2, size=0.2) +
  scale_y_continuous(breaks=seq(1, 6, 1), label=sprintf("$%s",seq(300,400,20))) +
  scale_x_continuous(breaks=x,label=x) +
  annotate("text", x = c(1977,1977.2), y = c(1.5,5.5), adj=1,  family="serif",
label = c("Per capita\nbudget expandures\nin constant dollars", "5%"), size=3)SESSION03
CryptoSandra
SESSION04
NEW TYPES
CryptoSandra
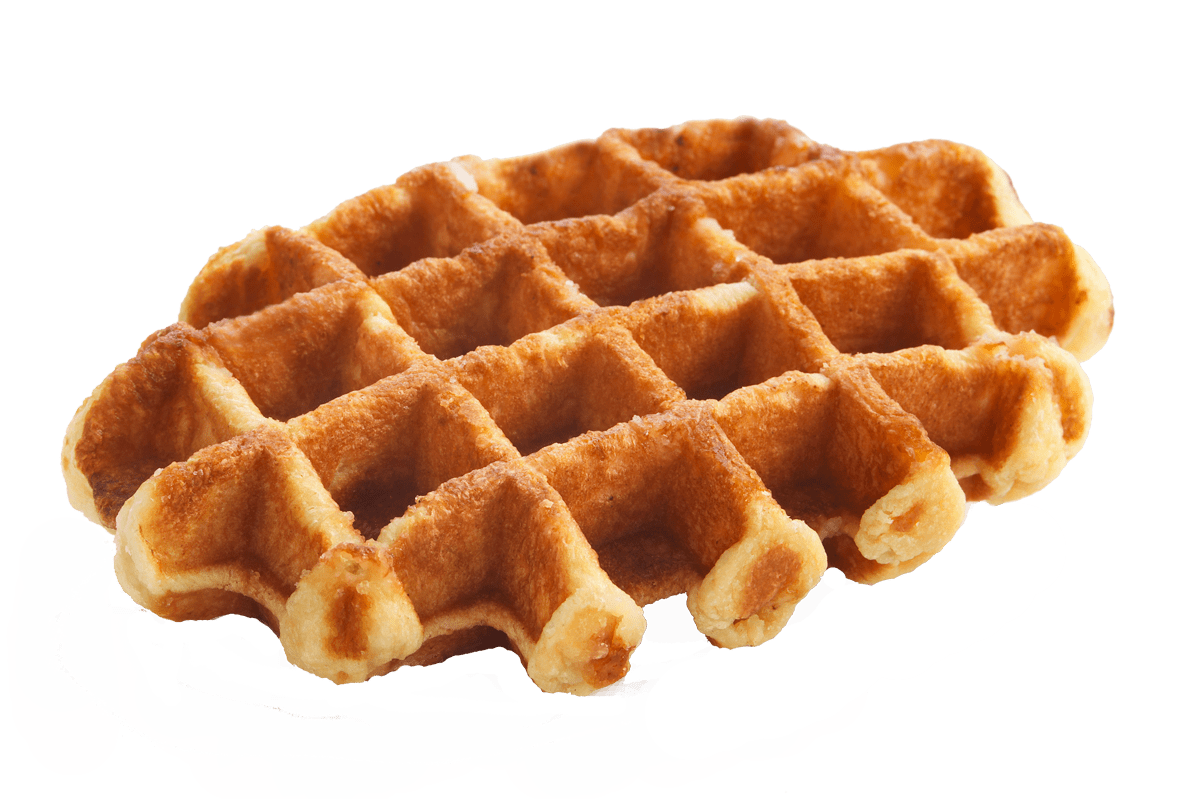
NO PIE BUT A WAFFLE.
SESSION04
CryptoSandra
CryptoSandra

library(waffle)

pain.adult.1997 <- c(`YOY (406)` = 406, `Adult (24)` = 24)
waffle(
  pain.adult.1997 / 2, rows = 7, size = 0.5,
  colors = c("steelblue", "grey"),
  title = "Paine Run Brook Trout Abundance (1997)",
) -> A

pine.adult.1997 <- c(`YOY (221)` = 221, `Adult (143)` = 143)
waffle(
  pine.adult.1997 / 2, rows = 7, size = 0.5,
  colors = c("steelblue", "grey"),
  title = "Piney River Brook Trout Abundance (1997)",
  xlab = "1 square = 2 fish", pad = 8
) -> B

stan.adult.1997 <- c(`YOY (270)` = 270, `Adult (197)` = 197)
waffle(
  stan.adult.1997 / 2, rows = 7, size = 0.5,
  colors = c("steelblue", "grey"),
  title = "Staunton River Trout Abundance (1997)",
  xlab = "1 square = 2 fish"
) -> C

iron(A, B, C)
SESSION04
CryptoSandra
BEST PRACTICE
SESSION04

CryptoSandra

LET'S ADD A DUMBBELL
SESSION04
CryptoSandra
CryptoSandra
library(dplyr)
library(tidyr)
library(scales)
library(ggplot2)
library(ggalt)

ggplot(health3, aes(x=pct_2014, xend=pct_2013, y=area_name, group=area_name)) +
  geom_dumbbell(colour="steelblue", size=0.5, colour_xend="red", size_xend = 3,
                dot_guide=TRUE, dot_guide_size=0.5, dot_guide_colour = "grey") +
  scale_x_continuous(label=percent) +
  labs(x=NULL, y=NULL) +
theme_tufte() 
SESSION04
"Aaron’s unique quality was
that he was marvellously and vigorously different.
There is a scarcity of that.
Perhaps we can be all
a little more
different too."
Edward R. Tufte about Aaron Swartz
CryptoSandra