Confab Higher Ed 2015 in review
Learn more
- http://confabevents.com/events/higher-ed/
- 2016 is in Philly, Nov. 14-16
- Videos from 2015
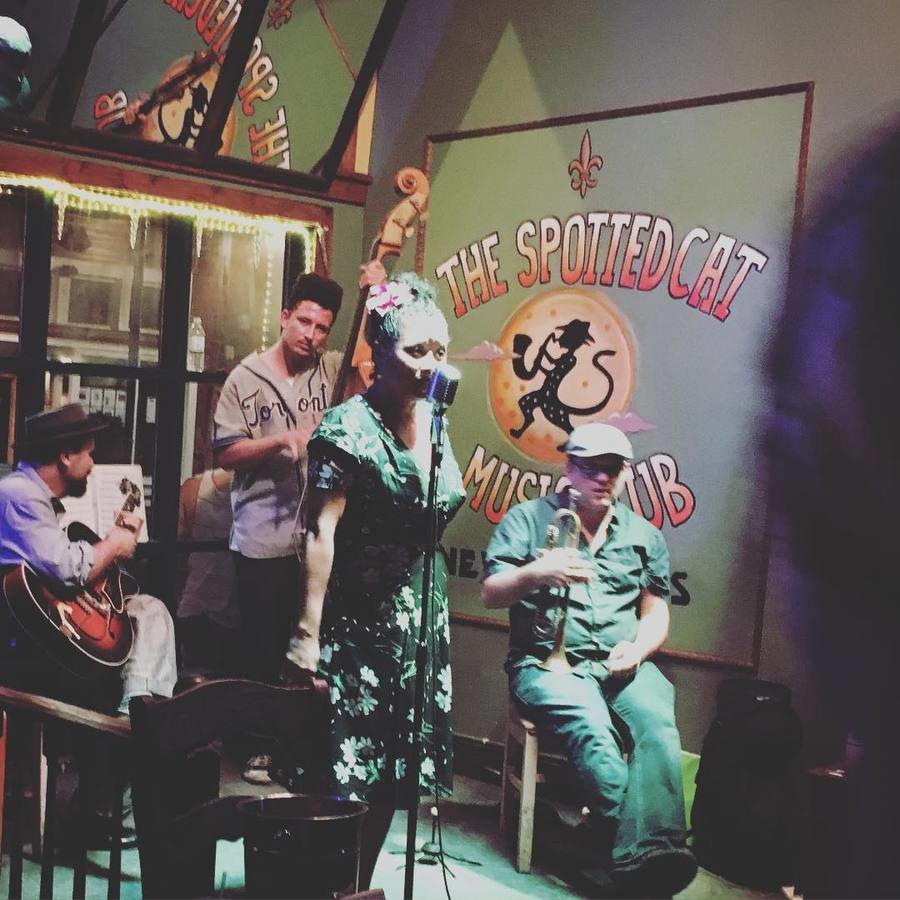
The city!

The music!
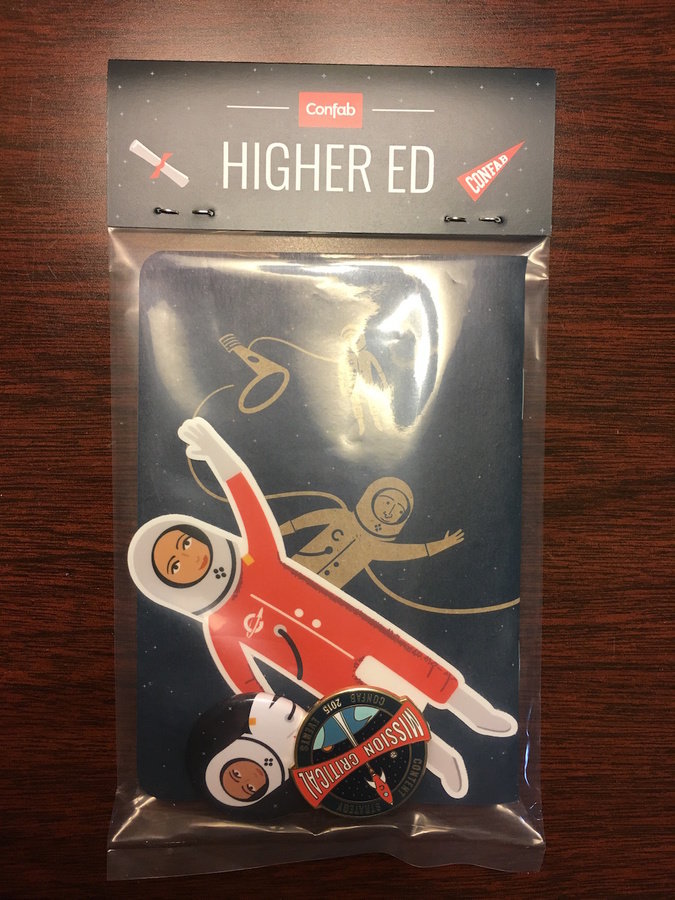
The soft goods!
Session #1
Keynote 1: Lisa Welchman
Collaboration in a new landscape
"Stop not being organized!"
"A standards-based framework can help an org be nimble"
Wheel of standards
- Editoral
- Design
- Technology (and network)
- Publishing
These standards are essential for scaling
We should be moving to an "information supply chain management system"
The right information
to the right people
at the right time
Our role as web workers is to create information flow
Session #2
Mike Powers
Have an analytics measurement strategy
Steps
- Plan for measurement at the beginning
- Collect data effectively
- Present numbers effectively
Use stories to present your numbers
aka try to make it interesting
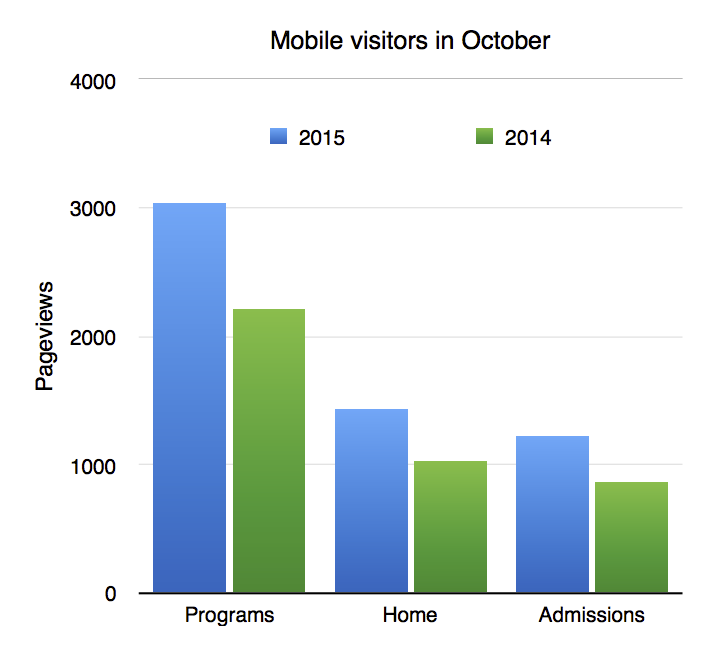
Use graphs to compare two factors to illustrate the data.
Bar charts are almost always better than pie charts. People understand length more easily.
Forumla for reports
- Here's where we were
- We changed x
- What happened (even failures)
- What to do next
Evaluate your content using GA goals and goal values
Underperforming content? Content evaluation tools exist. Try http://www.hemingwayapp.com/ for readability scores passive voice and more.
Underperforming content? Content evaluation tools exist. Try http://www.hemingwayapp.com/ for readability scores passive voice and more.
Remove every five words from text and see if it still makes sense.
User test the content!
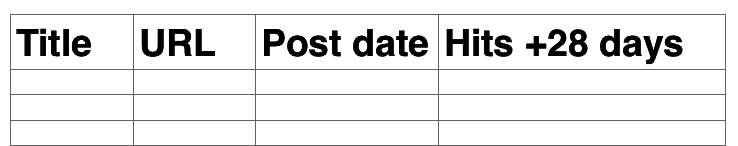
Use a spreadsheet and track content views for 28 days after posting
Session #3
Corey Vilhaver, Blend Interactive
Shoestring strategy
Minimum viable strategy
Do some research before you start
Gut checks count, ask someone else, find existing research
Erika Hall - Just Enough Research
Rolling audits
Pick a section a month
Session #4
Ravi Jain, Boston University
What kind of video should I make?
Types of videos
- Profiles - students, faculty
- Event previews
- News capsules
- Short form content
- Interactive with web pages
- Live stream
- Extreme short form - Vine
- Animated GIFs
- Content for live events (video during
an event)
Decoding the video genome
- Editorial voice - from what perspective? must be solid
- Visual aesthetic - framing, camera, handheld?
- Editing style - MTV style!
- Music
- Transitions
- Titles
- Lower thirds - at bottom of screen, usually tells
you who the speaker is, etc.
The Boston College Minute
- No set pieces
- No talking to the camera
- No lower thirds
- 'Immediate' style of storytelling
- Started with a pilot concept, just tried
it out to see what it would take
Playlist on YouTube
Workflow
- Project spec
- Pre-production
- Production
- Gathering assets
- Editing
- Integrating video
- Testing
- Post-video
Takeaways
- Plan, plan, plan
- Set up structures to work within
- Measure and tell a good story
- Be bold