Social Media affects the Timing, Location, and Severity of School Shootings
Javier Garcia-Bernardo
J. Garcia-Bernardo, H. Qi, J. M. Shultz, A. M. Cohen, N. F. Johnson, P. S. Dodds
http://arxiv.org/abs/1506.06305
Dec 14th, 2012: Sandy Hook ATTACK.
Since then: 194 school shootings.
Visualization: https://everytownresearch.org/school-shootings

Visualization: https://everytownresearch.org/school-shootings

Visualization: https://everytownresearch.org/school-shootings

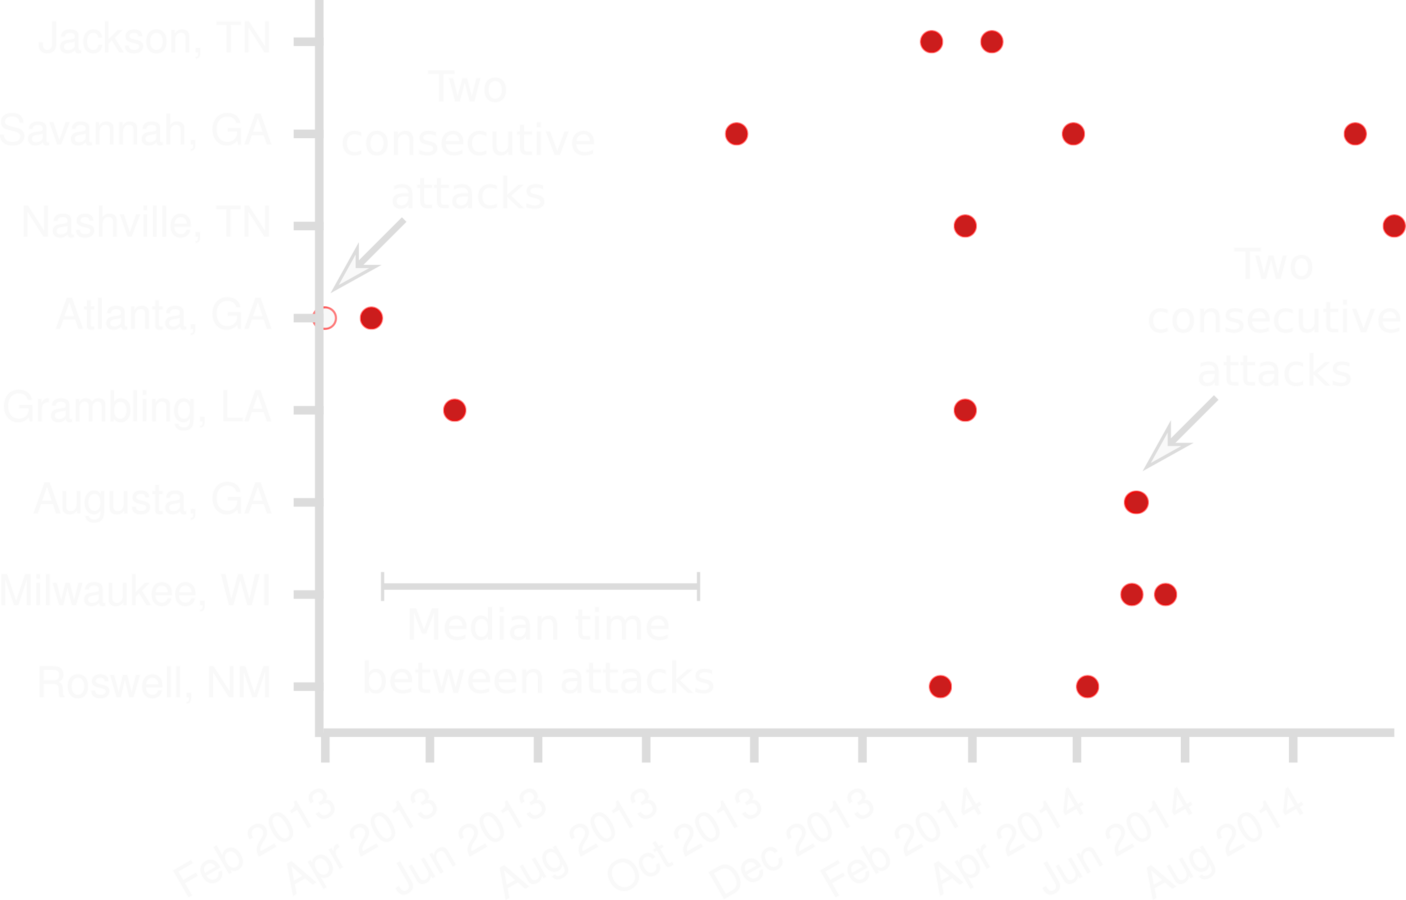
Do school shootings cluster in time?
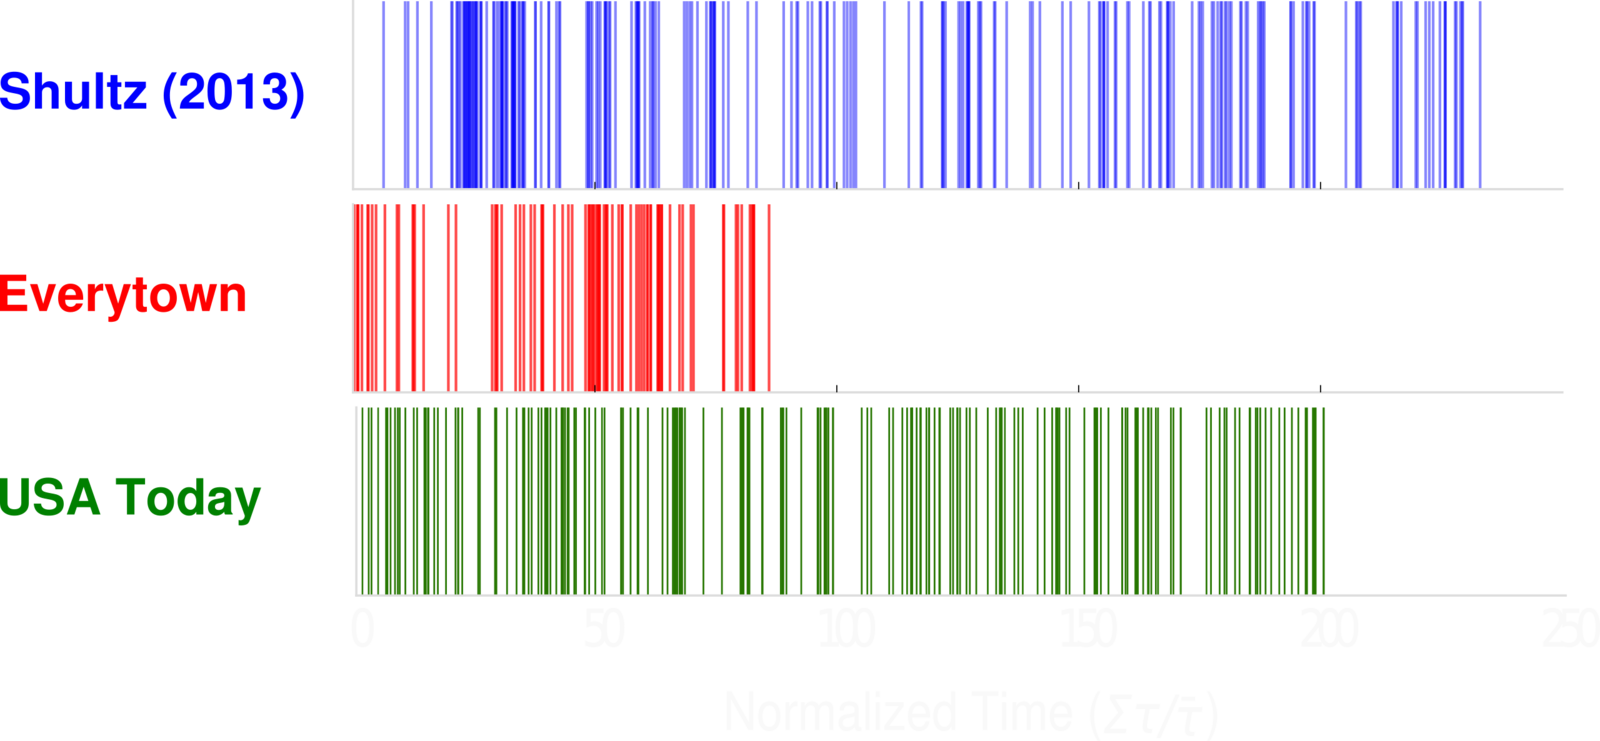
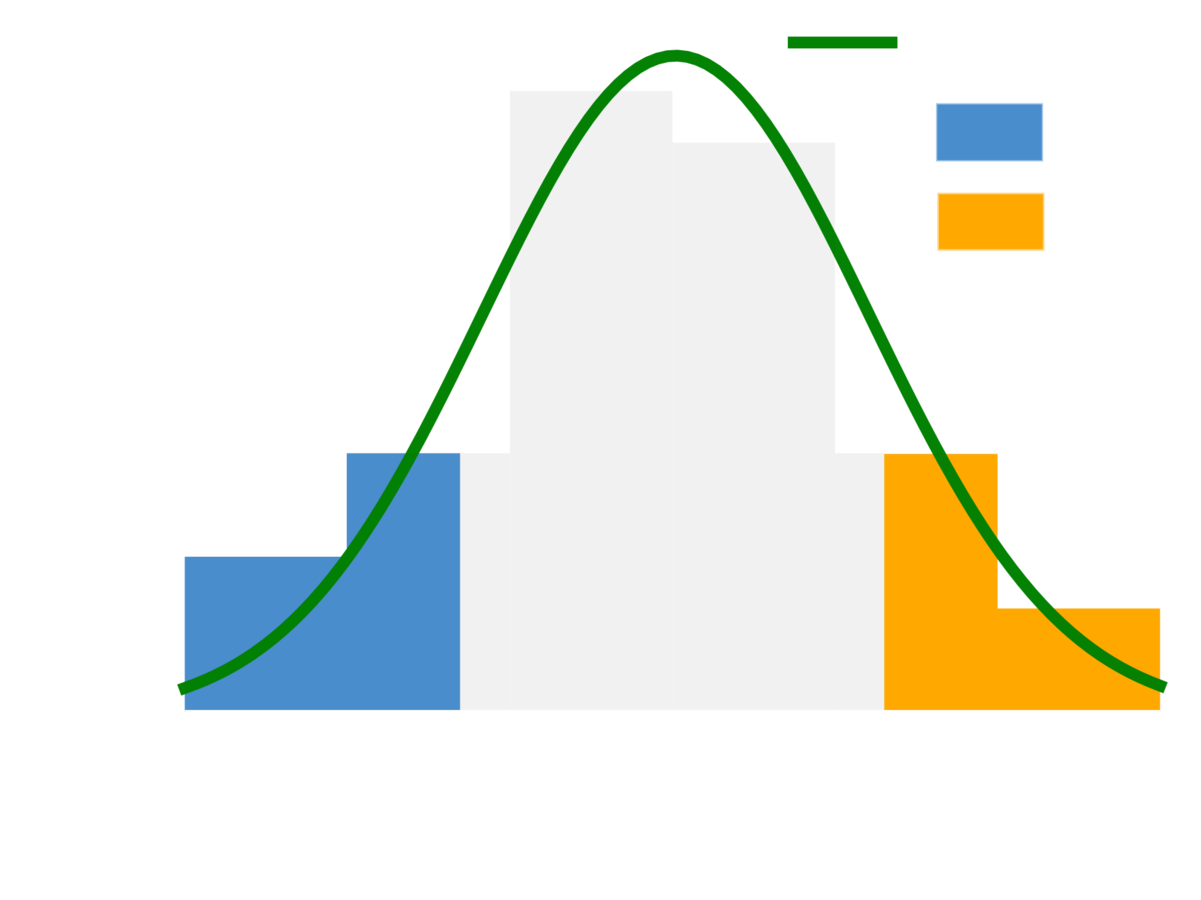
DATA description: clustering
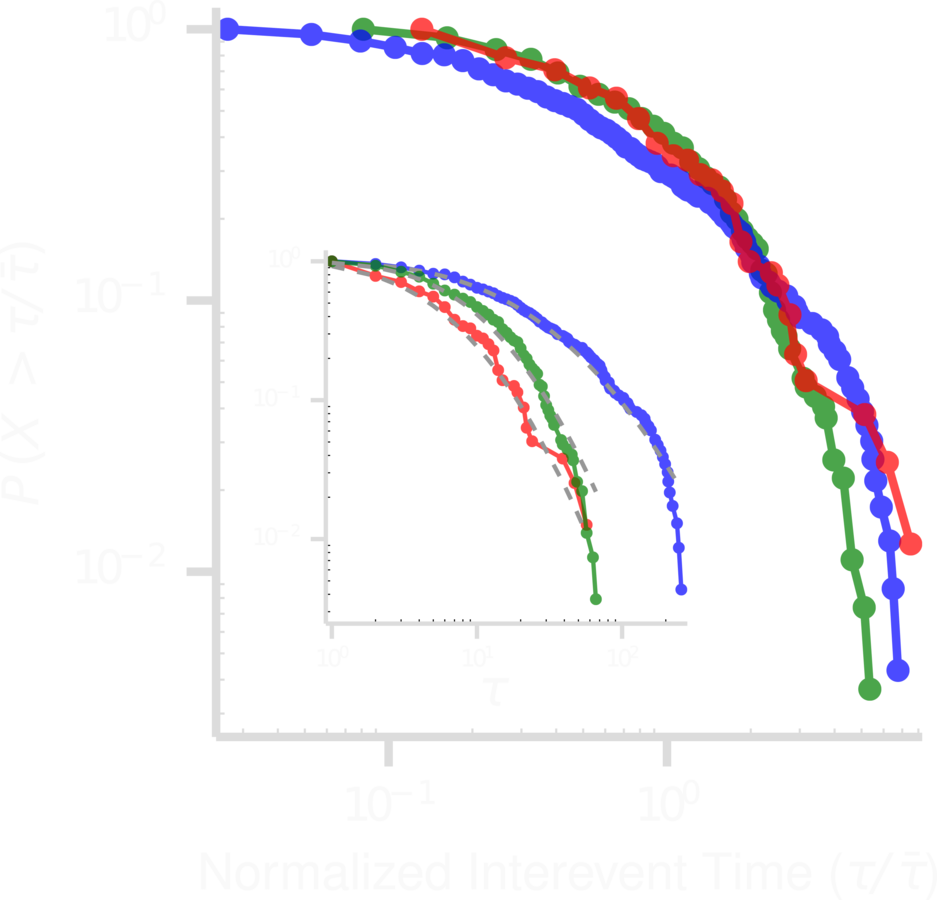
DATA description: heavy TAILS
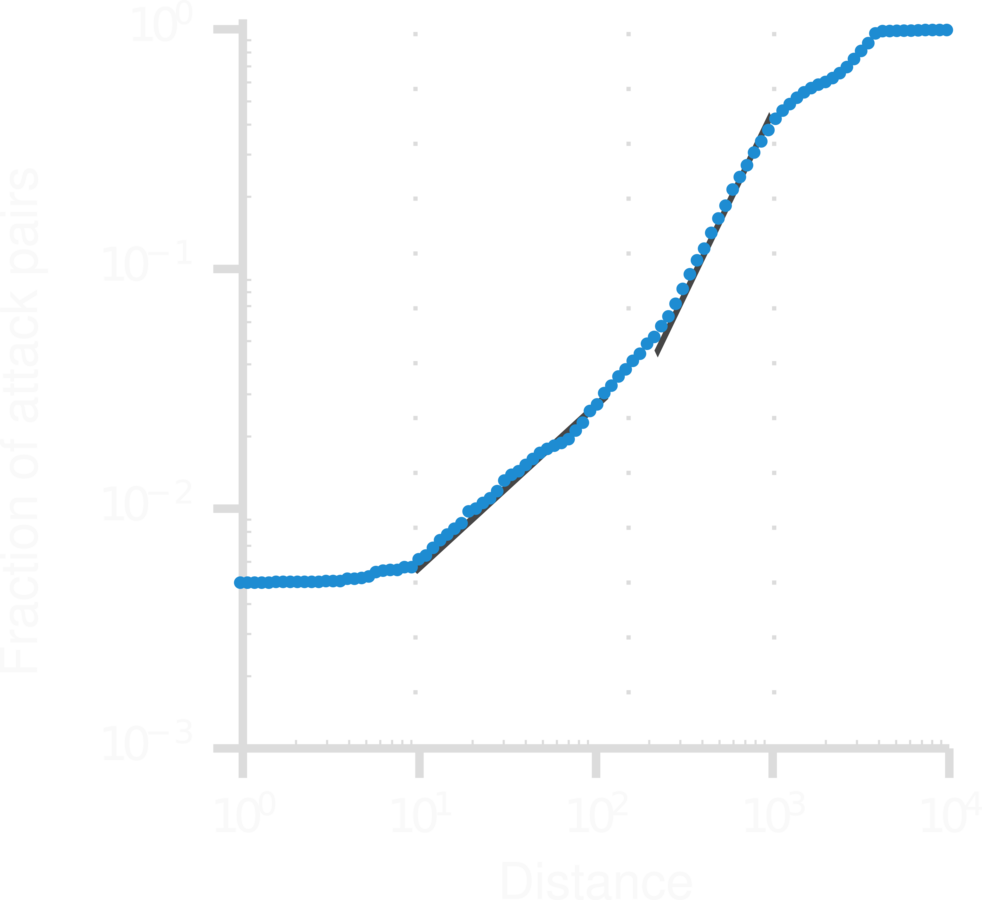
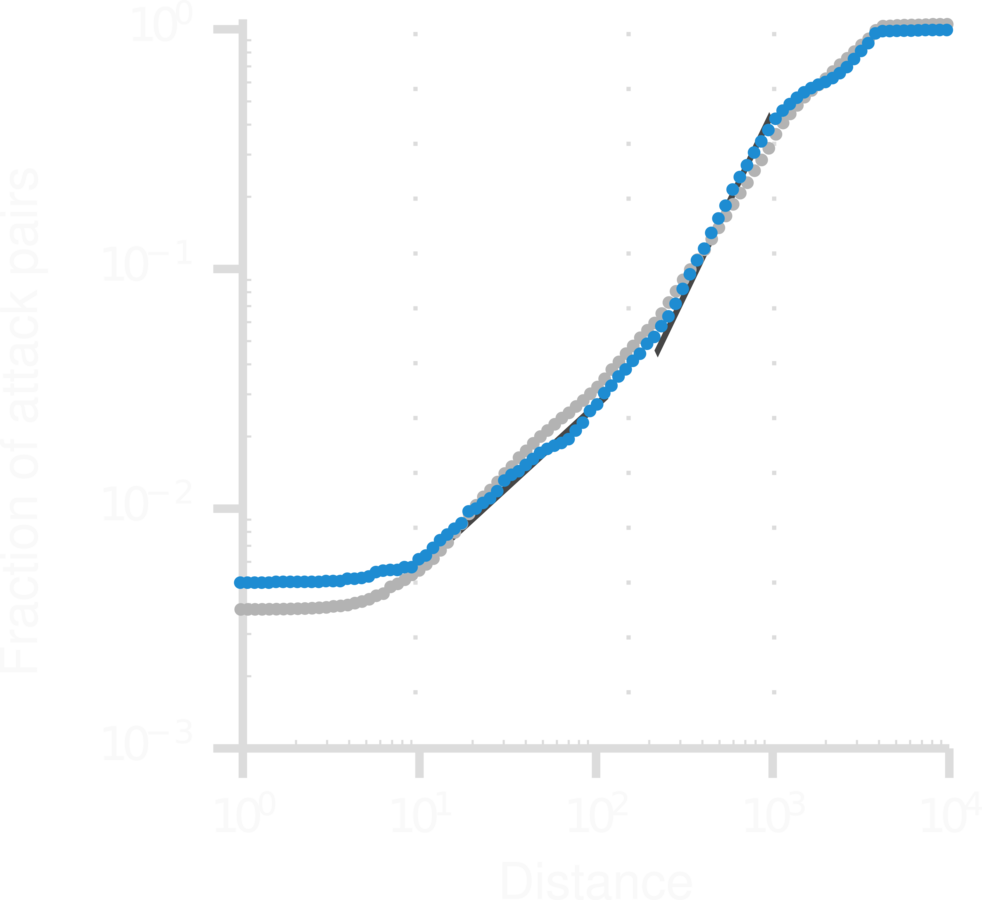
Do school shootings cluster in space?
Do school shootings affect the timing of new attacks?
Do school shootings affect the timing of new attacks through media?

Copycat effect
can we model all this?
FIRST model
RED VERSuS BLUE

N. F. Johnson, et al., Scientific reports 3, 3463 (2013).
FIRST model
RED VERSuS BLUE
N. F. Johnson, et al., Scientific reports 3, 3463 (2013).
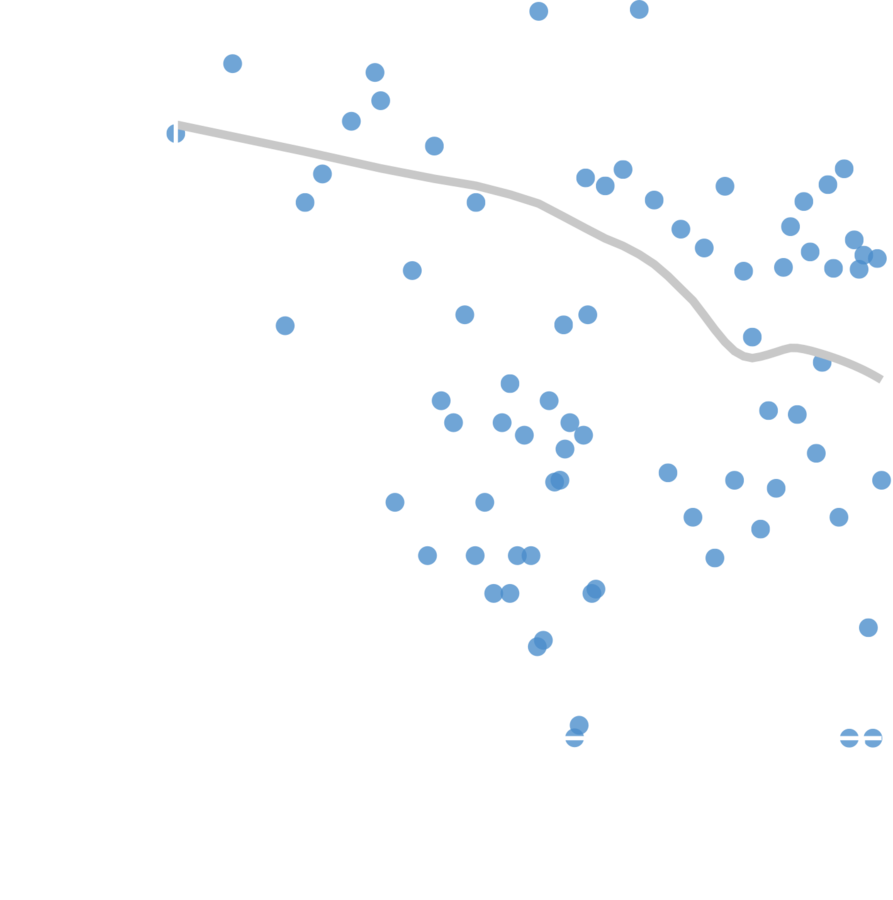
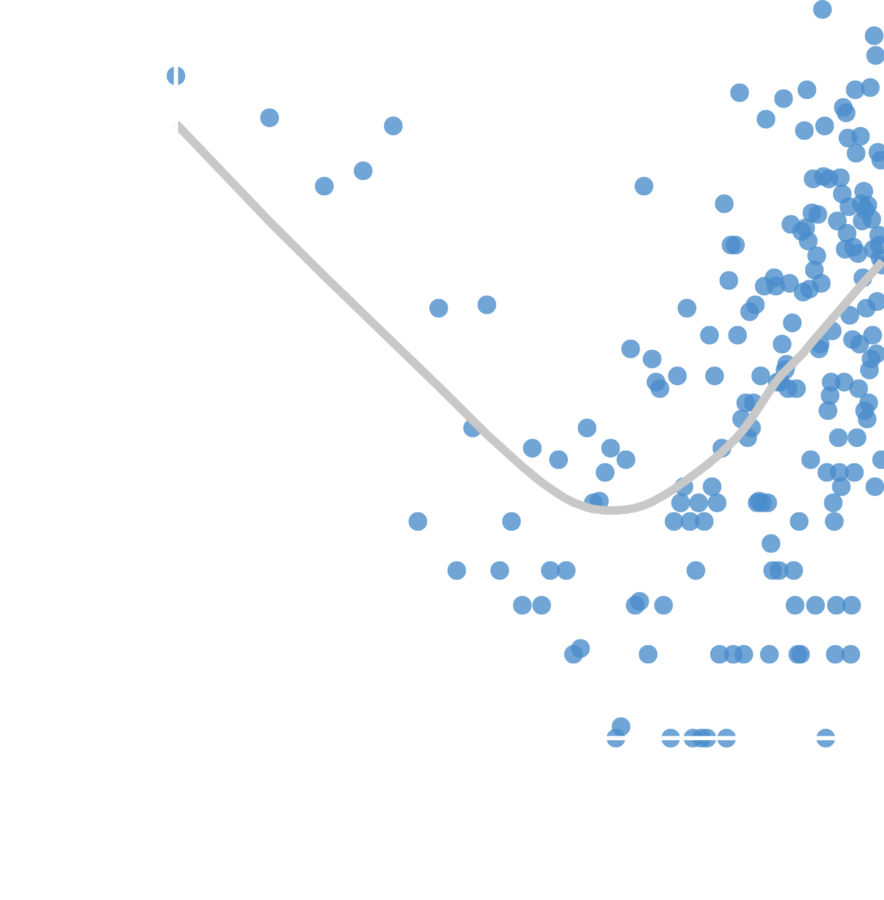
Interevent time between attacks n-1 and n
FIRST model
RED VERSuS BLUE
N. F. Johnson, et al., Scientific reports 3, 3463 (2013).
Interevent time between attacks n-1 and n
Attack number
FIRST model
RED VERSuS BLUE
N. F. Johnson, et al., Scientific reports 3, 3463 (2013).
Interevent time between attacks n-1 and n
Escalation rate
Attack number
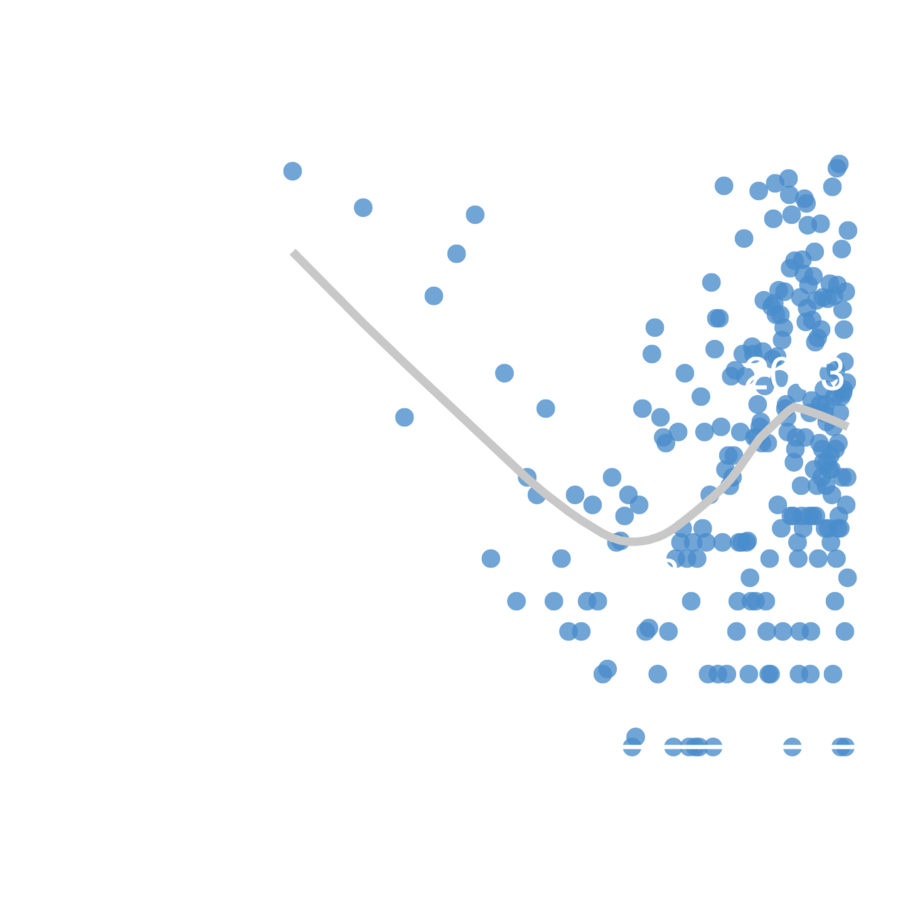
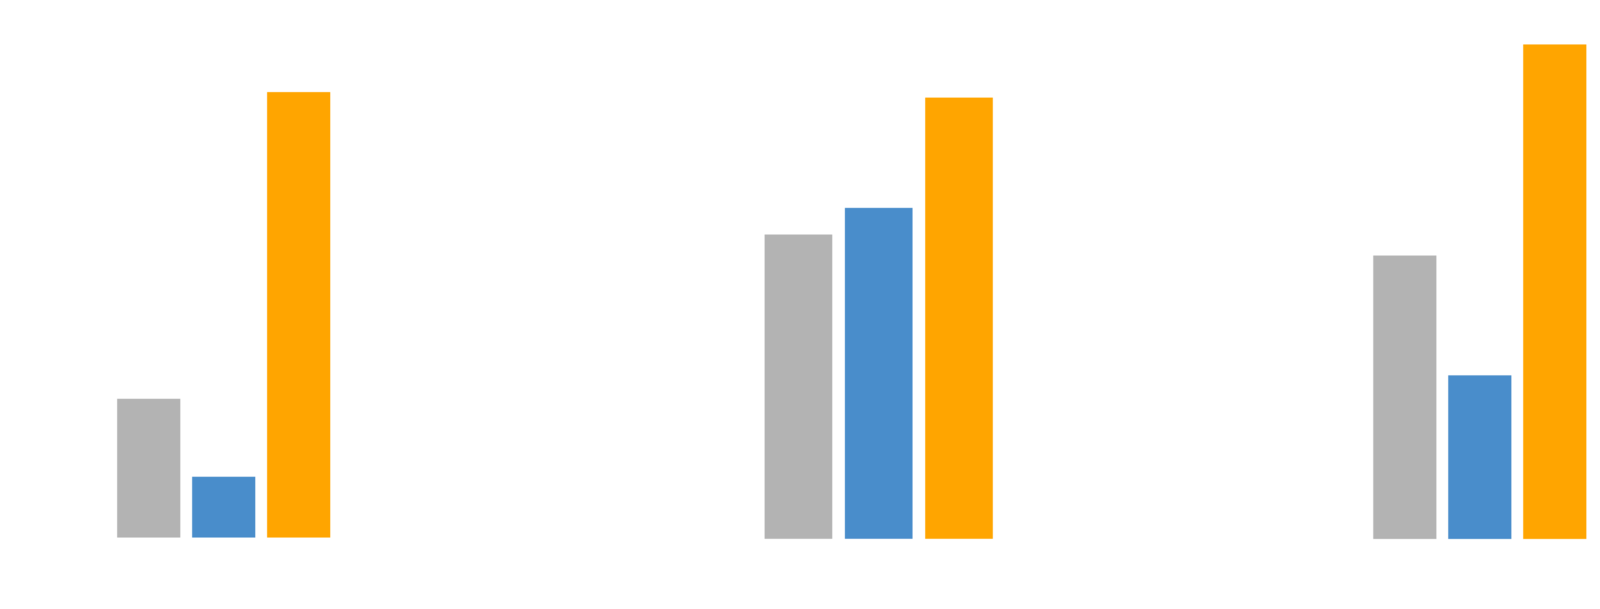
College
College
K12
What can we do with this model:
- UNDERSTAND TRENDS, focus efforts on campuses.
- understand WHAT TYPE OF ATTACKS ARE COMING.
SECOND model
HAWKES PROCESS

D. Marsan, O. Lengliné, Science 319, 1076 (2008).
A. G. Hawkes, D. Oakes, Journal of Applied Probability pp. 493–503 (1974).
SECOND model
HAWKES PROCESS
D. Marsan, O. Lengliné, Science 319, 1076 (2008).
A. G. Hawkes, D. Oakes, Journal of Applied Probability pp. 493–503 (1974).
Attack rate at space point x and time t
SECOND model
HAWKES PROCESS
D. Marsan, O. Lengliné, Science 319, 1076 (2008).
A. G. Hawkes, D. Oakes, Journal of Applied Probability pp. 493–503 (1974).
Attack rate at space point x and time t
Base attack rate
SECOND model
HAWKES PROCESS
D. Marsan, O. Lengliné, Science 319, 1076 (2008).
A. G. Hawkes, D. Oakes, Journal of Applied Probability pp. 493–503 (1974).
Attack rate at space point x and time t
Base attack rate
Influence of previous attacks

distance component

time component
What can we do with this model:
- focus efforts on federal prevention programs.
- quantify the time decay.
Conclusions
1. School shootings cluster in time, but not in space (except within-town attacks).
2. School shootings get media attention, which in turn affect the probability of new attacks (copycat effect).
3. We can model the relationship in several ways:
3.1. Blue vs Red model:
- We find distinct trends in school shootings (College vs K12)
- The outliers in the model have distinctive characteristics.
3.2. Hawkes process:
- The attacks are randomly distributed in space (except within-town).
- The attacks increase the probability of new attacks during months.
THANK YOU
1. School shootings cluster in time, but not in space (except within-town attacks).
2. School shootings get media attention, which in turn affect the probability of new attacks (copycat effect).
3. We can model the relationship in several ways:
3.1. Blue vs Red model:
- We find distinct trends in school shootings (College vs K12)
- The outliers in the model have distinctive characteristics.
3.2. Hawkes process:
- The attacks are randomly distributed in space (except within-town).
- The attacks increase the probability of new attacks during months.
http://bit.ly/2d7N3Qr
arxiv: 1506.06305
@uvaCORPNET // @javiergb_com
garcia@uva.nl