Data quality in interlocking directorates
Javier Garcia-Bernardo
SUNBELT, April 10th, 2016
@javiergb_com / @UvACORPNET
1. Interlocking directorates
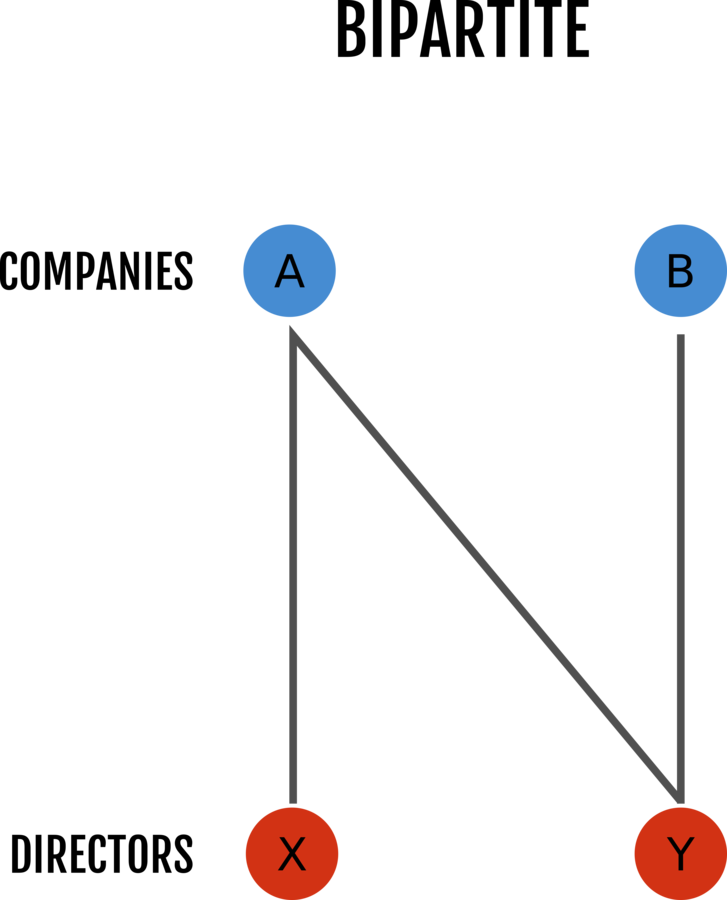
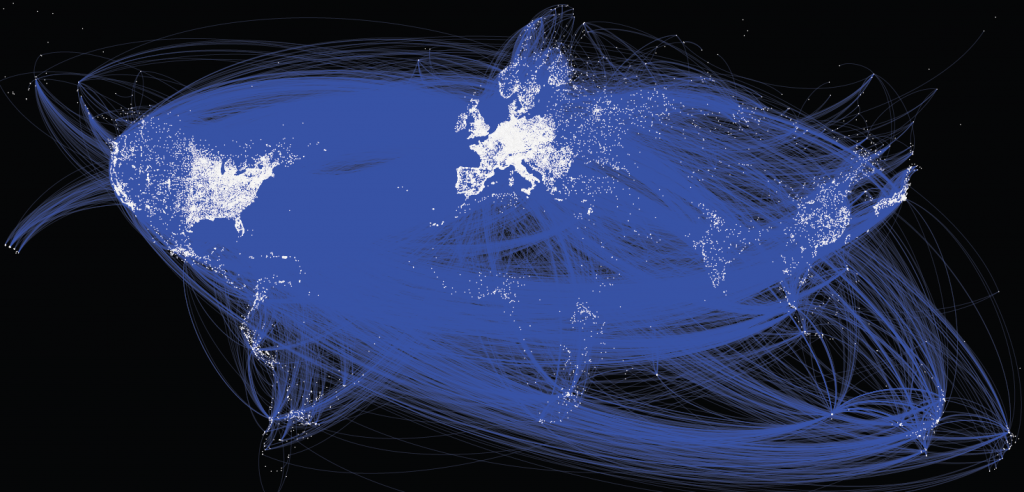
Corporate networks
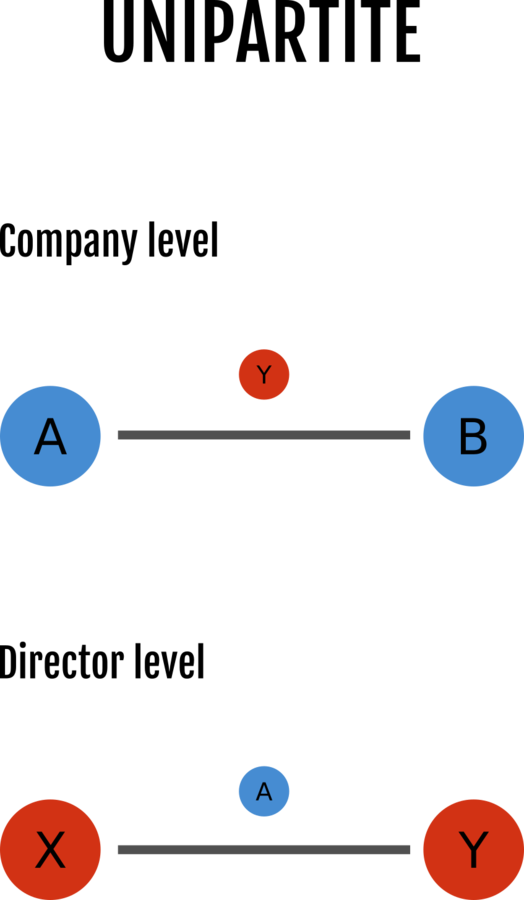
Corporate networks
2. Types of missing data
2.1. Missing fields
2.2. Missing nodes
2.1. Fields missing
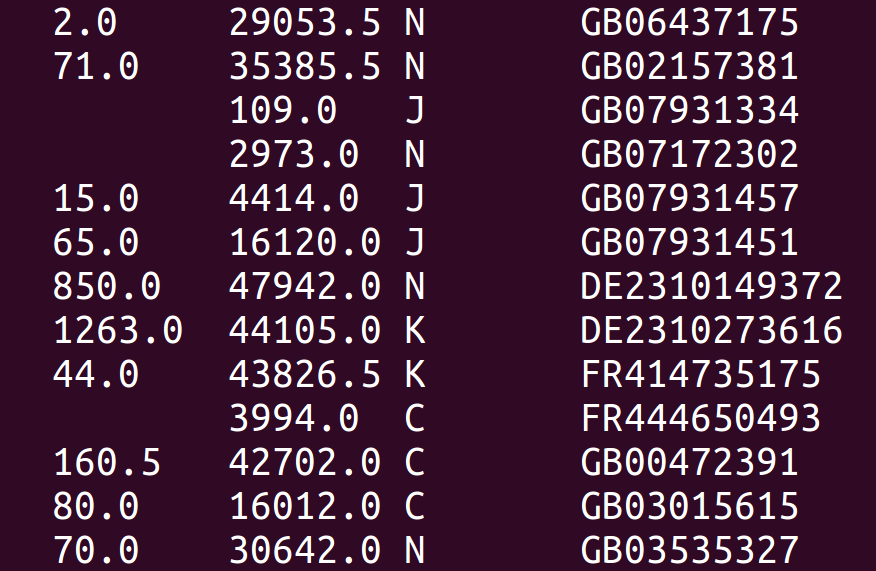
Employment Turnover Sector ID

2.2. Nodes missing
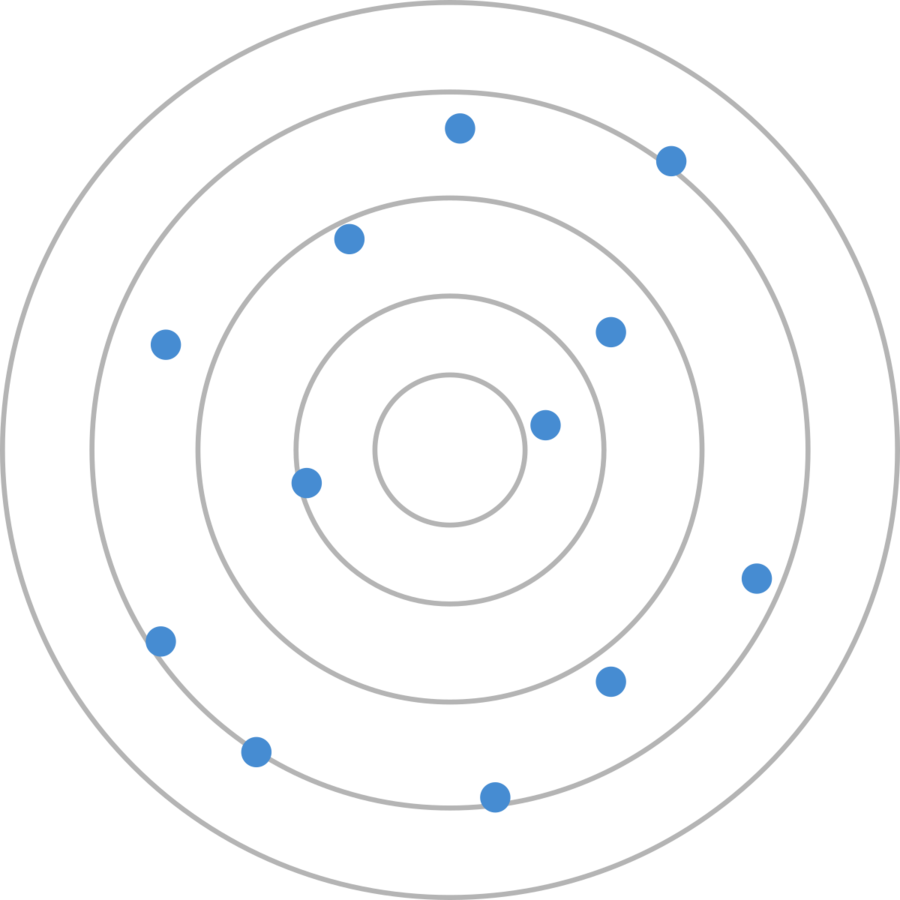
2.2. Nodes missing
2.2. Nodes missing
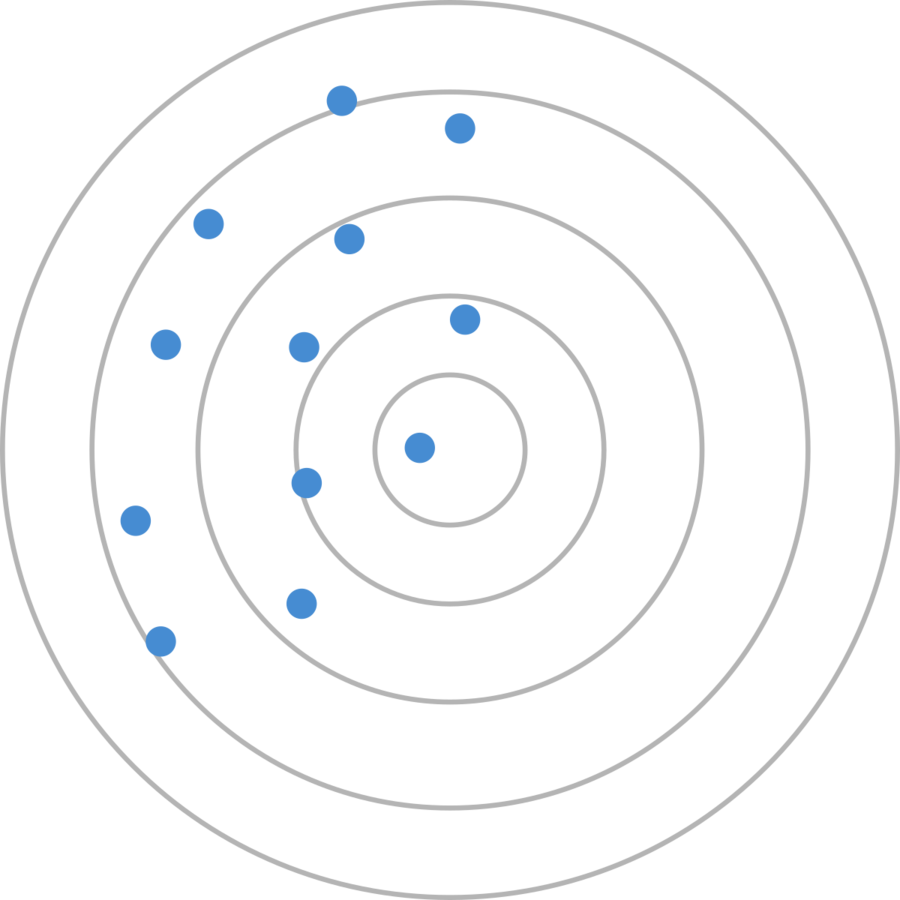
ORBIS data (200 million companies)
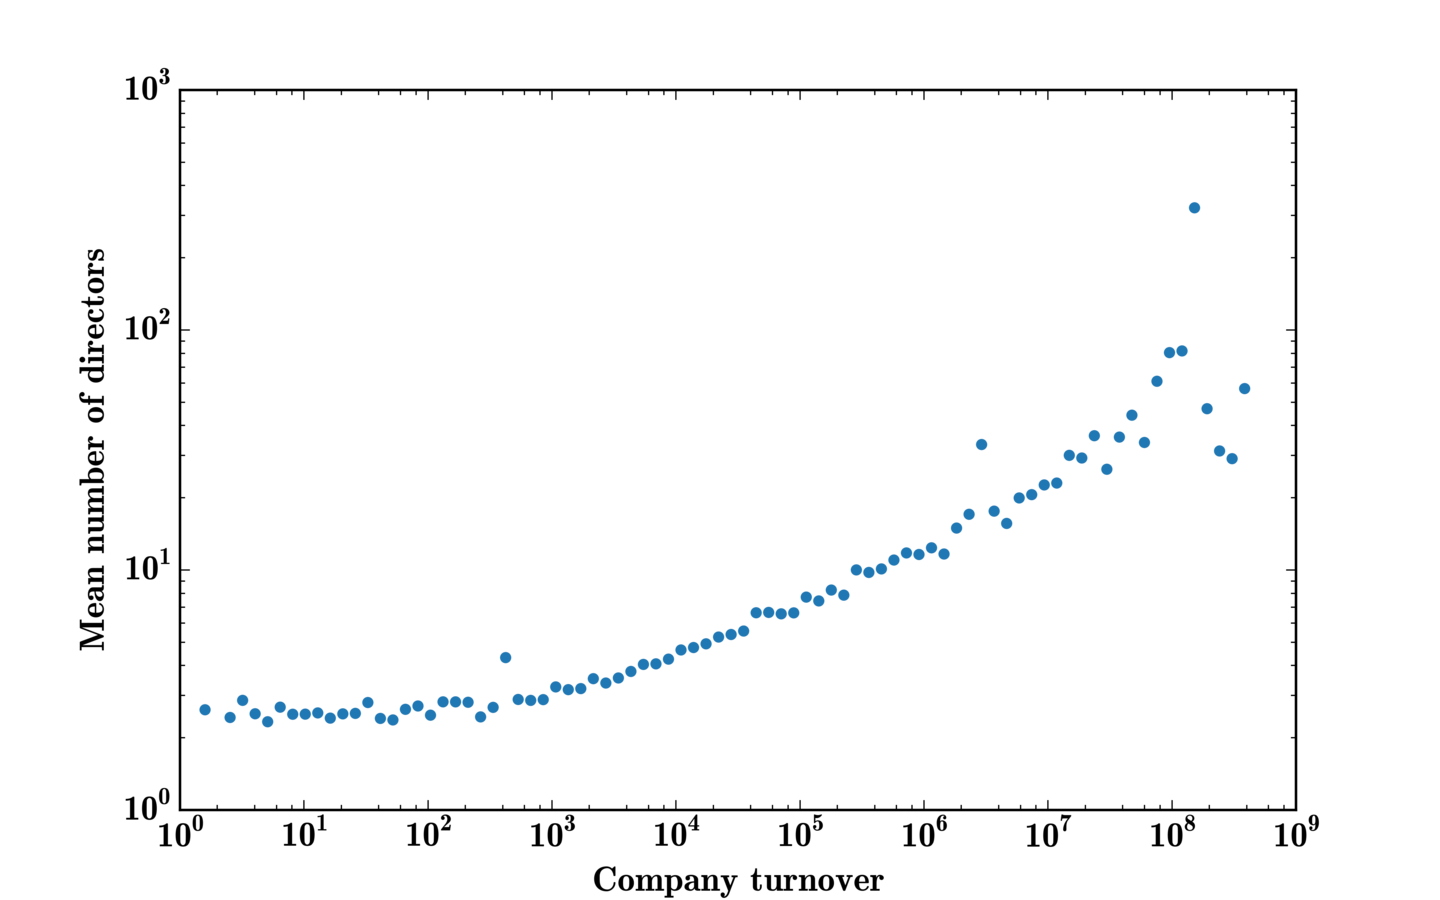
Observed average revenue
3. How to know where
your data stands?
3.1. Exploration: Comparison with external sources
3.2. Explanation: Distribution approach
Company data quality
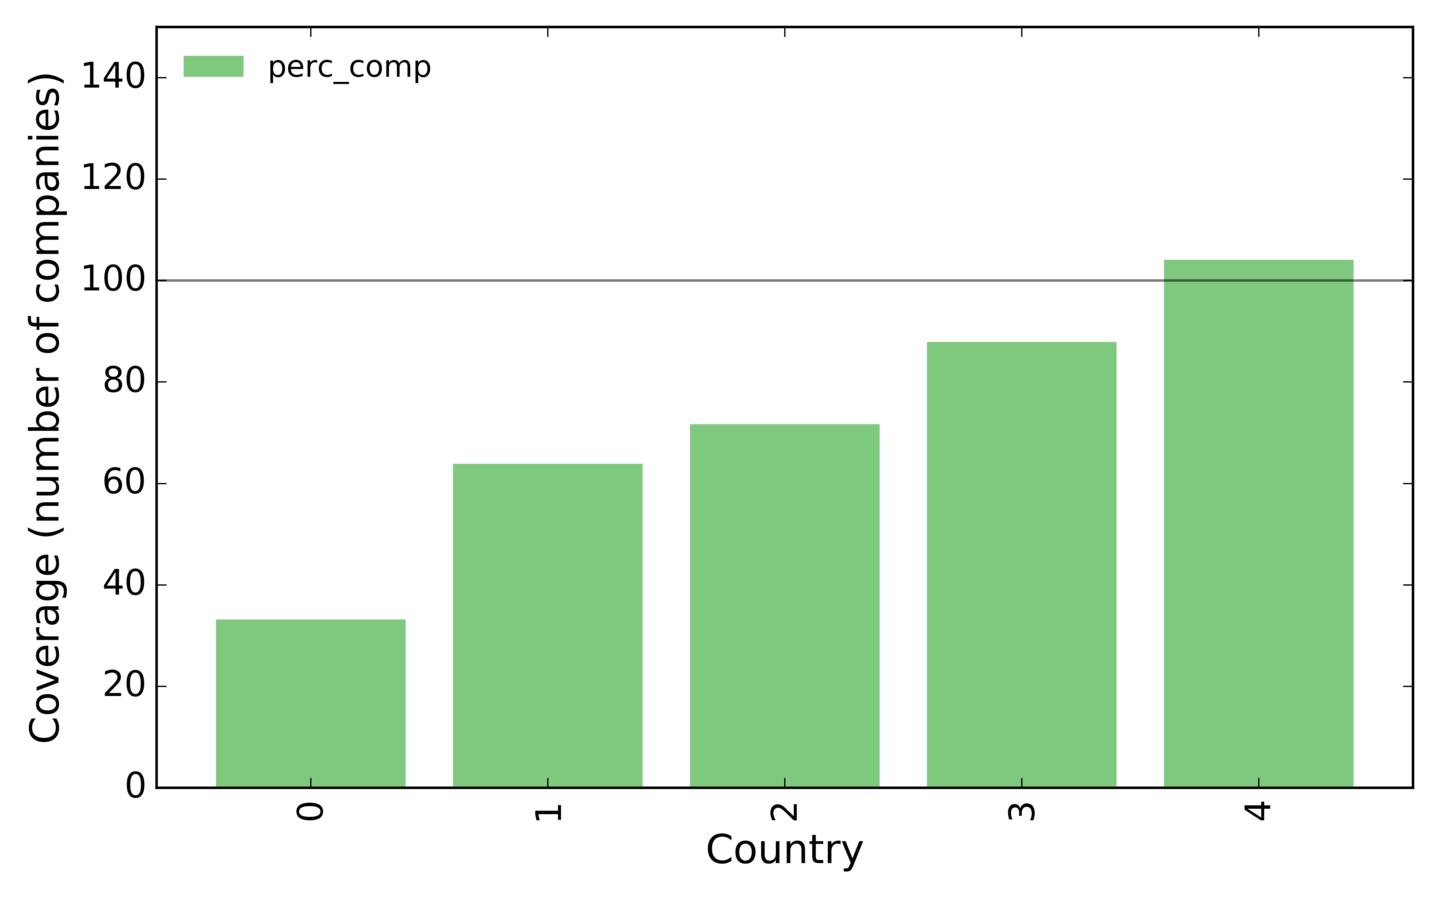
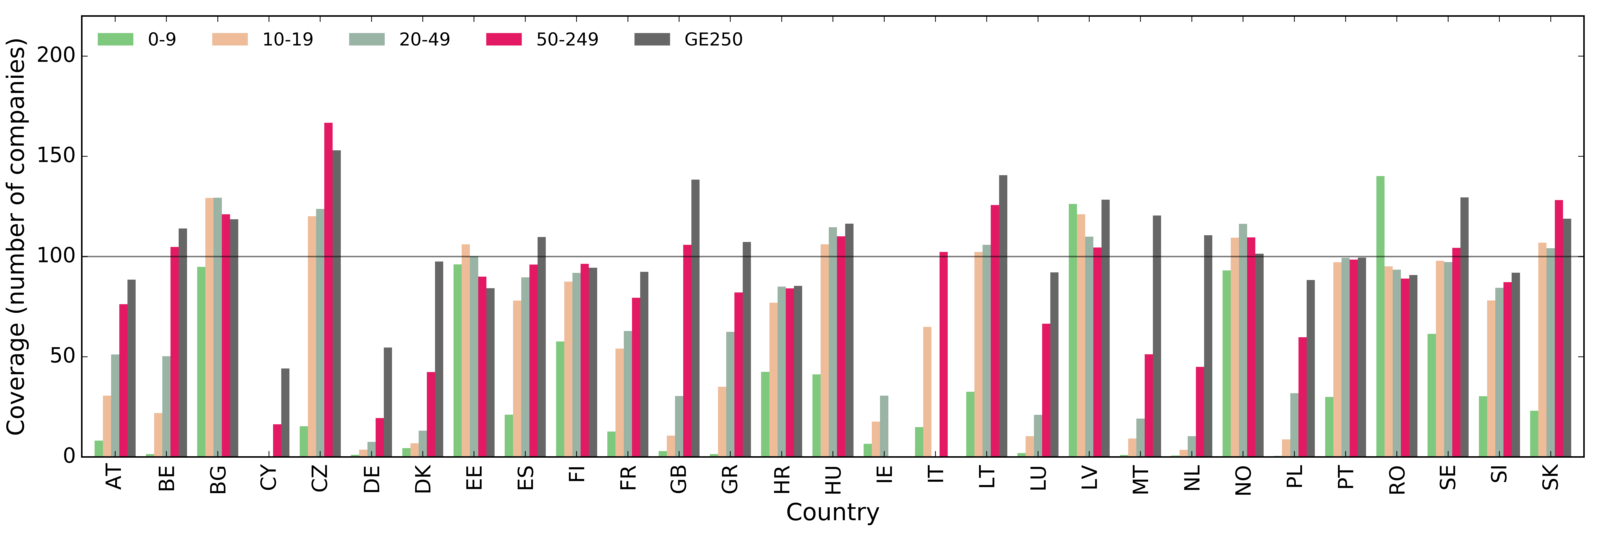
Many small companies are missing
3.1. Exploration
0-9 10-19 20-49 50-249 GE250
Interactive visualizations
3.1. Exploration
Code: https://github.com/uvacorpnet/interactive_visualizations
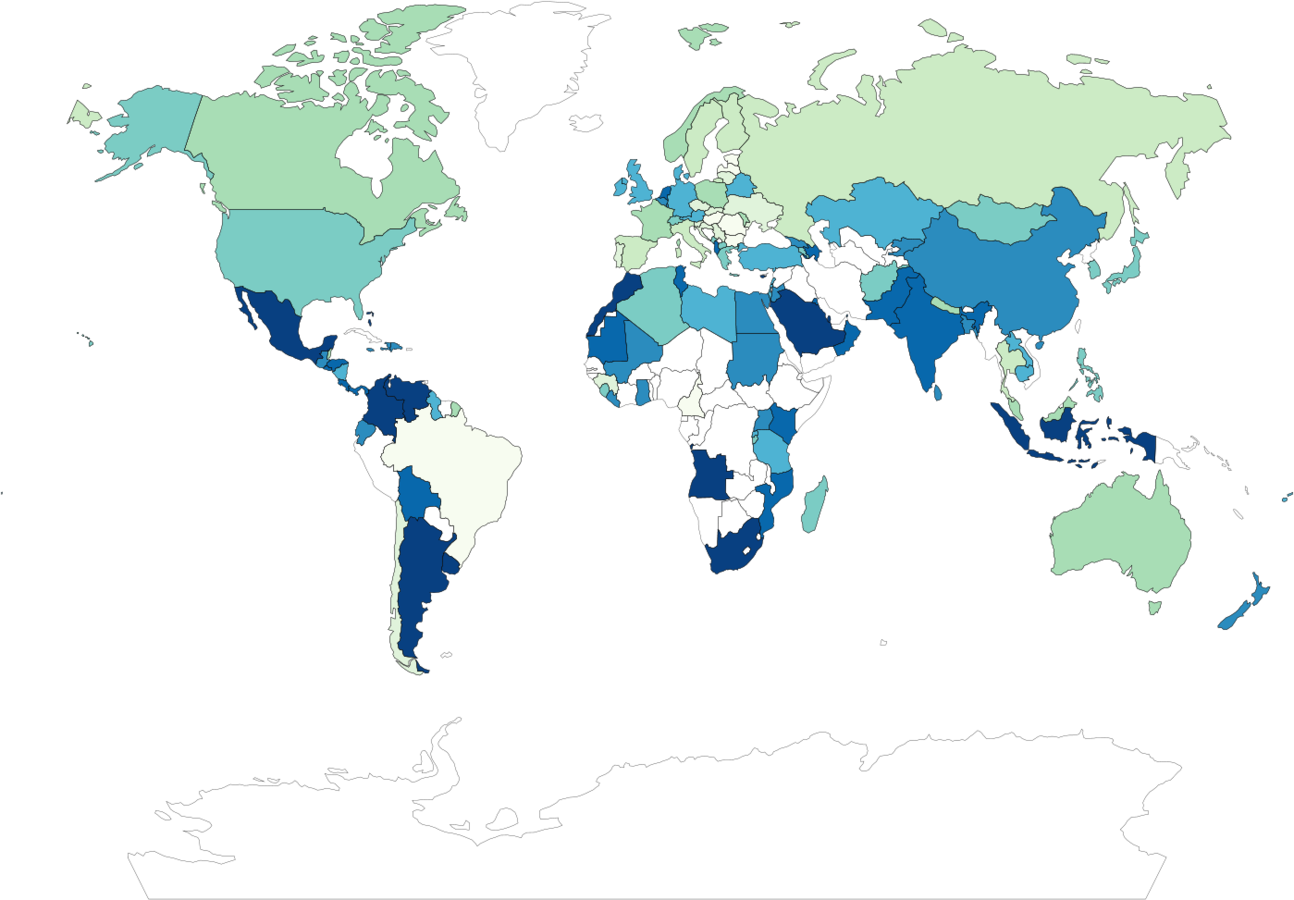
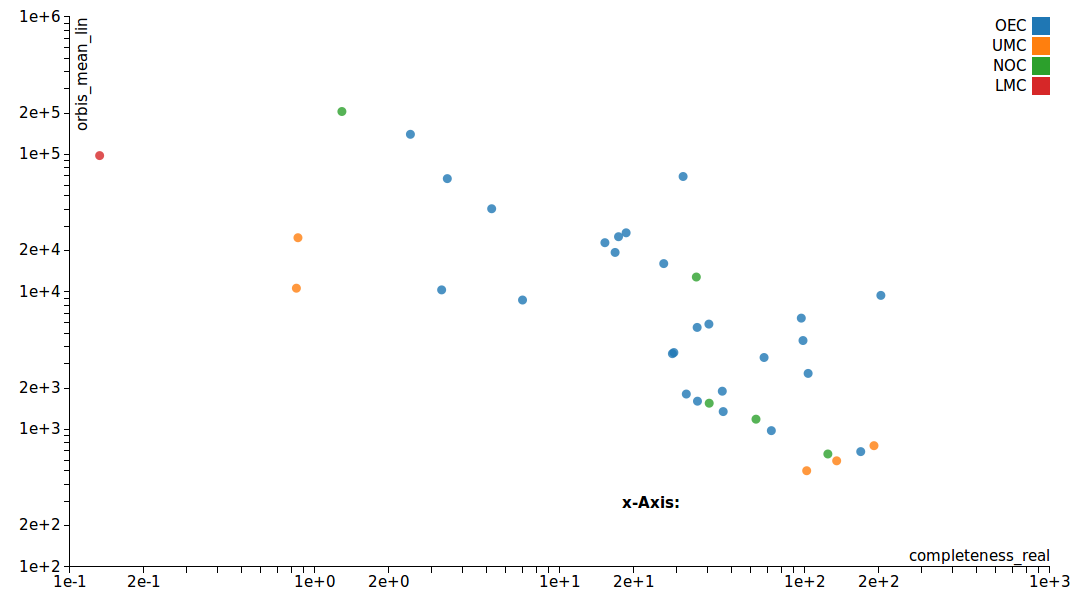
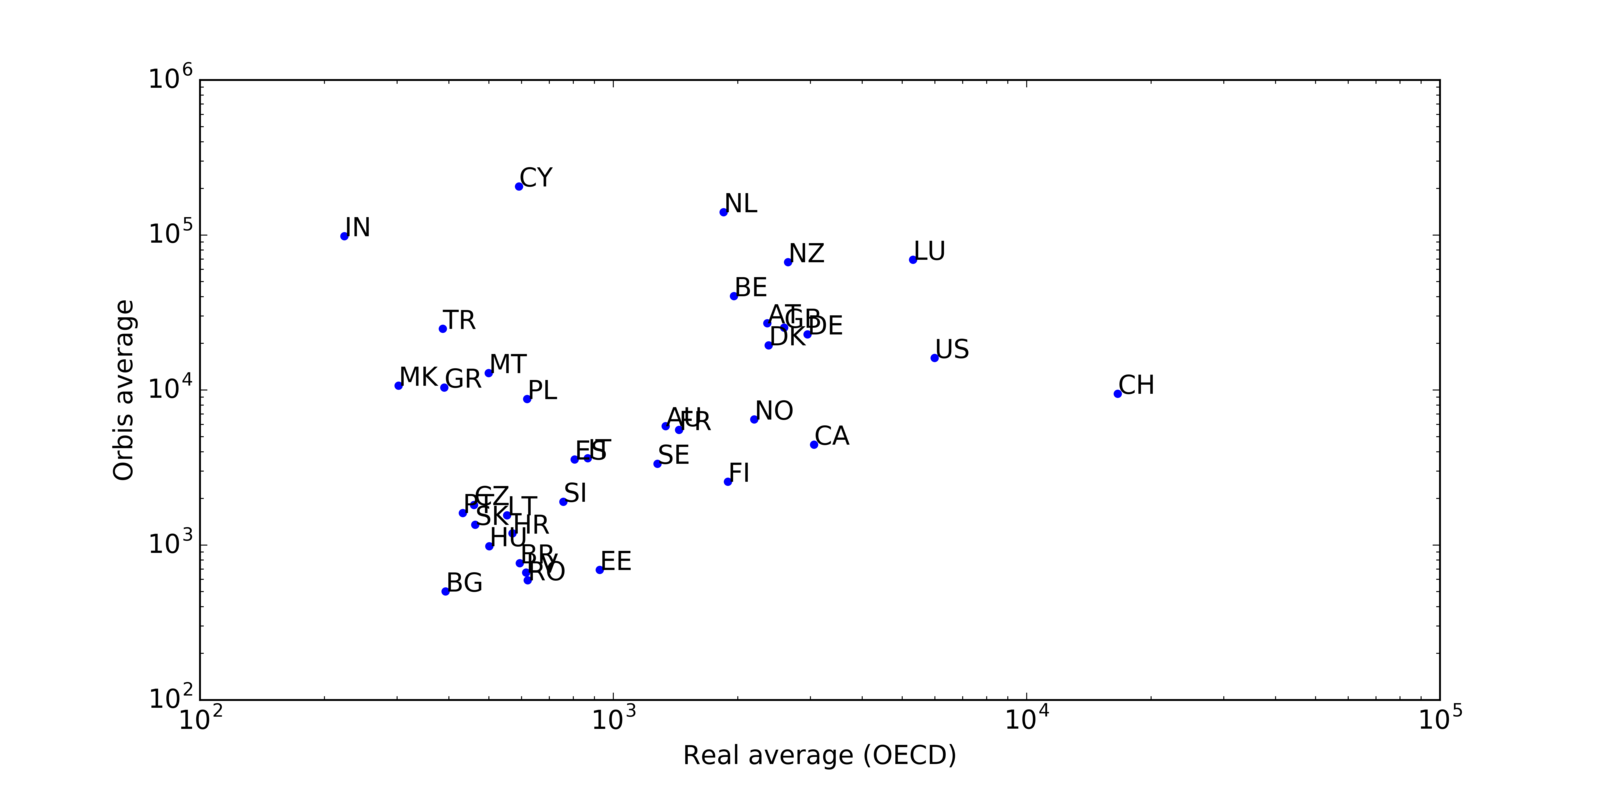
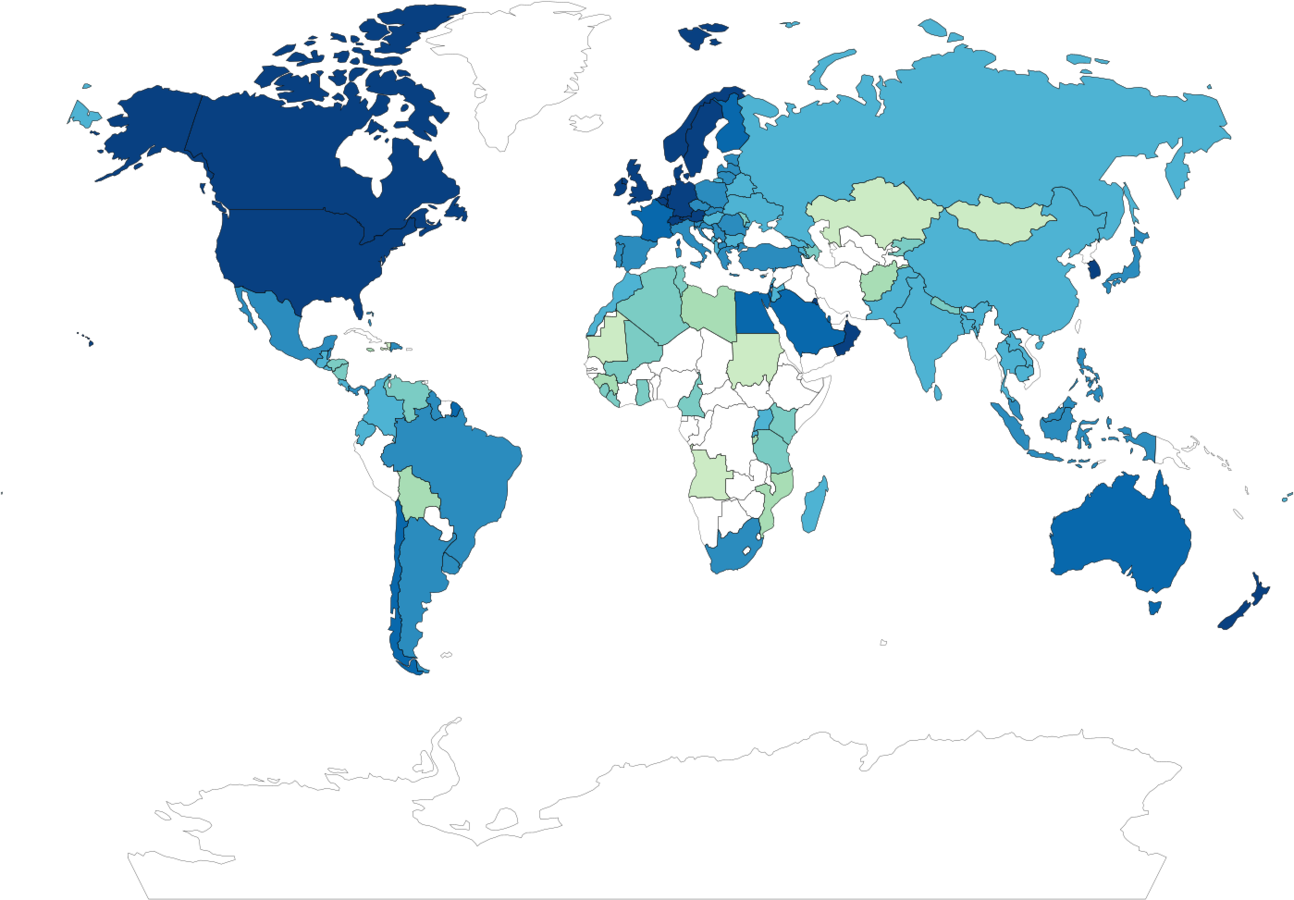
Our data is biased toward big companies
- Higher GDP/capita ➙ Larger average companies
- Higher GDP/capita ➙ Higher quality
- Higher quality ➙ Smaller observed average (since we have the small ones)
3.1. Exploration
Our data is biased toward big companies
- Higher GDP/capita ➙ Larger average companies
- Higher GDP/capita ➙ Higher quality
- Higher quality ➙ Smaller observed average (since we have the small ones)
Results in lack of correlation:
3.1. Exploration
Distribution approach:
3.2.1. Data follows lognormal distribution (loc and scale).
3.2.2. The lognormal distributions have constant scale.
3.2.3. Macro-economics to estimate location parameter.
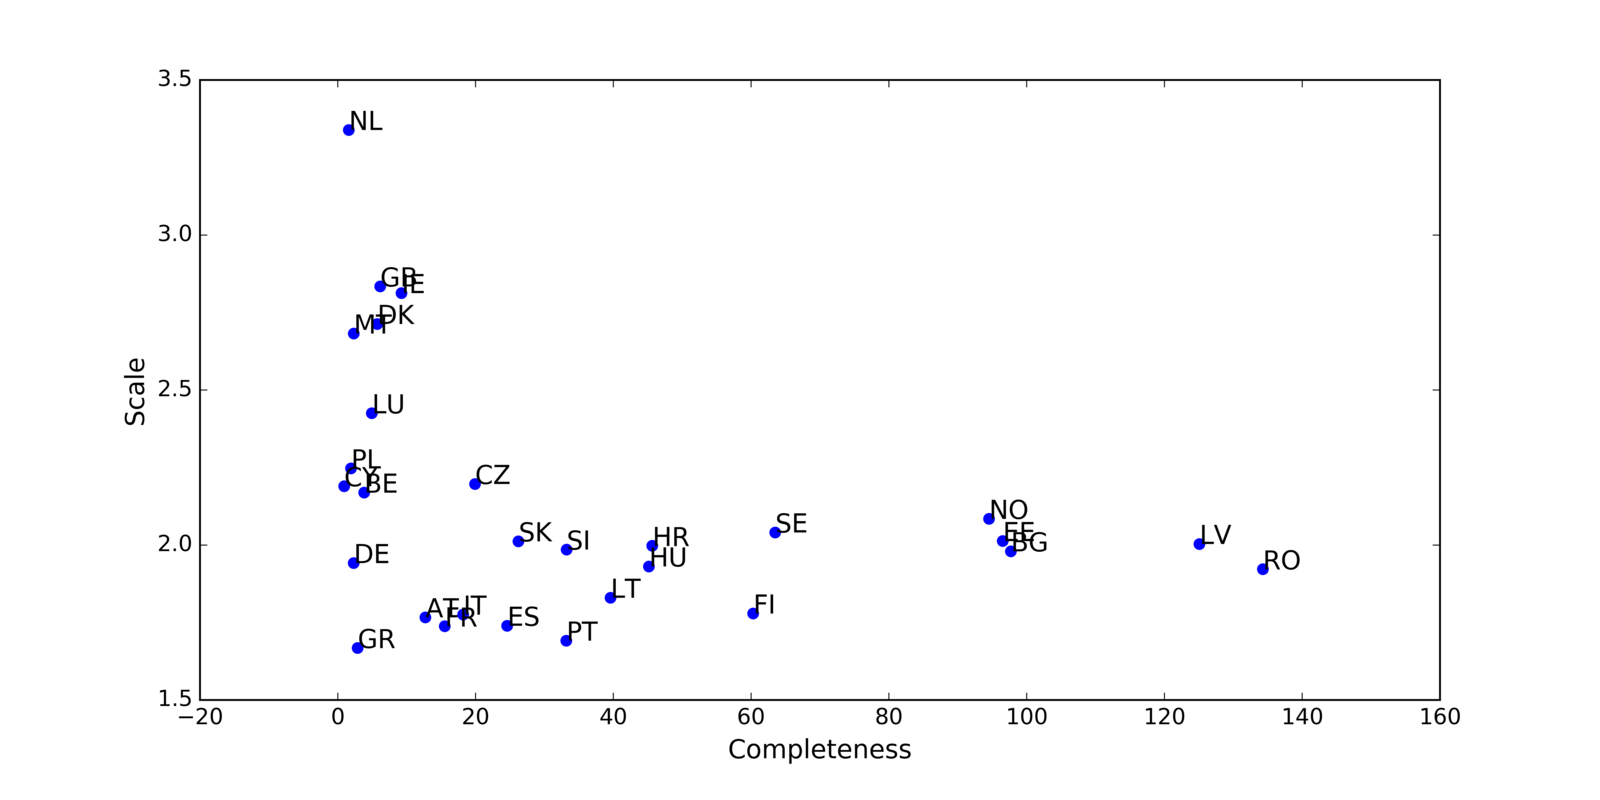
3.2.4. Assess completeness
3.2. Explanation
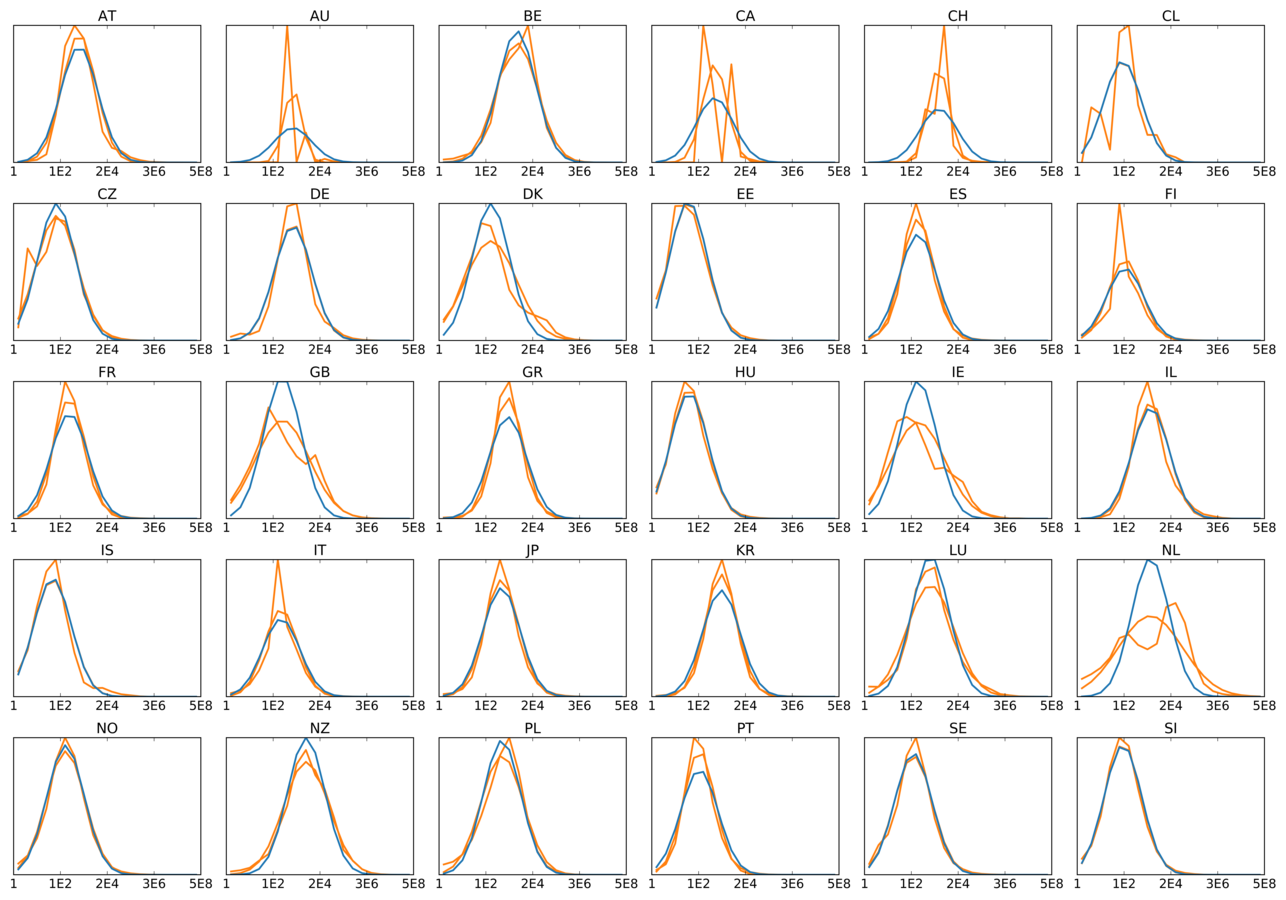
3.2.1. Data follows lognormal distribution.
- Slope 1 relationship VAR[X] vs E[X] = constant scale
- Constant scale: Linear relationship between E[X] and location
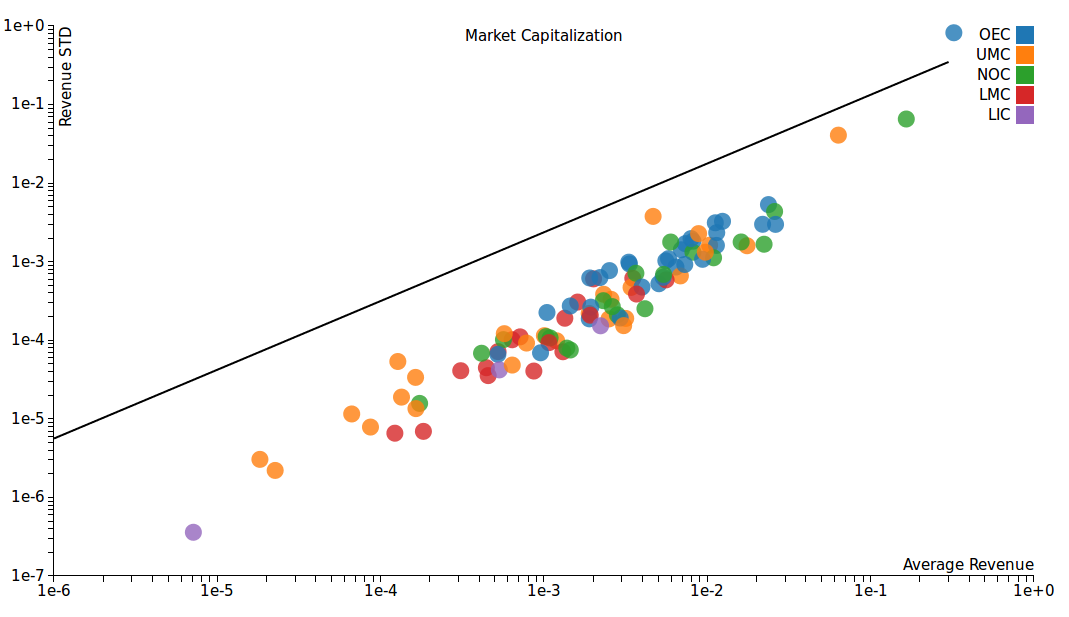
3.2.2. The lognormal distributions have constant scale.
- Use macro-economic indicators to find average and location parameter
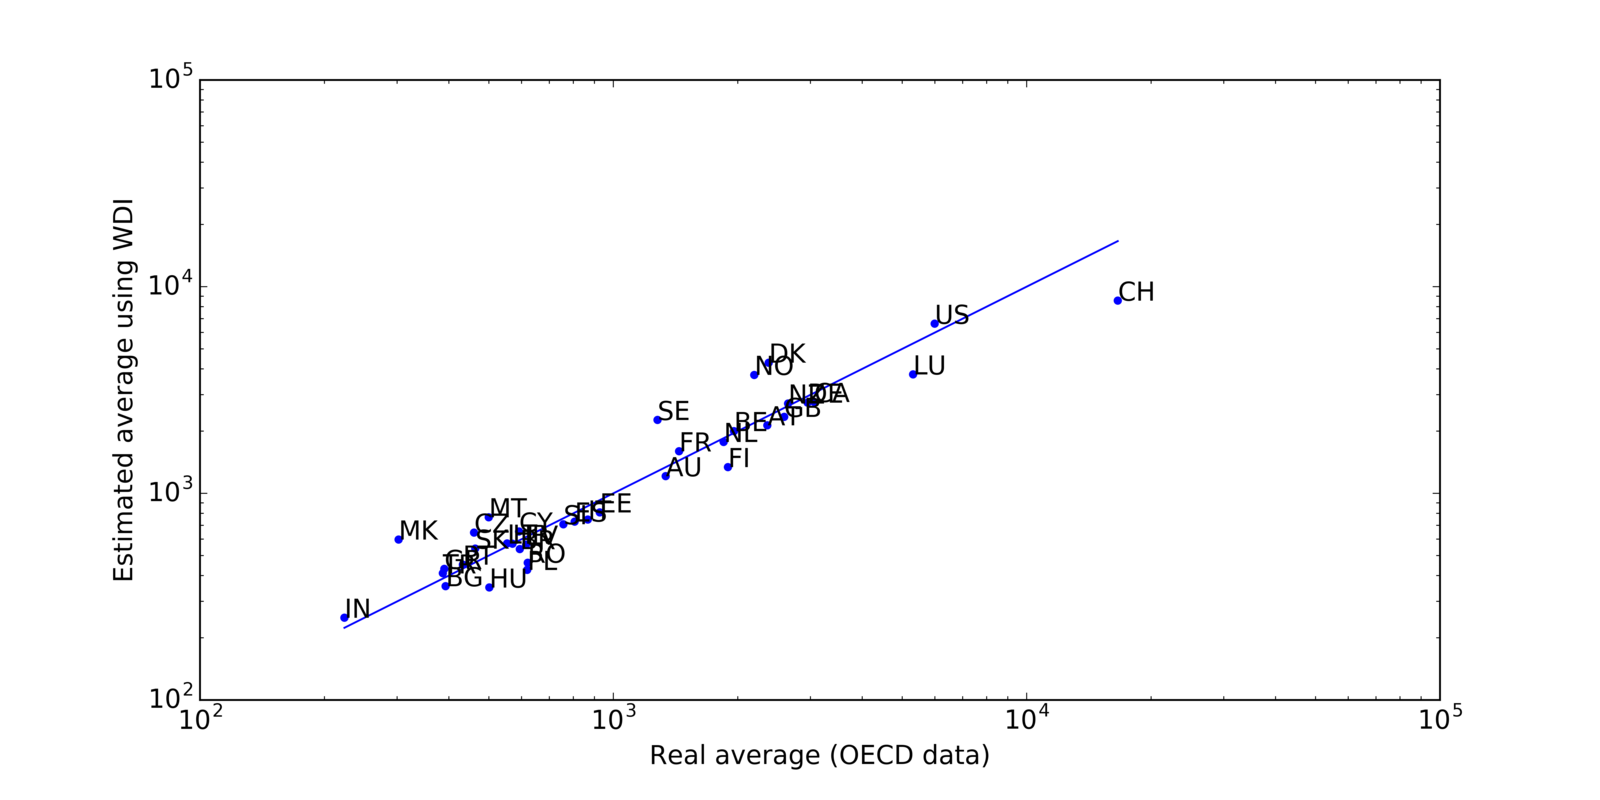
3.2.3. Macro-economics to estimate location parameter.
AVERAGE IN THE DATABASE
ESTIMATED AVERAGE

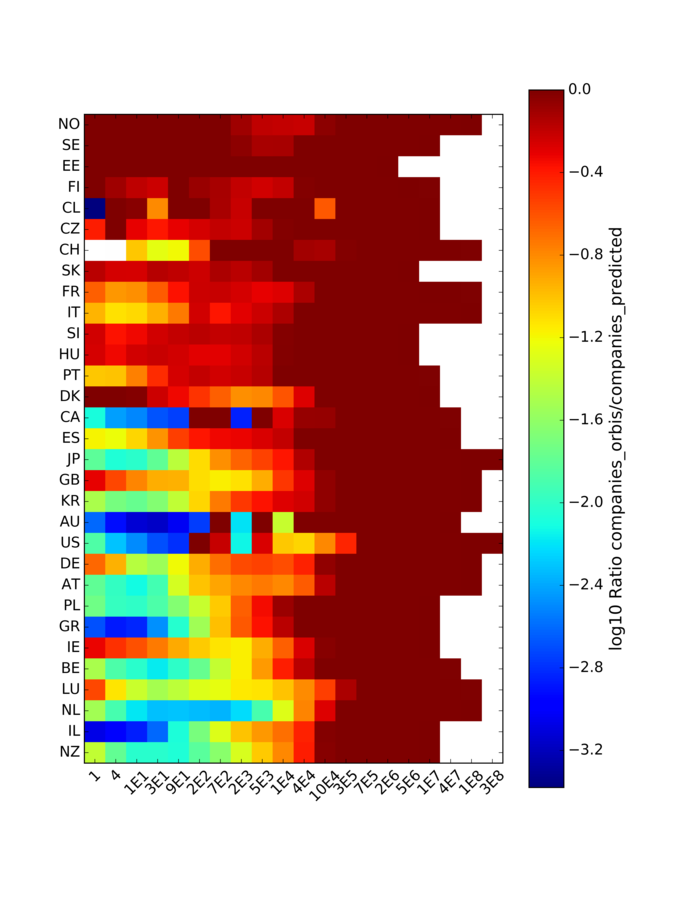
3.2.4. Assess completeness
- We have 1) observed average 2) estimated average.
- The relationship between both is proportional to completeness under reasonable assumptions
Company revenue
- We know which type of companies are missing.
- We know the directors associated to the type of companies that are missing.
- We can recreate companies and their directors and measure the impact on network measures (in progress).
4. Conclusions
We’re a multidisciplinary team, bringing together political science, computer science, network science, sociology, and based at the Amsterdam Insitute for Social Science Research.
We're hiring two PhD positions on corporate control and network analysis (see corpnet.uva.nl or @UvACORPNET for details)
Follow us on Twitter:
@javiergb_com
@UvACORPNET
Check our website:
http://corpnet.uva.nl/
Javier Garcia-Bernardo
garcia@uva.nl