NUsight: Building an
effective debugging tool
Josephus Paye II
Co-Team Leader, NUbots


NUsight
A collection of tools that provide realtime visualisation of debug data from one or more robots


🌐 web-based
many 🤖 to many 💻
The Elements of a Visual Debugging Tool
The Elements of a Visual Debugging Tool
Data
Rendering
Networking
the values and images to visualise

getting data from a robot into the debugging tool

displaying the data in a user interface, with interactive controls

Five Key Principles
Five Key Principles
Keep it simple
Use UDP with stateless messages
Use declarative, data-driven rendering
Go beyond numbers and graphs
Give users control over what is visualised
1. Keep It Simple
1. Keep It Simple


The system
is wrong
The debugger
is wrong
1. Keep It Simple
Minimise the number of settings and configuration options in the tool
Adopt design patterns and principles
that exclude certain classes of bugs
Keep the tool strictly as a viewer, responsible for displaying data only
2. Use UDP with Stateless Messages
2. Use UDP with Stateless Messages
TCP vs UDP
2. Use UDP with Stateless Messages
message Image {
    message Lens {
        enum Projection {
            UNKNOWN     = 0;
            RECTILINEAR = 1;
            EQUIDISTANT = 2;
            EQUISOLID   = 3;
        }

        Projection projection   = 1;
        float      focal_length = 2;
        float      fov          = 3;
        fvec2      centre       = 4;
        fvec2      k            = 5;
    }

    uint32                    format     = 1;
    uvec2                     dimensions = 2;
    bytes                     data       = 3;
    uint32                    camera_id  = 4;
    string                    name       = 5;
    google.protobuf.Timestamp timestamp  = 6;
    mat4                      Hcw        = 7;
    Lens                      lens       = 8;
}
Stateless messaging
3. Use Declarative,
Data-driven Rendering
3. Use Declarative,
Data-driven Rendering
Declarative vs Imperative Rendering
<!-- Declarative: SVG -->
<svg width="200" height="200">
    <rect width="100" height="100" fill="green" />
</svg>

<!-- Imperative: Canvas 2D -->
<canvas id="canvas" width="200" height="200" />
<script>
    let canvas = document.getElementById('canvas');
    let ctx = canvas.getContext('2d');
    ctx.fillStyle = 'green';
    ctx.fillRect(0, 0, 100, 100);
</script>
3. Use Declarative,
Data-driven Rendering
Data-driven Rendering


React.js
MobX
4. Go Beyond Numbers and Graphs
4. Go Beyond Numbers and Graphs
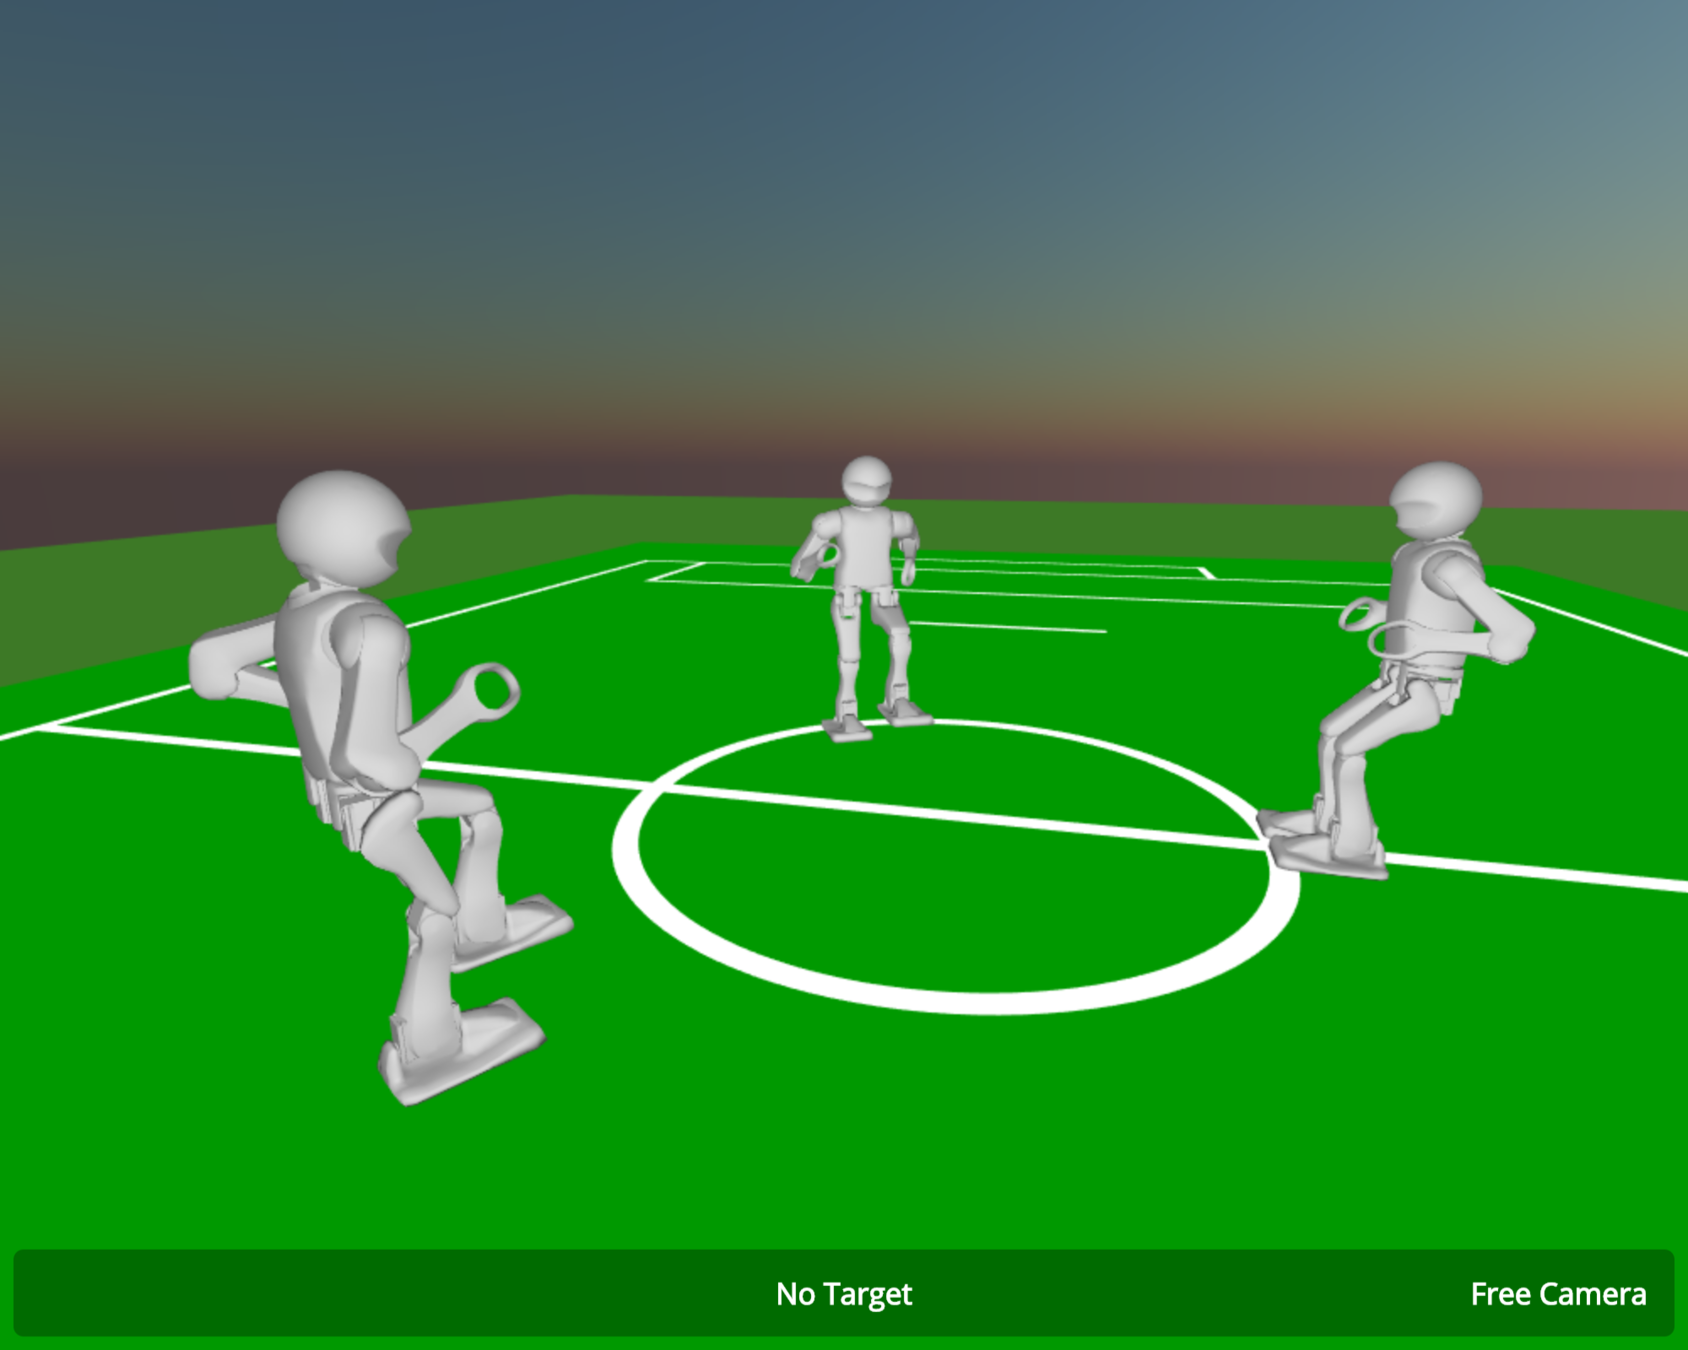
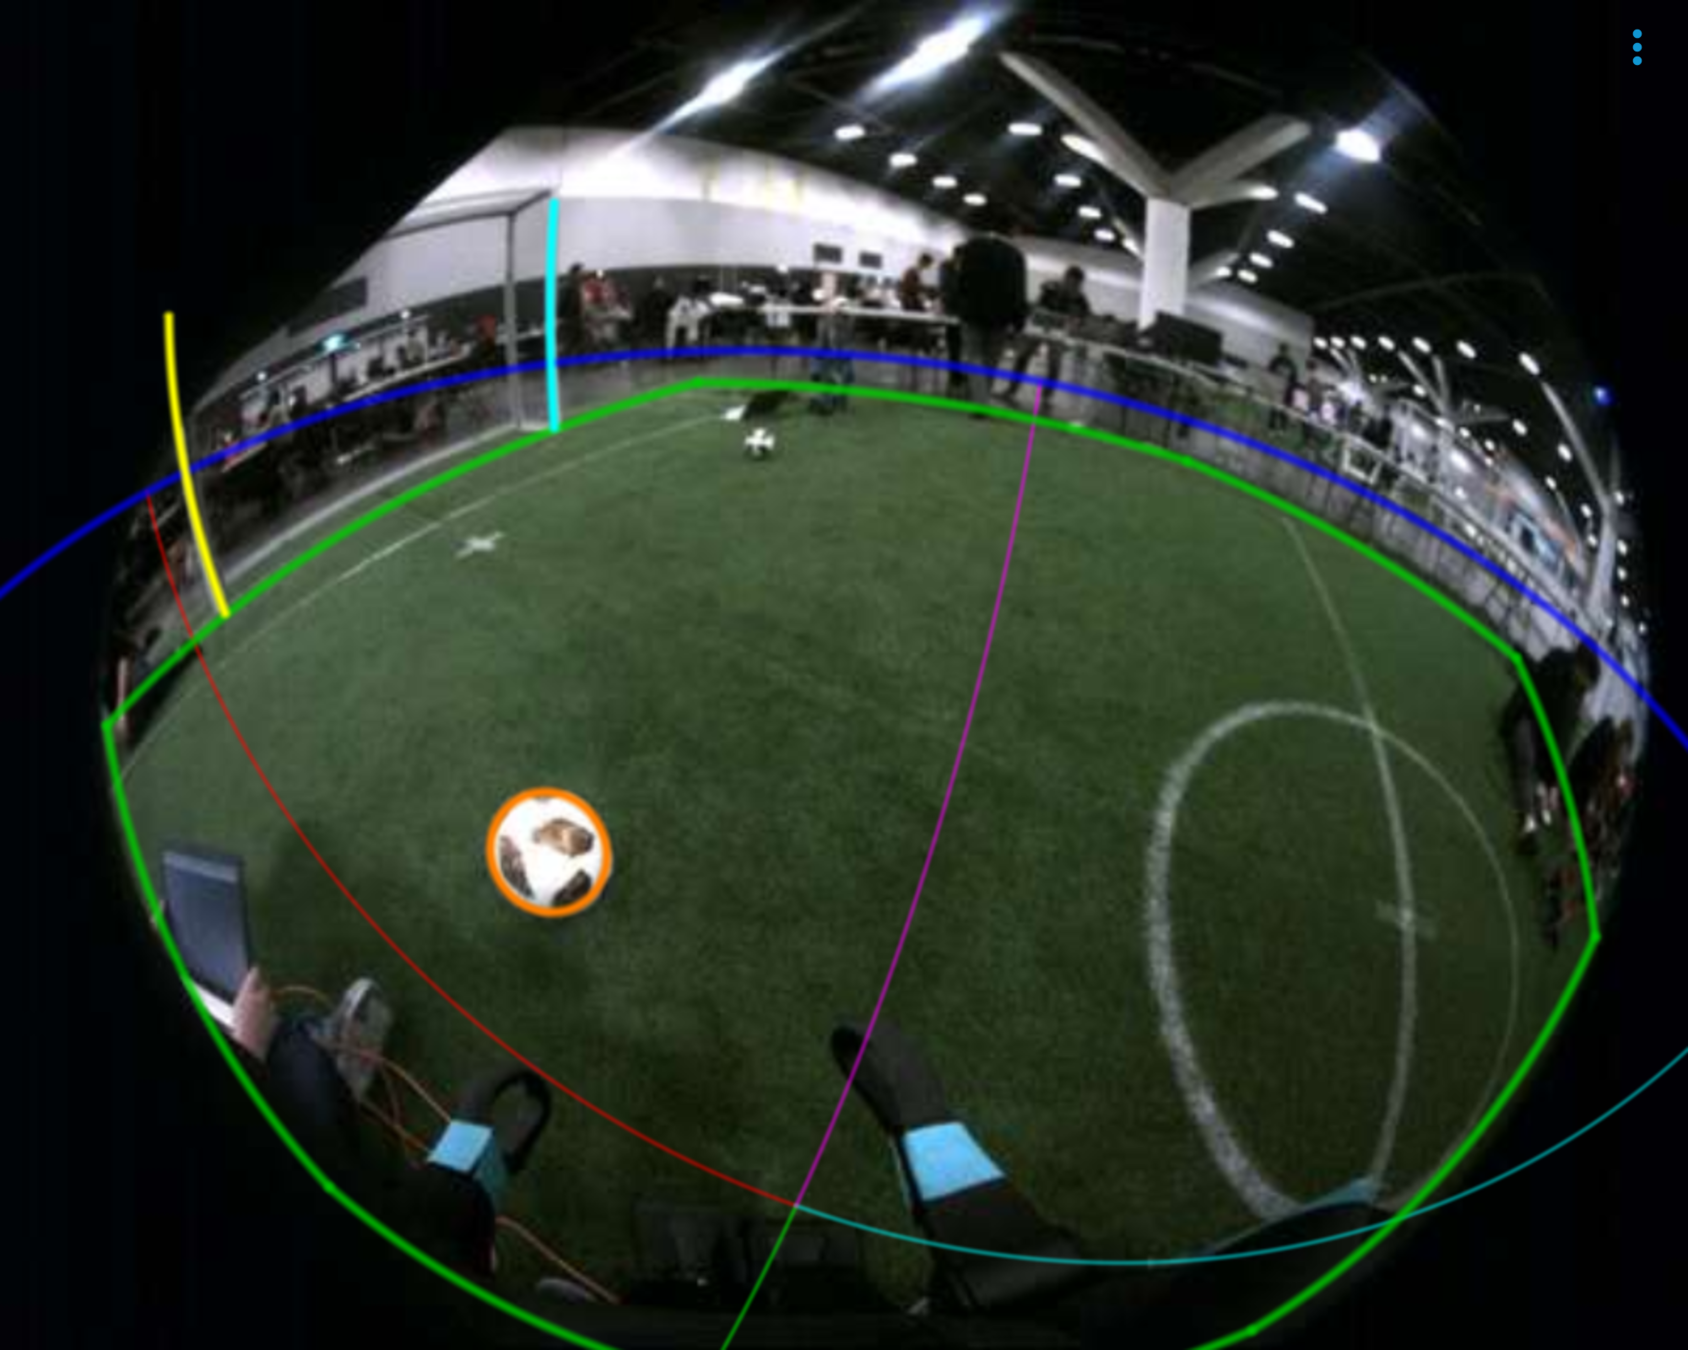
Make it look real where possible

Localisation
Vision
4. Go Beyond Numbers and Graphs

Visualise with context and system info
5. Give Users Control Over What is Visualised
5. Give Users Control Over What is Visualised
Give control where the data goes in (input)
# NUsight.yaml

# Select which data to send
reaction_handles:
  # Overview information for the dashboard, designed for minimum bandwidth
  overview: true
  # Motor positions, orientation, etc.
  sensor_data: false
  # Raw image
  image: false
  # compressed image
  compressed_image: false
  # Classified image
  classified_image: false
  # Vision objects including goals, balls and debugging lines
  vision_object: false
  # Visual mesh data
  visual_mesh: false
  # Green horizon data
  green_horizon: false
  # Localisation state estimates and uncertainties
  localisation: false
  # Data for chart tool in NUsight
  data_point: false
5. Give Users Control Over What is Visualised
Give control where the data comes out
Conclusion
Keep it simple
Use UDP with stateless networking
Use declarative, data-driven rendering
Go beyond numbers and graphs
Give users control over what is visualised
A realtime visual debugging tool is very useful and improves development efficiency when building complex systems like soccer playing robots.
Acknowledgement
Thanks to Brendan Annable, creator of NUsight, and Trent Houliston, contributor to NUsight, as well as the rest of the NUbots team for their help in preparing this presentation.
Links
NUsight is open source and available on GitHub (github.com/NUbots/NUsight2) and can be referred to when building your own debugging tool.
We are also happy to answer any questions you may have - email nubots@newcastle.edu.au