Title Text

Log aggregation for Kubernetes using Elasticsearch
Jonathan Seth Mainguy
Engineer @ Bandwidth
July 18th, 2019
Title Text

Why should we listen to you?
I am on the Systems Platform team at Bandwidth.
Part of our teams role is managing the Elastic Stack our internal customers use.
Another one of our teams roles is managing the openshift clusters the business uses.
Title Text

Whats the problem?
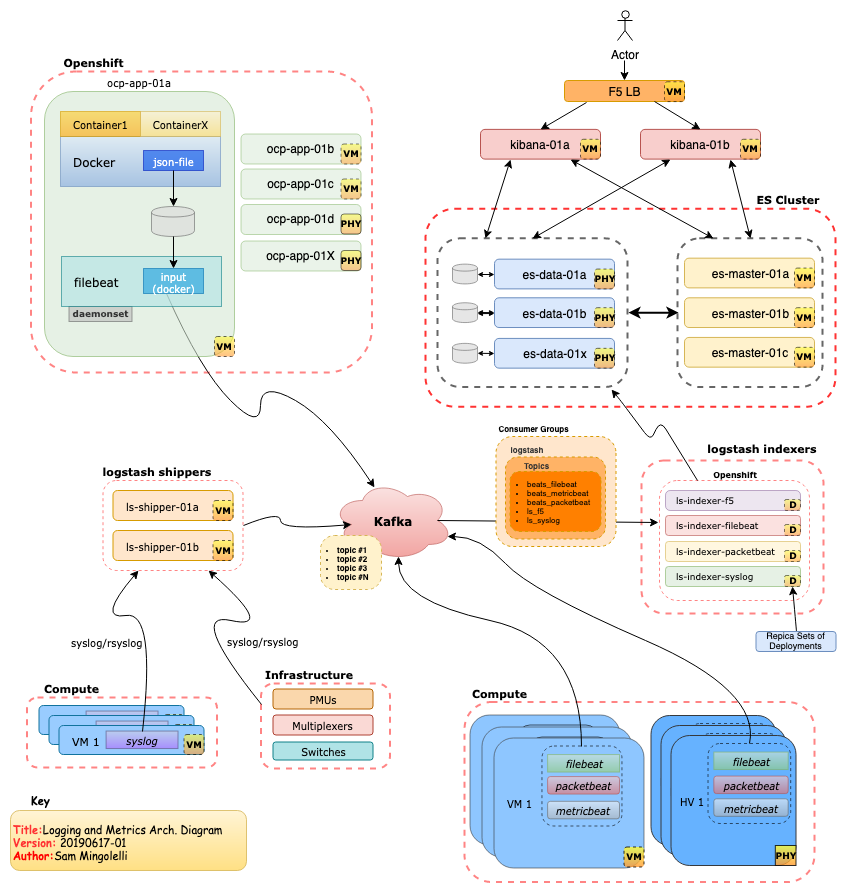
We wanted a single location for all our logs and metrics for vms, physical boxes, and kubernetes clusters.
This gives us, and our internal customers a familiar experience when debugging issues.
Title Text

Whats Elastic Stack?
Elasticsearch, Kibana, Beats, and Logstash
Most of which is open source and can be used for free.
Elastic provides paid support, service, and a few additional features that are paid only.
Title Text

Elasticsearch
Elasticsearch is an open-source, RESTful, distributed search and analytics engine built on Apache Lucene
Title Text

Elasticsearch
You can send data in the form of JSON documents to Elasticsearch using the API or ingestion tools such as Logstash.
You can then search and retrieve the document using the Elasticsearch API or a pretty UI like Kibana.
Title Text

Kibana
Kibana is a pretty UI. For our internal users, this is the only part of the stack they pay attention to.
It makes searching much easier to use and understand than trying to GET to the api by hand.
You can make pretty graphs in it as well.
Title Text

Beats
Not just overpriced mediocre headphones.
Beats - Gather data and ship to Elasticsearch (or a buffer like Kafka if you prefer)
Title Text

Beats
- Filebeat - Tails logs
- This is how we get stdout from our containers into Elasticsearch (docker json logs on host)
-
Metricbeat helps you monitor your servers by collecting metrics from the system and services running on the server
- We use it to query the k8s api to get "events" into elasticsearch among other things.
- Packetbeat - We use it to ship DNS protocol data to Elasticsearch
- Useful to see if DNS is working.
Title Text

Logstash
server-side data processing pipeline that ingests data, transforms it, and then sends it to your favorite "stash."
Ingest
We use it to get syslog from appliances into Kafka, similar to how our beats for products that support it, send to Kafka.
Ingest and Transform
We also use it to ingest all data from kafka, and optionally "drop" namespaces from being logged.
Title Text

Logstash
Send
After ingesting and transforming from Kafka, we finally send the data to our Elasticsearch servers.
Title Text

Kafka
Not part of the Elasticsearch offering, but a big part of our Elastic Stack flow.
Apache Kafka is a community distributed event streaming platform capable of handling trillions of events a day. Initially conceived as a messaging queue.
We use it as a buffer between beats and elasticsearch, also provides us with disaster recovery via its replay ability.
Title Text


Title Text

Complicated
there are a lot of pieces, that can be complex to understand and manage
Title Text

/etc/sysconfig/docker on the K8 nodes
# /etc/sysconfig/docker

# Modify these options if you want to change the way the docker daemon runs
OPTIONS=' --selinux-enabled --log-driver=json-file --log-opt max-size=10m/var/lib/docker/containers/long-random-uid-json.logGenerates json logs to a location like
Title Text

Filebeat Daemonset
---
apiVersion: extensions/v1beta1
kind: DaemonSet
metadata:
  name: filebeat
  namespace: filebeat
  labels:
    k8s-app: filebeat
    kubernetes.io/cluster-service: "true"
spec:
  template:
    metadata:
      labels:
        k8s-app: filebeat
        kubernetes.io/cluster-service: "true"
    spec:
      serviceAccountName: filebeat
      terminationGracePeriodSeconds: 30
      containers:
      - name: filebeat
        image: docker.elastic.co/beats/filebeat:6.5.1
        args: [
          "-c", "/etc/filebeat.yml",
          "-e",
        ]
Title Text

Filebeat Daemonset
        securityContext:
          runAsUser: 0
          privileged: true
        resources:
          limits:
            memory: 200Mi
          requests:
            cpu: 100m
            memory: 100Mi
        volumeMounts:
        - name: config
          mountPath: /etc/filebeat.yml
          readOnly: true
          subPath: filebeat.yml
        - name: prospectors
          mountPath: /usr/share/filebeat/prospectors.d
          readOnly: true
        - name: data
          mountPath: /usr/share/filebeat/data
        - name: varlibdockercontainers
          mountPath: /var/lib/docker/containers
          readOnly: true
Title Text

Filebeat Daemonset
      volumes:
      - name: config
        configMap:
          defaultMode: 0600
          name: filebeat-config
      - name: varlibdockercontainers
        hostPath:
          path: /var/lib/docker/containers
      - name: prospectors
        configMap:
          defaultMode: 0600
          name: filebeat-prospectors
      - name: data
        emptyDir: {}
Title Text

filebeat.yml
---
apiVersion: v1
kind: ConfigMap
metadata:
  name: filebeat-config
  namespace: filebeat
  labels:
    k8s-app: filebeat
    kubernetes.io/cluster-service: "true"
data:
  filebeat.yml: |-
    logging.json: true
    filebeat.config:
      filebeat.autodiscover:
        providers:
           - type: kubernetes
             hints.enabled: true
      inputs:
        # Mounted `filebeat-prospectors` configmap:
        path: ${path.config}/prospectors.d/*.yml
        # Reload prospectors configs as they change:
        reload.enabled: false
      modules:
        path: ${path.config}/modules.d/*.yml
        # Reload module configs as they change:
        reload.enabled: false
    output.kafka:
      hosts: ["{{ kafka_hosts }}"]
      topic: "beats_filebeat"
      version: 0.10.1
      username: "{{ filbeatproducer_user" }}
      password: "{{ filebeatproducer_secret }}"
Title Text

Filebeat Prospector
---
apiVersion: v1
kind: ConfigMap
metadata:
  name: filebeat-prospectors
  namespace: filebeat
  labels:
    k8s-app: filebeat
    kubernetes.io/cluster-service: "true"
data:
  kubernetes.yml: |-
    - type: docker
      containers.ids:
      - "*"
      processors:
        - add_kubernetes_metadata:
            in_cluster: true
      json.keys_under_root: true
      json.add_error_key: true
      json.message_key: message
      json.overwrite_keys: true
      json.ignore_decoding_error: true
      fields:
        kubernetes.cluster.site: {{ subdomain }}
      fields_under_root: true
      scan_frequency: 1s
Title Text

Ansible to deploy
    - name: Apply yamls
      k8s:
        verify_ssl: false
        state: present
        definition: "{{ item }}"
      with_items:
        - "{{ lookup('template', 'filebeat-config.yaml') }}"
        - "{{ lookup('template', 'filebeat-prospectors.yaml') }}"
        - "{{ lookup('file', 'filebeat-cluster-role-binding.yaml') }}"
        - "{{ lookup('file', 'filebeat-cluster-role.yaml') }}"
        - "{{ lookup('file', 'filebeat-daemonset.yaml') }}"
        - "{{ lookup('file', 'filebeat-service-account.yaml') }}"
      no_log: true
Title Text

How Filebeat collects logs on Kubernetes
Docker outputs logs to that long directory.
Filebeat pods run in a Daemonset, one per node
They run as a privileged pod that volume mounts directories from the Hosts filesystem.
Filebeat then scans for these logs once a second, and ships their contents as documents to Kafka.
Title Text

Logstash - Indexer
apiVersion: apps/v1
kind: Deployment
metadata:
  name: ls-indexer-filebeat
  namespace: ls-indexer
spec:
  replicas: 15
  revisionHistoryLimit: 2
  selector:
    matchLabels:
        app: ls-indexer-filebeat
  strategy:
    activeDeadlineSeconds: 21600
    resources: {}
    rollingParams:
      intervalSeconds: 1
      maxSurge: 25%
      maxUnavailable: 25%
      timeoutSeconds: 600
      updatePeriodSeconds: 1
    type: RollingUpdate
  template:
    metadata:
      creationTimestamp: null
      labels:
        app: ls-indexer-filebeat
Title Text

Logstash - Indexer
    spec:
      containers:
      - args:
        - -c
        - bin/logstash-plugin install logstash-filter-prune && bin/logstash
        command:
        - /bin/sh
        env:
        - name: POD_NAMESPACE
          valueFrom:
            fieldRef:
              apiVersion: v1
              fieldPath: metadata.namespace
        image: docker.elastic.co/logstash/logstash:6.5.4
        imagePullPolicy: IfNotPresent
        name: ls-indexer-filebeat
        resources:
          limits:
            cpu: "2"
            memory: 2000Mi
          requests:
            cpu: "1"
            memory: 1000Mi
        terminationMessagePath: /dev/termination-log
        terminationMessagePolicy: File
Title Text

Logstash - Indexer
        volumeMounts:
        - mountPath: /usr/share/logstash/pipeline/logstash.conf
          name: config-filebeat
          readOnly: true
          subPath: filebeat.conf
        - mountPath: /usr/share/logstash/jaas.conf
          name: config-jaas
          readOnly: true
          subPath: jaas.conf
        - mountPath: /usr/share/logstash/ca.crt
          name: config-ca-crt
          readOnly: true
          subPath: ca.crt
        - mountPath: /usr/share/logstash/config/logstash.yml
          name: config-logstash-yml
          readOnly: true
          subPath: logstash.yml
        - mountPath: /usr/share/logstash/vendor/bundle/jruby/2.3.0/gems/logstash-patterns-core-4.1.2/patterns/grok-custom-patterns
          name: grok-custom-patterns
          readOnly: true
          subPath: grok-custom-patterns
Title Text

Logstash - Indexer
      dnsPolicy: ClusterFirst
      restartPolicy: Always
      schedulerName: default-scheduler
      securityContext: {}
      terminationGracePeriodSeconds: 30
      volumes:
      - configMap:
          defaultMode: 384
          name: config-logstash-yml
        name: config-logstash-yml
      - configMap:
          defaultMode: 384
          name: config-filebeat
        name: config-filebeat
      - configMap:
          defaultMode: 384
          name: config-jaas
        name: config-jaas
      - configMap:
          defaultMode: 384
          name: config-ca-crt
        name: config-ca-crt
      - configMap:
          defaultMode: 384
          name: grok-custom-patterns
        name: grok-custom-patterns
Title Text

Logstash - Filebeat index - conf
apiVersion: v1
data:
  filebeat.conf: |
    input {
      kafka {
        consumer_threads => 1
        topics => ["beats_filebeat"]
        bootstrap_servers => "{{ logstash_bootstrap_servers }}"
        sasl_mechanism => "PLAIN"
        security_protocol => "SASL_PLAINTEXT"
        jaas_path => "/usr/share/logstash/jaas.conf"
        codec => "json"
        add_field => {
          "[@metadata][logtype]" => "filebeat"
        }
      }
    }
Title Text

Logstash - Filebeat index - conf
    filter {

      if [@metadata][logtype] == "filebeat" and ("noisy-neighbor" in [kubernetes][namespace]) {
        drop { }
      }


    output {
    if "index" in [fields] {
       elasticsearch {
         hosts => {{ logstash_elasticsearch_url }}
         user => {{ logstash_elasticsearch_username }}
         cacert => "/usr/share/logstash/ca.crt"
         password => "{{ logstash_elasticsearch_password }}"
         index => "%{[fields][index]}-%{[beat][version]}-%{+YYYY.MM.dd}"
         manage_template => false
       }
      }
Title Text

Metricbeat conf
---
# Deploy a Metricbeat instance per node for node metrics retrieval
apiVersion: extensions/v1beta1
kind: DaemonSet
metadata:
  name: metricbeat
  namespace: metricbeat
  labels:
    k8s-app: metricbeat
spec:
  template:
    metadata:
      labels:
        k8s-app: metricbeat
    spec:
      serviceAccountName: metricbeat
      terminationGracePeriodSeconds: 30
      hostNetwork: true
      dnsPolicy: ClusterFirstWithHostNet
      containers:
      - name: metricbeat
        image: docker.elastic.co/beats/metricbeat:6.5.1
        args: [
          "-c", "/etc/metricbeat.yml",
          "-e",
          "-system.hostfs=/hostfs",
        ]
Title Text

Metricbeat conf
        securityContext:
          runAsUser: 0
          privileged: true
        resources:
          limits:
            cpu: 200m
            memory: 200Mi
          requests:
            cpu: 100m
            memory: 100Mi
        volumeMounts:
        - name: config
          mountPath: /etc/metricbeat.yml
          readOnly: true
          subPath: metricbeat.yml
        - name: modules
          mountPath: /usr/share/metricbeat/modules.d
          readOnly: true
        - name: dockersock
          mountPath: /var/run/docker.sock
        - name: proc
          mountPath: /hostfs/proc
          readOnly: true
        - name: cgroup
          mountPath: /hostfs/sys/fs/cgroup
          readOnly: true
Title Text

Metricbeat conf
      volumes:
      - name: proc
        hostPath:
          path: /proc
      - name: cgroup
        hostPath:
          path: /sys/fs/cgroup
      - name: dockersock
        hostPath:
          path: /var/run/docker.sock
      - name: config
        configMap:
          defaultMode: 0600
          name: metricbeat-daemonset-config
      - name: modules
        configMap:
          defaultMode: 0600
          name: metricbeat-daemonset-modules
      - name: data
        hostPath:
          path: /var/lib/metricbeat-data
          type: DirectoryOrCreate
Title Text

Metricbeat.yml
---
apiVersion: v1
kind: ConfigMap
metadata:
  name: metricbeat-deployment-modules
  namespace: metricbeat
  labels:
    k8s-app: metricbeat
data:
  # This module requires `kube-state-metrics` up and running under `kube-system` namespace
  kubernetes.yml: |-
    - module: kubernetes
      metricsets:
        - state_node
        - state_deployment
        - state_replicaset
        - state_pod
        - state_container
      period: 10s
      host: ${NODE_NAME}
      hosts: ["kube-state-metrics.openshift-monitoring.svc:8443"]
Title Text

Metricbeat.yml
    # Kubernetes events
    - module: kubernetes
      enabled: true
      metricsets:
        - event

    - module: kubernetes
      enabled: true
      metricsets:
        - apiserver
      hosts: ["https://kubernetes.default.svc"]
      bearer_token_file: /var/run/secrets/kubernetes.io/serviceaccount/token
      ssl.certificate_authorities:
        - /var/run/secrets/kubernetes.io/serviceaccount/service-ca.crt
Title Text

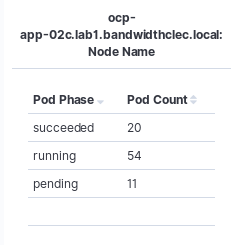
Gets us kewl metrics like

Title Text

Openshift 3.x ships with a built in elastic stack
It creates an index per namespace, in our use case this became unmanageable with thousands of index's very quickly.
However it is an easy way to try out elastic and get a feel for some of the components.
Title Text

Elastic has a K8's operator for standing up a stack.
Title Text

Pain Points
elasticsearch isnt optimized for deleting documents.
Sam wrote tooling to delete specific documents for us, takes 12 hours to delete 100M docs
We have one filebeat index per day, in our lab this sits around 385 Million documents on average.
Title Text

Elastic scales (cuz it's stretchy)
So far we have moved our logstash indexers into kubernetes, they had previously been dedicated VMs.
This allows us to set our deployment to have one logstash pod per kafka topic partition, to speed up our consumption of documents.
Title Text

Elastic scales (cuz it's stretchy)
All the parts of Elastic would work well in kubernetes.
Elasticsearch and Kibana are java apps.
We like having bare metal boxes for our elastic data to live on, however we can move kibana and ls-shipper to kubernetes when we have some time to do so.
Title Text

Elastic scales (cuz it's stretchy)

Title Text

Shards?
We aim to keep each shard below 50G and create the amount of shards per index based on this.
Title Text

Questions?
Title Text

Company I work at: https://www.bandwidth.com/
Bandwidth is hiring for lots of tech roles, one of which is a role for someone with "elasticsearch / lucene / kakfa" experience.
My referral link
https://grnh.se/6nykfp1
Title Text
