Introduction
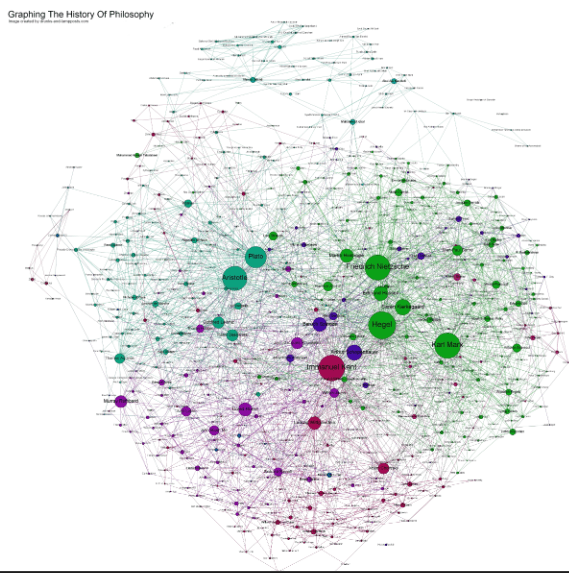
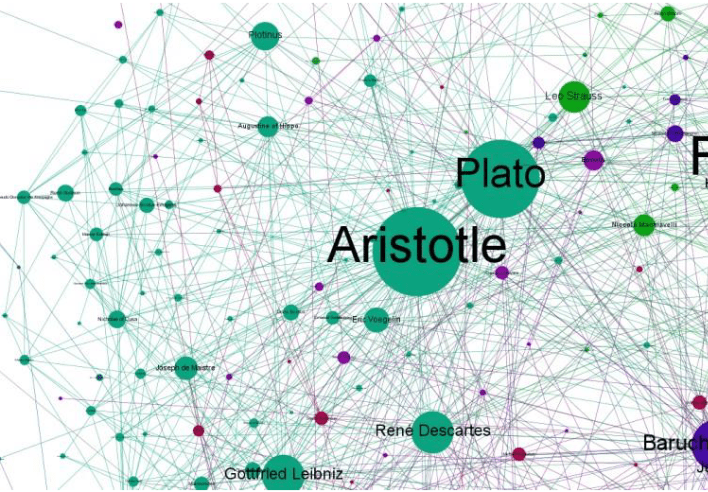
Social Network Analysis
Historical Prospective
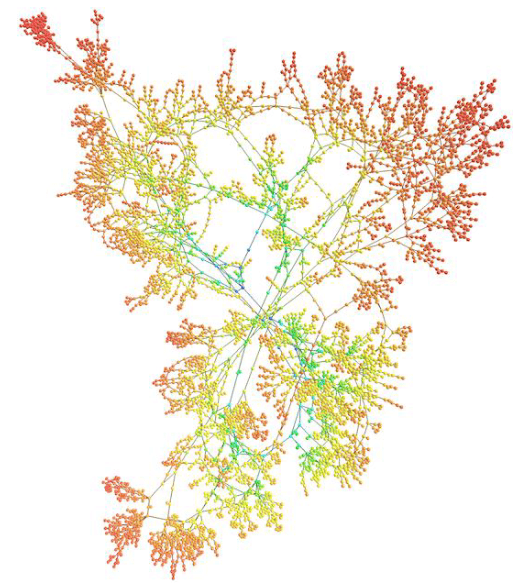
Complex Networks
- not regular, but not random
- non-trivial topology
- universal properties
- everywhere
- complex systems
Complex Networks
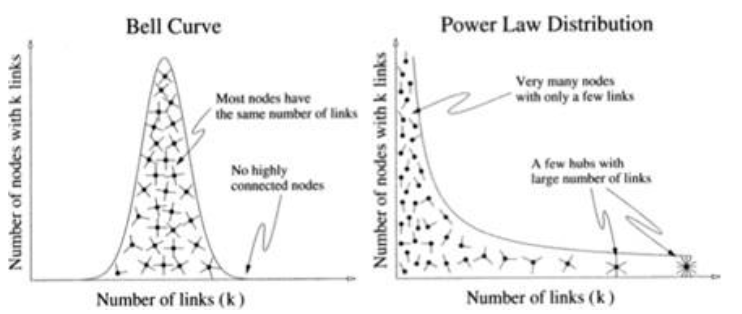
- power law node degree distribution: ”scale-free” networks
- small diameter and average path length: ”small world” networks
- hight clustering coefficient: transitivity
Power law
Power law
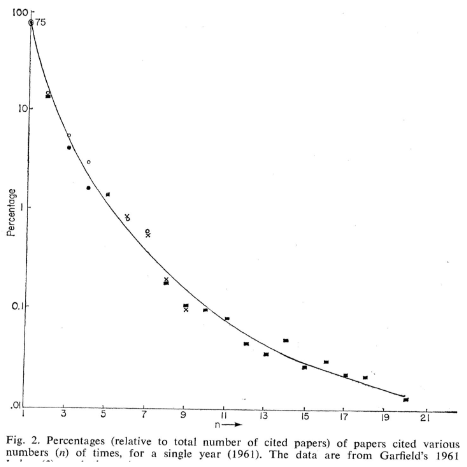
Power Law
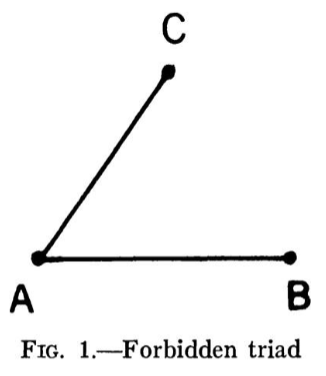
Triads
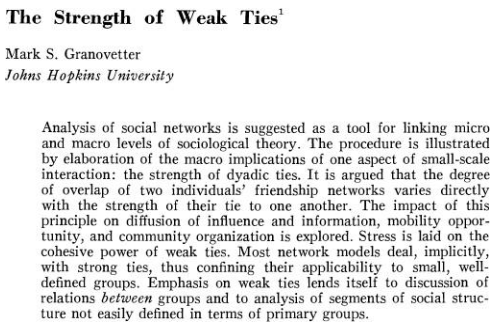
- ”The Strength of Weak Ties”, Mark Grannoveter, 1973
- ”Spread of Information through a Population with Socio-Structural Bias. Assumption of Transitivity”, Anatol Rapoport, 1953

Triads
If A and B and B and C are strongly linked, the the tie between B and C is always present
Grannoveter, 1973
- strength of a tie
- high transitivity
- high clustering coefficient
High Clustering Coefficient

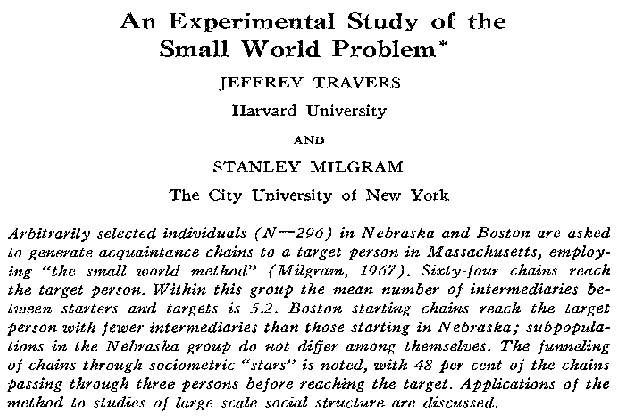
Stanley Milgram's experiment
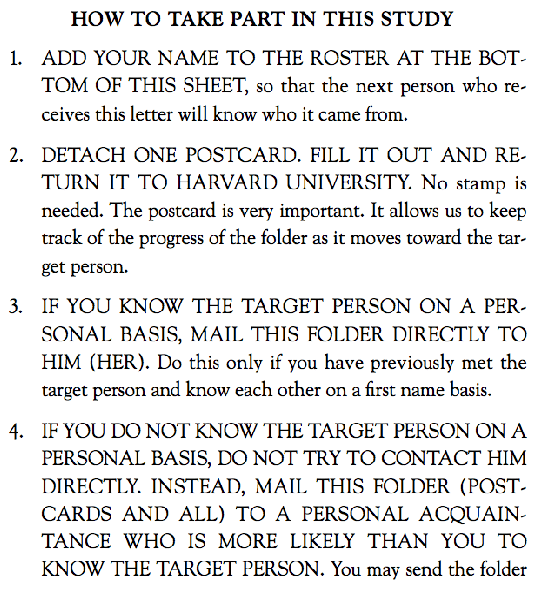
Stanley Milgram's experiment
Stanley Milgram's experiment
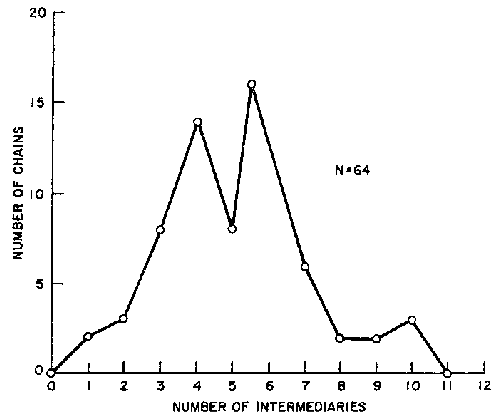
- Reached the target N = 64(29%)
- Average chain length (L) = 5.2
- Channels:
- hometown (L) = 6.1
- business contacts (L) = 4.6
- from Boston (L) = 4.4
- from Nebraska (L) = 5.7
Stanley Milgram's experiment
- Email graph:
- D. Watts (2001), 48,000 senders, (L) ≈ 6
- MSN Messenger graph:
- J. Lescovec et al (2007), 240mln users, (L) ≈ 6.6
- Facebook graph:
- L. Backstrom et al (2012), 721 mln users, (L) ≈ 4.74

Spring of Neural Networks

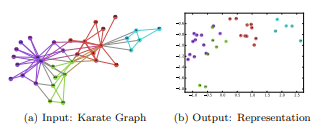
Shallow embeddings
- DeepWalk: online learning of social representations, KDD 14, Cited by 10349, [pdf]
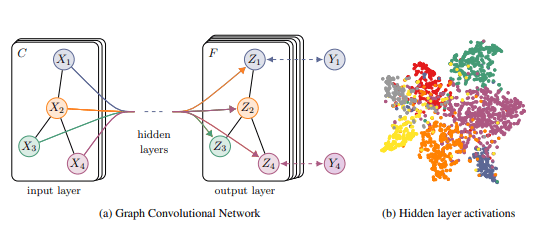
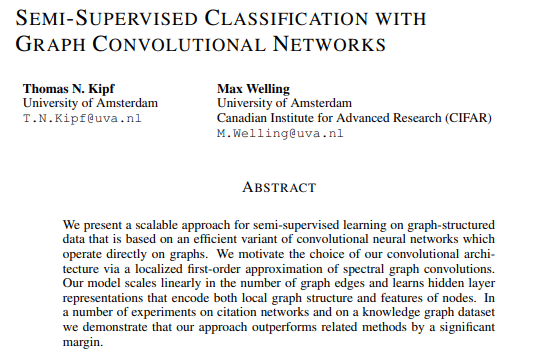
Complex Embeddings
- Semi-Supervised Classification with Graph Convolutional Networks, ICLR17, Cited by 30292, [pdf]

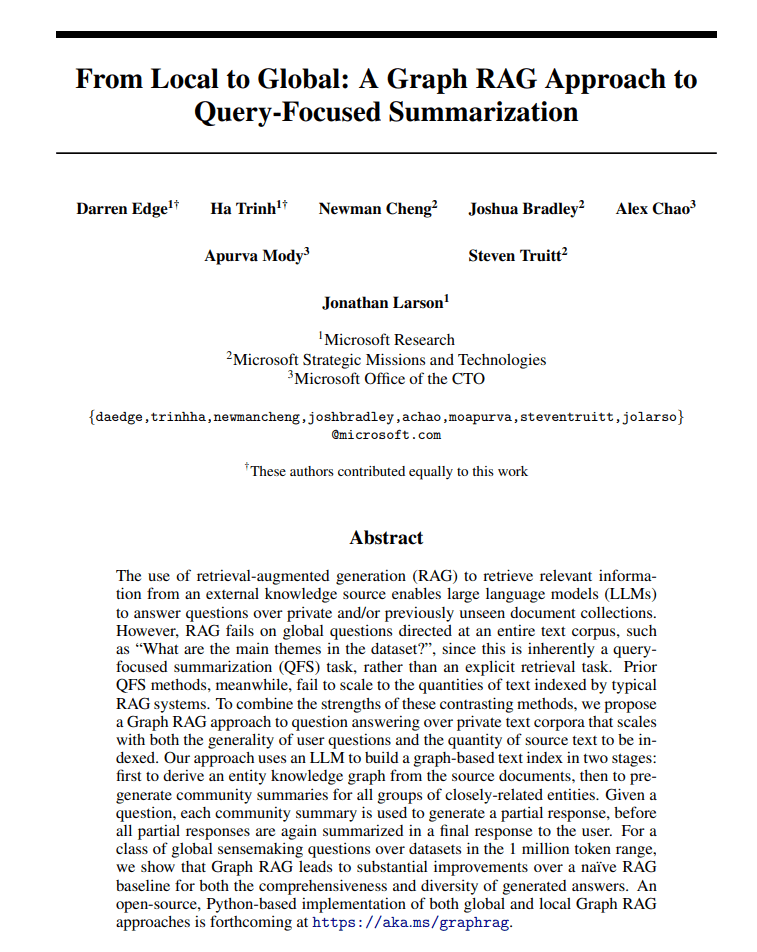
GraphRag
- From Local to Global: A Graph RAG Approach to Query-Focused Summarization, [pdf]
Содержание курса (1/3)
- Введение в Network Science — задачи, источники данных; практика: Gephi.
- Базовые определения I (метрики целого графа) — пути, диаметр, кластеризация.
- Инструменты анализа — форматы графов и тулчин.
- Базовые определения II (метрики вершин) — betweenness, closeness, PageRank, degree, cores, motifs, HITS, двудольные графы. Практика: NetworkX/igraph.
- Community Detection — модульность, спектральные методы, Лувен/Лейден; практика: Python.
Содержание курса (2/3)
- Block Modeling — типы, алгоритмы, матрица изображений и интерпретация.
- Сетевые модели — Эрдёш–Реньи, preferential attachment, small-world; практика: генерация графов.
- Распространение/эпидемиология — SI/SIS/SIR, слухи; практика: ndlib.
- Графовые эмбеддинги — unsupervised, factorization, random walk; практика: link prediction.
- GNN I — message passing, DGL; практика: классификация узлов.
Содержание курса (3/3)
- GNN II — link prediction, классификация графов, SOTA особенности.
- Текстовые графы и KGs — анализ сообщений, JODIE; практика: Entity Linking в DGL.
- Поиск на графах : FAISS, Gensim, Elasticsearch, RAG.
- Темпоральные графы — модели, структуры данных, динамические процессы.
- Гостевая лекция — применимость SNA (рекомендательные системы и др.).
1. Introduction to Network Science, Tools for Graph Analysis and Visualization
Theory:
- Tasks and applications of network analysis
- Key ideas in network analysis from its origins to recent advancements
- Overview of the most authoritative journals and conferences
- Practical examples of network analysis applications
Brief review of available data sources for graph construction
Practice
- Gephi
2. Basic Definitions in Network Analysis: Whole Graph Characteristics, Node-Level Characteristics
Theory:
- Concepts of graph, vertices, edges, incidence matrix, connectivity, vertex closeness, diameter, graph paths, and average path length.
- betweenness, closeness, PageRank, degree, cores, graph motifs, bipartite networks, HITS
Practice
- NetworkX
- IGraph
- Familiarization with graph processing packages (Python)
- Practical application of node-level metrics
-
Calculating node characteristics in graphs
3. Community Detection
Theory:
- Cohesive subgroups, graph cliques, network communities, graph partitioning, modularity, boundary betweenness, spectral partitioning, modularity maximization, heuristic methods, label propagation, rapid community evolution, walktrap algorithm.
- Characteristics of empirical models and generative models.
- Random graph model, phase transition, growing random graphs, preferential attachment model, small-world model, Erdős–Rényi model, preferential embedding
Practice
- Data collection and preparation for analysis.
- Community detection and clustering in Python.
- Generating random graphs
4. Information Propagation and Epidemiological Models on Graphs
Theory:
- Epidemic models on networks.
- SI, SIS, and SIR models, rumor spreading, propagation trees
Practice
- Epidemic modeling using ndlib
5. Graph Embeddings
Theory:
- Unsupervised graph embeddings, matrix factorization, random walk methods
Practice
- Link prediction using unsupervised embeddings
6. Graph Neural Networks
Theory:
- Message passing model
- Overview of libraries such as Deep Graph Library (DGL) and PyTorch Geometric (PyG)
- GIANT model, Weisfeiler-Lehman algorithm, and analysis of large graphs
Practice
- Node classification using DGL
- Whole graph classification
- Features of SOTA (State-of-the-Art) classification algorithms
7. Graphs in Recommender Systems, Temporal Graphs
Theory:
- Problem formulation for recommender systems
- Models of temporal networks
- Data structures and encoding
- Measurements and properties of temporal networks
- Dynamic processes in temporal networks, algorithms, and analysis methods
Practice
- Implementation of LightGCN
8. Text Graphs and Knowledge Graphs, Graphs in Search Systems
Theory:
- Construction of knowledge graphs
- Graph-based search
- HNSW
- RAG
- GraphRag
Practice
- Entity linking using DGL
- Familiarization with information retrieval tools such
- Fais
- Gensim
- Elasticsearch
Course grading
if \( Grade \) >= 6, student can skip exam
else:
where N - is the number of quizes;
W - is the number of contests.
Retaking the exam
The procedure for the first retake and the thematic composition of questions are similar to the exam. The score is given at the end of the meeting.
The procedure for the second retake and the thematic composition of questions are similar to the exam. The retake is carried out in the presence of at least three members of the commission, including its chairman. The score is given at the end of the meeting. The score for the second retake is set by agreement of the members of the commission. In case of divergence of assessments, the decision is made by a majority of votes, in case of equality of votes, the assessment of the chairman of the commission is decisive. Blocking elements are not provided.
Course logistics
- Lectures and Practice are held each Thursday 18:10, D-501;
- Discussions and Announcements in telegram chat;

- All deadlines are 23:59 pm anywhere on earth
- Consulting hours booking page
Система оценивания — формулы
Текущая активность
Ghw = Quiz1..N / 2 + Contest1..M / 2
Contest1 — сообщества; Contest2 — распространение; Contest3 — кредитный скоринг.
Проект
Gpr = CP1 + CP2 · 20 + Research Proposal · 10 + Preprocessing & Data Loading · 10 + EDA · 20 + Research Hypothesis Validation · 10 + Interpretation · 10 + Project Presentation · 10 + Final Paper · 20
CP1/CP2 — сдача промежуточных результатов в срок.
Итог: G = 0.5 · Ghw + 0.5 · Gpr
Экзамен / автомат
- Если G ≥ 6.0 — возможен автомат, равный накопленной оценке.
- Если G < 6.0 — устный экзамен (3 вопроса).
Оценка за экзамен: Gex = 0.6 · questions(mark) + 0.4 · G
Точные формулировки вопросов см. в списке экзаменационных тем.
SNA Coins 2025
Как это работает?
- За активность и результаты вы получаете SNA Coins.
- Баллы можно тратить индивидуально или в складчину.
- Учёт баллов: публичный Google Sheet.
Как заработать?
| Активность | Баллы |
|---|---|
| Лучший проект — 1 место | +100 |
| Лучший проект — 2 место | +60 |
| Лучший проект — 3 место | +40 |
| Контест — 1/2/3 место | +20 / +12 / +7 |
| Обзор статьи на семинаре (15-20 мин) | +10 |
| Своевременная сдача контеста | +5 |
| Своевременная сдача квиза | +2 |
| Хороший вопрос на семинаре | +1 |
| Помощь одногруппникам | +2–5 |
| Организация study group | +5 |
| Сдача этапа проекта до дедлайна | +3 |
Анти-фарм правила
- Вопросы с баллами: 2 за семинар.
- Обзор статьи: ≤2 на студента за семестр.
- Дубли активности не считаются.
Прозрачность
- Открытый рейтинг:
/leaderboard. - История начислений в Google Sheet.
На что тратить?
| Награда | Стоимость |
|---|---|
| 100 compute-часов на GPU | 20 |
| Консультация (1 час) | 10 |
| Консультация внешнего эксперта | 70 |
| Гостевая лекция эксперта (групповая) | 120 |
| Мини-стажировка в лаборатории | 150 |
| Мини-стажировка в компании | 180 |