Politics through the Lens of Economics
Lecture 3: Income Redistribution
Masayuki Kudamatsu
18 October, 2017
Did you pick a policy?
For your term paper...
Now it's
Discussion time
For your term paper...
Discussion Time
For your term paper...
Does the Median Voter Theorem explain
why the consumption tax rate isn't higher than 8% in Japan today?

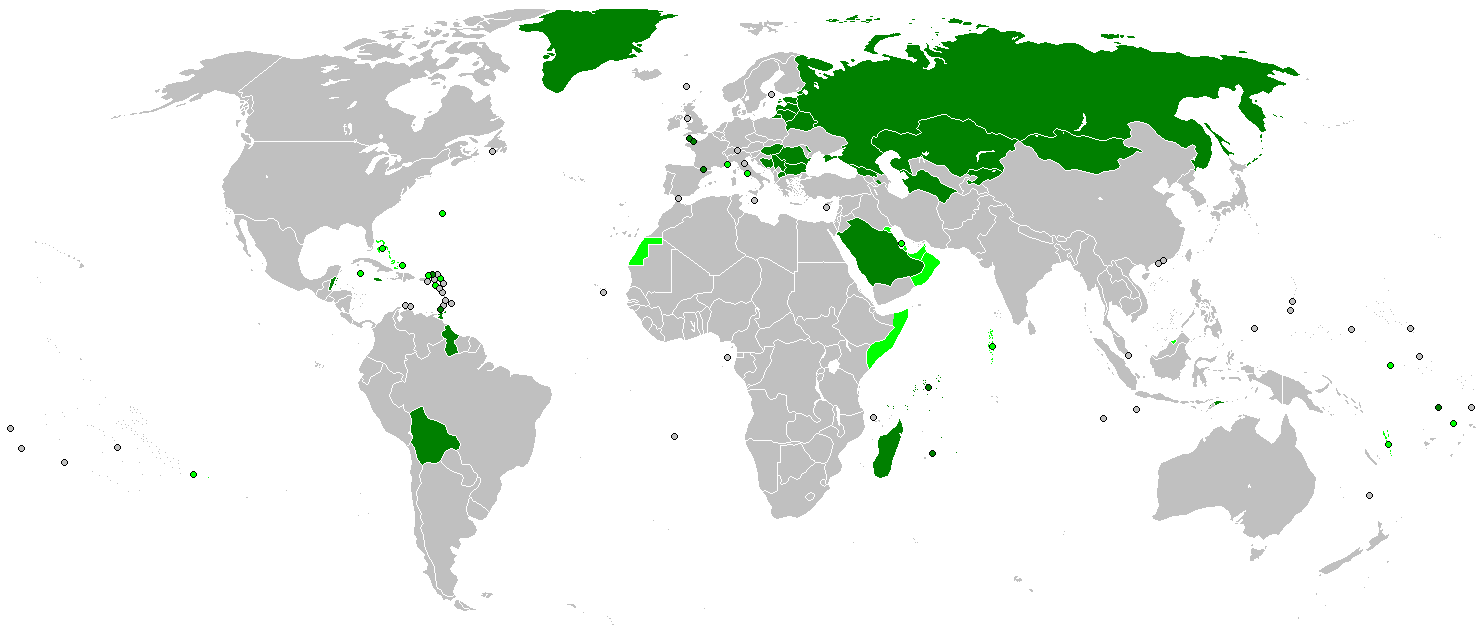
Value-added tax rate across OECD countries in 2015
Background information for discussions
VAT tax revenue as % of total tax revenue in 2014
Source: OECD (2017) "Goods and services as percentage of total taxation" Government At A Glance 2017

Background information for discussions (cont.)
2012
Pass the bill for a rise to 8% in 2014
Lost the majority in Lower House
2010
Propose a rise to 10%
Prime Minister resigned
1994 Feb
Propose a rise to 7%
Prime Minister resigned
1979
Propose 3%
Lose many seats in Lower House
1981
Propose 5%
Lose many seats in local elections
1989
Pass the bill to introduce 3% tax
Pass the bill for a rise to 5% in 1997
Lost the majority in Upper House
A consumption tax rise is politically suicidal in Japan
Background information for discussions (cont.)
1994 Nov
Discussion Time
For your term paper...
Does the Median Voter Theorem explain
why the consumption tax rate isn't higher than 8% in Japan today?
When can we say a theory explains reality?
Theory
II
Assumptions
Predictions
+
Hold in reality?
Consistent with reality?
For your term paper...
What are the assumptions and predictions
of the Median Voter Theorem? (cf. Lecture 2)
Aim: Come up with a wrong answer
For today...
Today's Road Map

Inequality and Income Redistribution
Economic Impact of Democracy
Inequality and Income Redistribution
Economic Impact of Democracy
Optimization of how much to consume
Sources of economic growth
Today's Economics Lessons
Today's Road Map
Inequality and Income Redistribution
Economic Impact of Democracy
Median Voter Theorem predicts:
Falling Median Income
(relative to GDP)
More
Redistribution
Median Voter Theorem predicts:
Falling Median Income
(relative to GDP)
More
Redistribution
What's been happening in US for the past 40 years
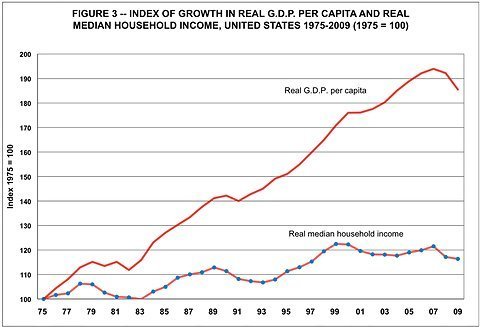
In U.S., median income doesn't grow much while GDP grows fast
In U.S., median income doesn't grow much while GDP grows fast
This happens when
economic growth mostly benefits top income earners
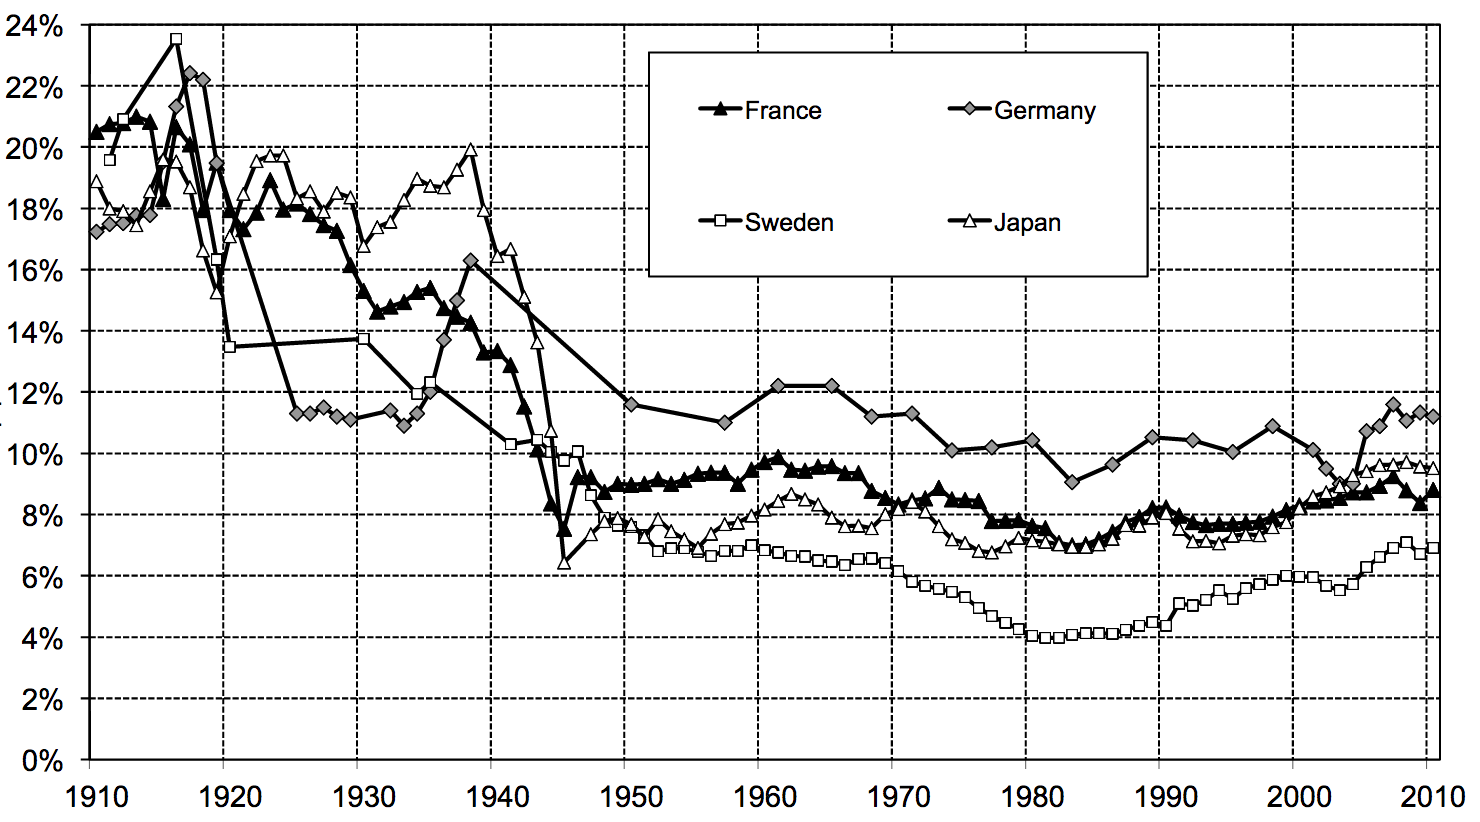
And this appears to be the world-wide trend in the past 35 years
Top 1% income earners' share of GDP
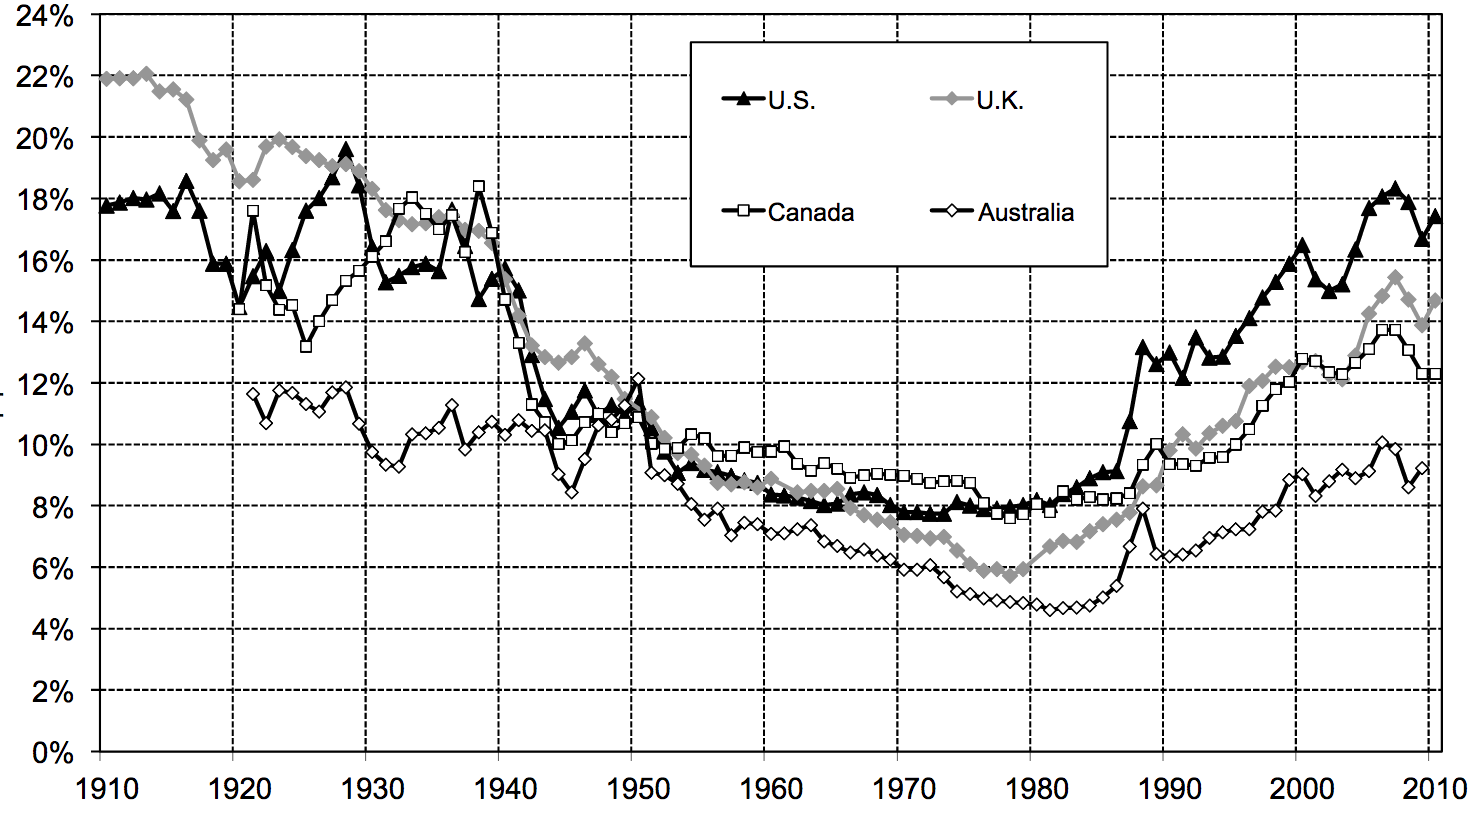
1910-2010
Figure 9.2 of Piketty (2014)
Top 1% income earners' share of GDP
1910-2010
Figure 9.3 of Piketty (2014)
Top 1% income earners' share of GDP
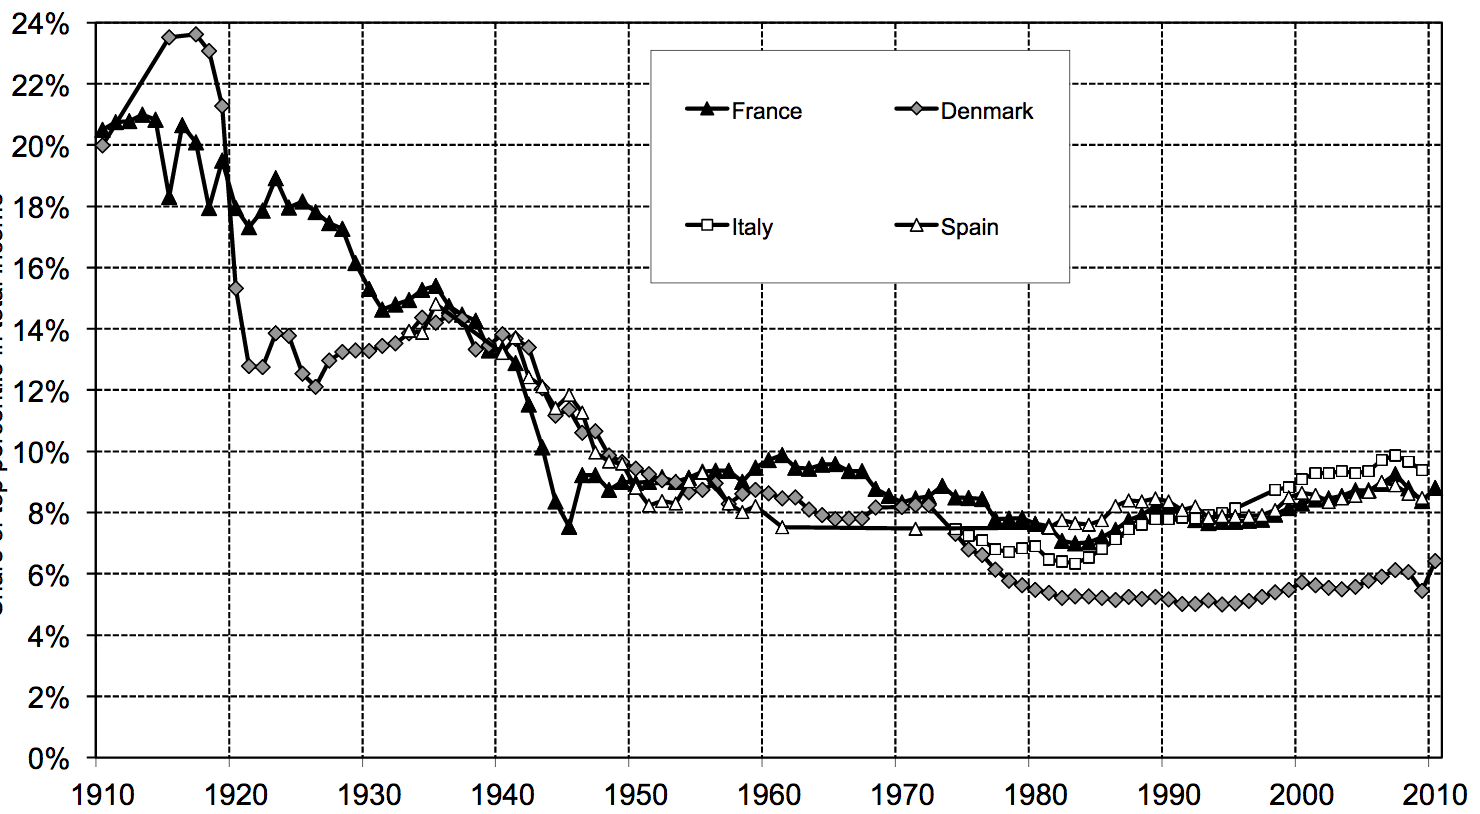
1910-2010
Figure 9.4 of Piketty (2014)
These figures of rising inequality were
published in this academic book
by a French economist
Unusually for an academic book,
it became a worldwide best-seller
(1.5 million copies sold since 2013)
Inequality
is a hot topic worldwide
Median Voter Theorem predicts:
Falling Median Income
(relative to GDP)
More
Redistribution
Publicly funded
healthcare
education
Unemployment benefit
Food stamps
Child benefit
Sick leave
Why does Median Voter Theorem predict this relationship?
Falling Median Income
(relative to GDP)
More
Redistribution
We need to understand
the optimization of how much to consume
The more you eat,
the happier you become
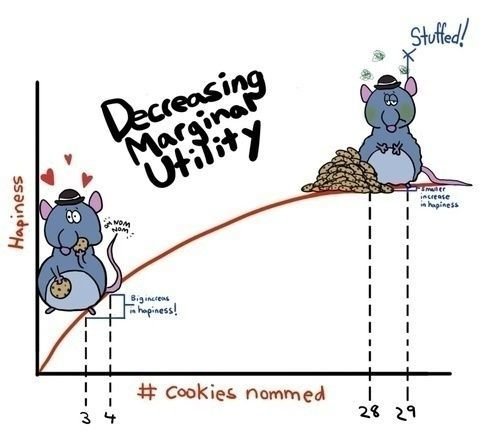
Optimization of how much to consume
Today's economics lesson #1
But extra happiness
from eating one more
decreases
as you keep eating more
Optimization of how much to consume (cont.)
Today's economics lesson #1
Extra happiness
# of cookies
Known as the Law of Diminishing Marginal Utility
Optimization of how much to consume (cont.)
Today's economics lesson #1
Extra happiness
# of cookies
Now consider the best affordable # of cookies
You need to pay the price to eat more cookies
price per piece
Optimization of how much to consume (cont.)
Today's economics lesson #1
Extra happiness
# of cookies
Now consider the best affordable # of cookies
Eating more cookies still gives
more extra happiness than price
price per piece
Optimization of how much to consume (cont.)
Today's economics lesson #1
Extra happiness
# of cookies
Now consider the best affordable # of cookies
Eating more cookies gives
less extra happiness than price
price per piece
Optimization of how much to consume (cont.)
Today's economics lesson #1
Extra happiness
# of cookies
Now consider the best affordable # of cookies
Total happiness minus paid price is maximized
price per piece
Optimization of how much to consume (cont.)
Today's economics lesson #1
Extra happiness
# of cookies
This is
the best affordable # of cookies
price per piece
Optimization of how much to consume (cont.)
Today's economics lesson #1
Same should be true
for redistribution
instead of cookies
Redistribution
Voter's optimal level of redistribution
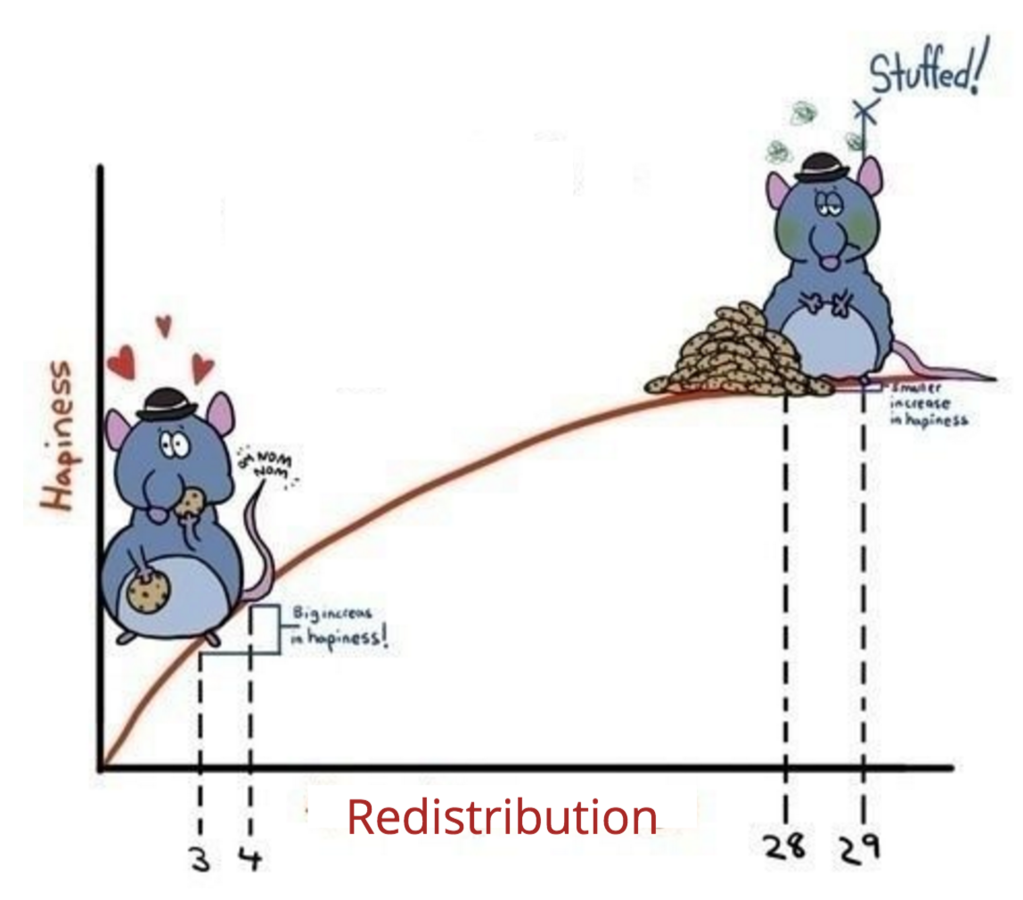
Extra happiness
Redistribution
Voter's optimal level of redistribution (cont.)
Extra happiness
Now consider the best affordable level of redistribution
Price of redistribution
Extra
tax
paid
Voter's optimal level of redistribution (cont.)
=
Redistribution
Since the tax system is VERY complicated in reality,
consider a model of the world where:
What's the price of redistribution?
Everyone pays the same % of their income as tax
(known as "flat tax")
A flat tax is not completely unrealistic

To redistribute one more unit, the flat tax rate needs to go up
The richer the individual, the more tax they will pay
Richer individual
Poorer individual

Price of redistribution #1
Price of redistribution #1 (cont.)
The richer the individual, the higher the price of redistribution
Richer individual
Poorer individual
Extra happiness = Extra tax paid
Extra tax paid
Optimal level of redistribution
Extra happiness
Voter's optimal level of redistribution
Now remember...
and the lower optimal level of redistribution
Extra tax paid
Extra happiness
Richer
Optimal level of redistribution
The richer the individual, the higher the price of redistribution
Who's the median voter in this world?
the person who earns
the median level of income
Extra tax paid by poorest
Extra happiness
Median voter's ideal level of redistribution
Extra tax paid by richest
Median income earner
The richer the country, the smaller the necessary tax rate hike
Richer country
Poorer country
Additional amount of redistribution
Price of redistribution #2
National income
20% of national income
10% of national income
Richer country
Poorer country
Additional amount of redistribution
National income
20% of national income
10% of national income
The higher the GDP, the lower the price of redistribution
Price of redistribution #2 (cont.)
(i.e. Rising inequality)
If GDP goes up, but only rich people earn more
Extra happiness
Median voter's ideal level of redistribution increases
Median income earner's
pro-rich GDP growth
Summary
Median Voter Theorem predicts:
Pro-rich
Economic
Growth
(thus rising inequality)
More
Income
Redistribution
Median Voter Theorem predicts:
Pro-rich
Economic
Growth
(thus rising inequality)
More
Income
Redistribution
But reality isn't like this at all
In U.S., median income doesn't grow much while GDP grows fast
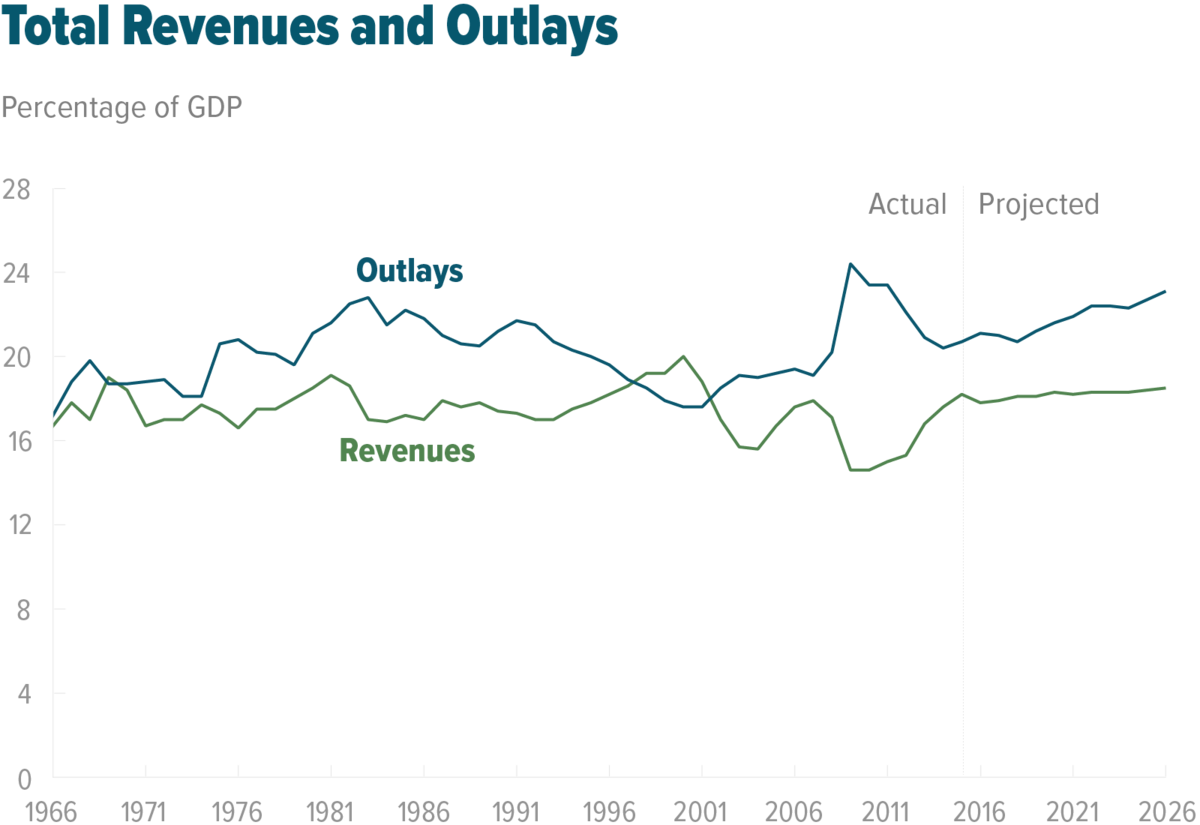
But government size as % of GDP hasn't changed much in US
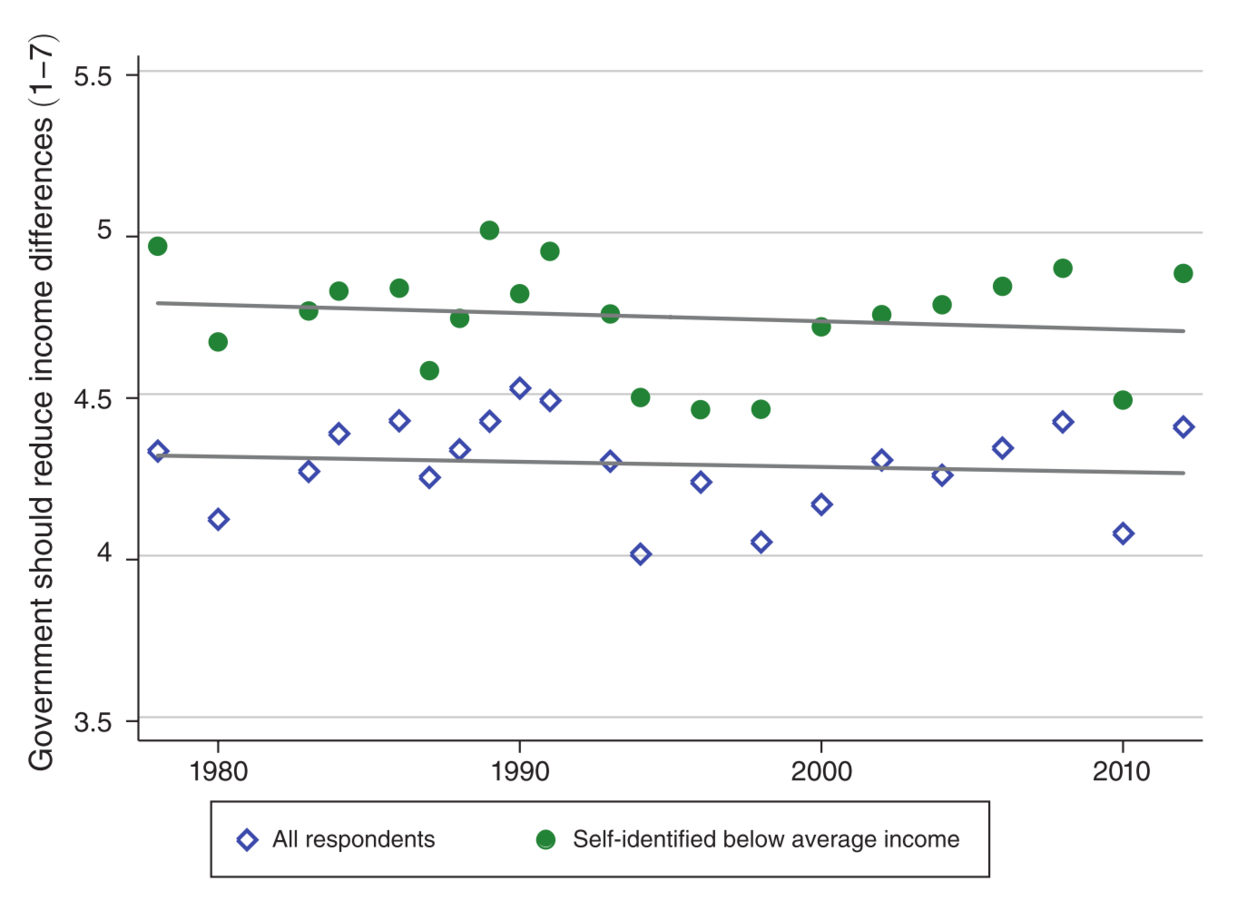
And demand for redistribution hasn't been on the rise, either
Figure 1 of Kuziemko et al. (2015)
Why?
The Median Voter Theorem may be wrong
But it could also be due to...
Possible reasons
US citizens
just don't know about
the rising inequality
US citizens
don't trust the government


Economists recently examined these possibilities
by running survey experiments on...
Amazon mTurk
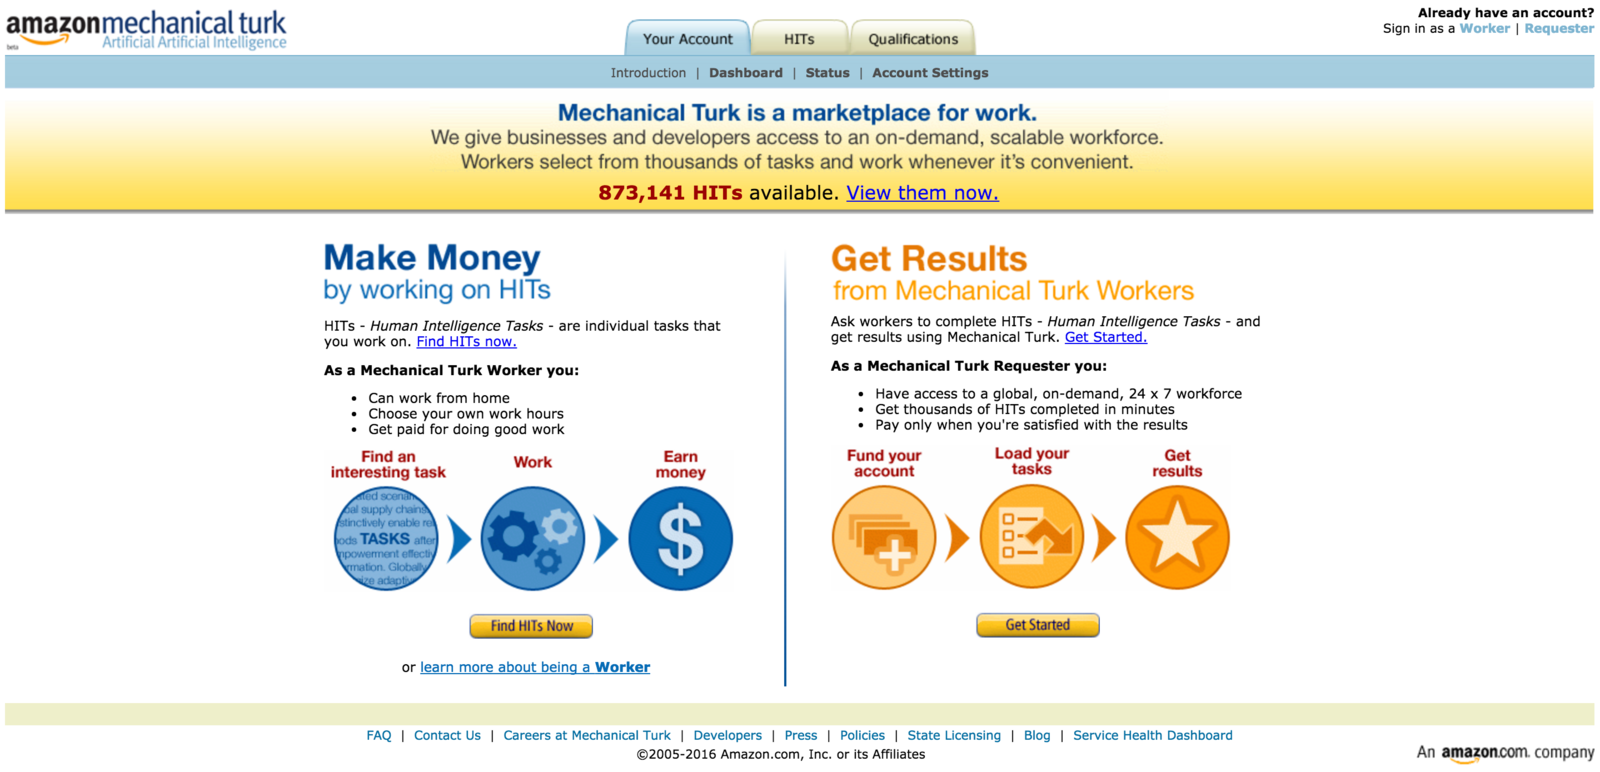
Image source: the screen shot of www.mturk.com (17 October 2016)
Researchers recruit 3741 subjects from Amazon mTurk
1. All subjects answer questions on their background
2. Randomly chosen half learn about income inequality in US
Experiment proceeds as follows (try yourself)
3. All subjects answer questions on their opinion
about inequality and redistribution policies
Any difference in opinions at Step 3
is thus the impact of learning about inequality at Step 2
To see if information matters...
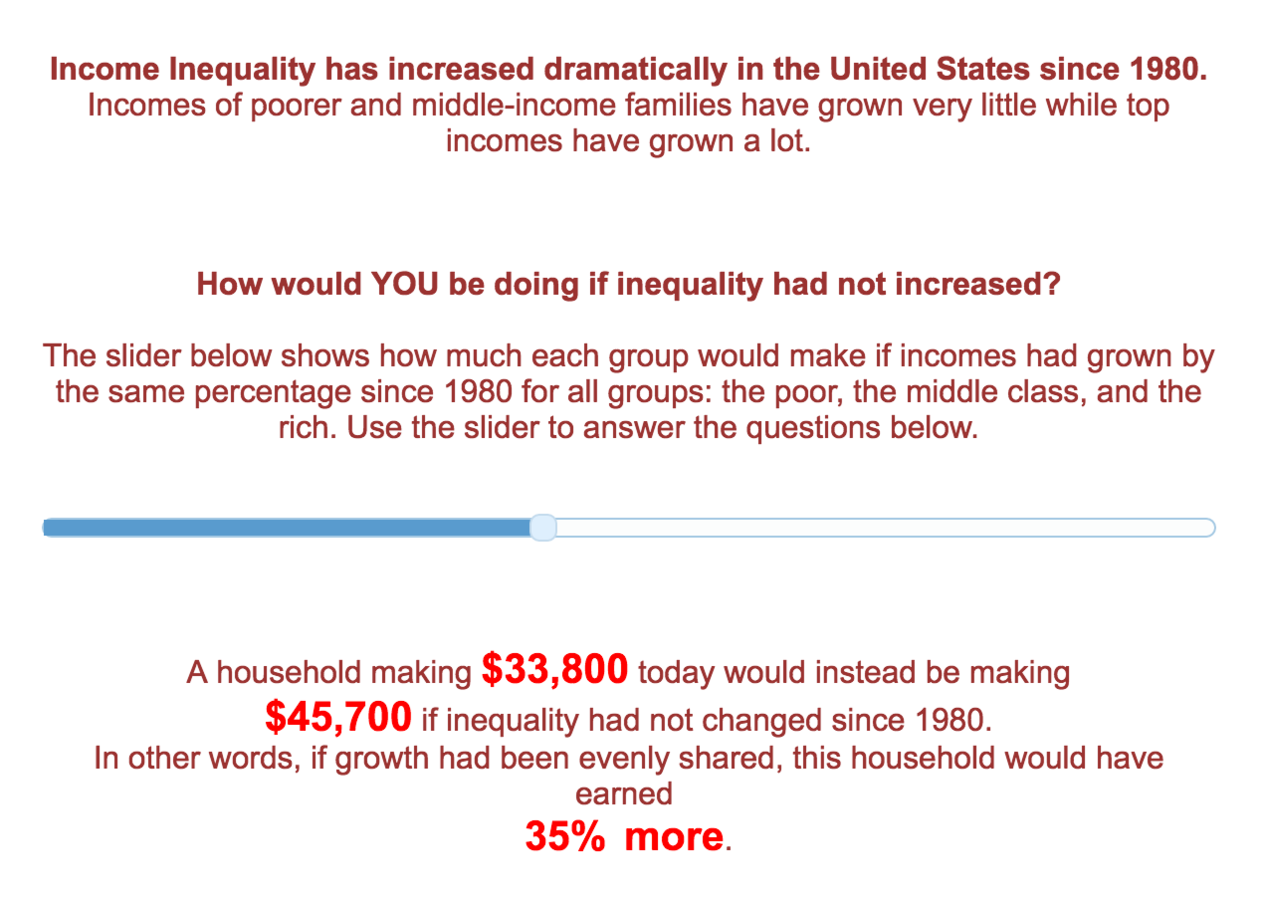
Screenshot from the experiment
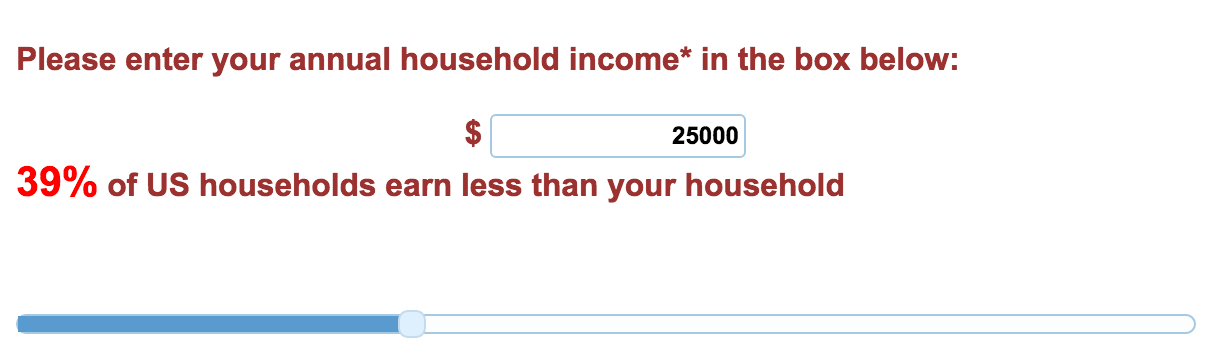
Image source: hbs.qualtrics.com/jfe/form/SV_77fSvTy12ZSBihn
Image source: hbs.qualtrics.com/jfe/form/SV_77fSvTy12ZSBihn
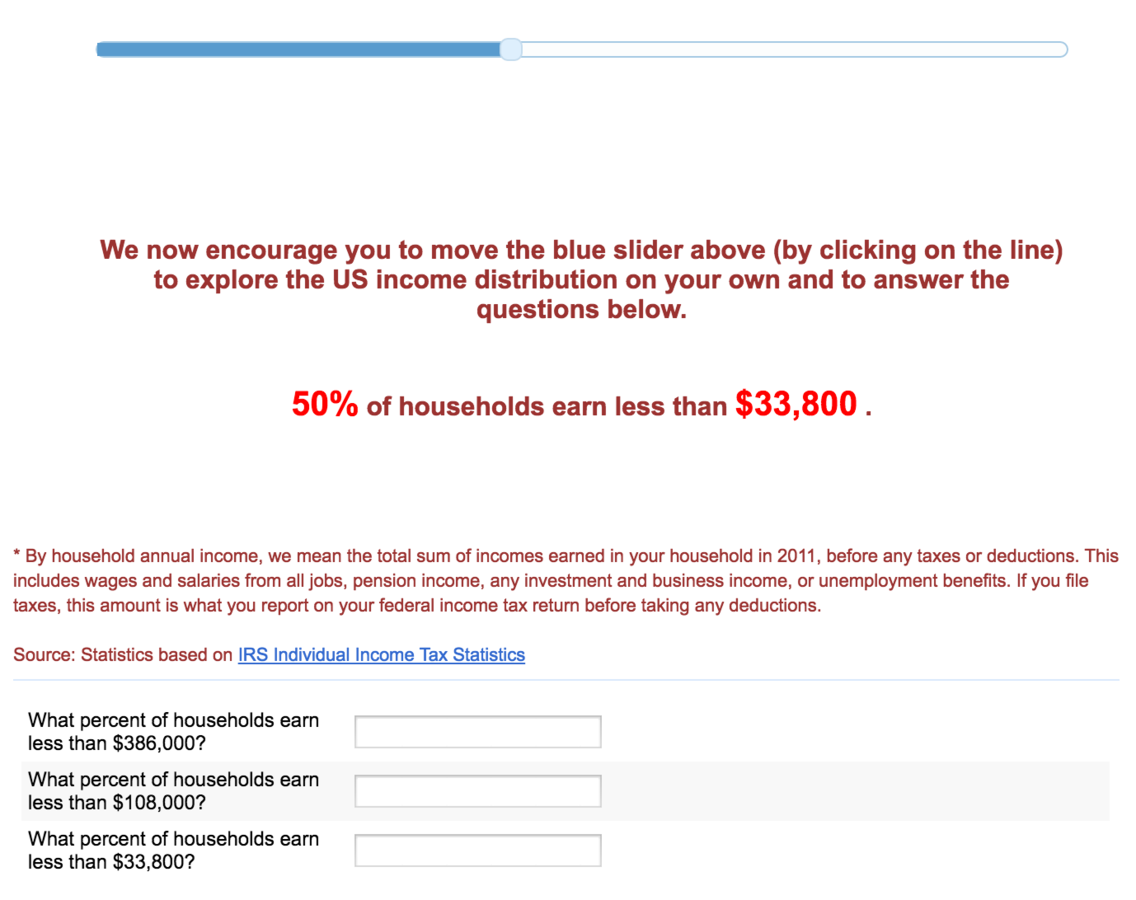
Image source: hbs.qualtrics.com/jfe/form/SV_77fSvTy12ZSBihn
Results
% of subjects chose "Increased"
86%
of treated
74%
of control
Source: Table 4 (column 3) of Kuziemko et al. (2015)
Do you think income inequality in the United States has increased or decreased since 1980?
Source: Appendix Table 4 (column 9) of Kuziemko et al. (2015)
Results
% of subjects chose "Support"
70%
of treated
69%
of control
Do you support or oppose the Food Stamps program?
Possible reasons
US citizens
just don't know about
the rising inequality
US citizens
don't trust the government
Researchers recruit 1000 subjects from Amazon mTurk
1. All subjects answer questions on their background
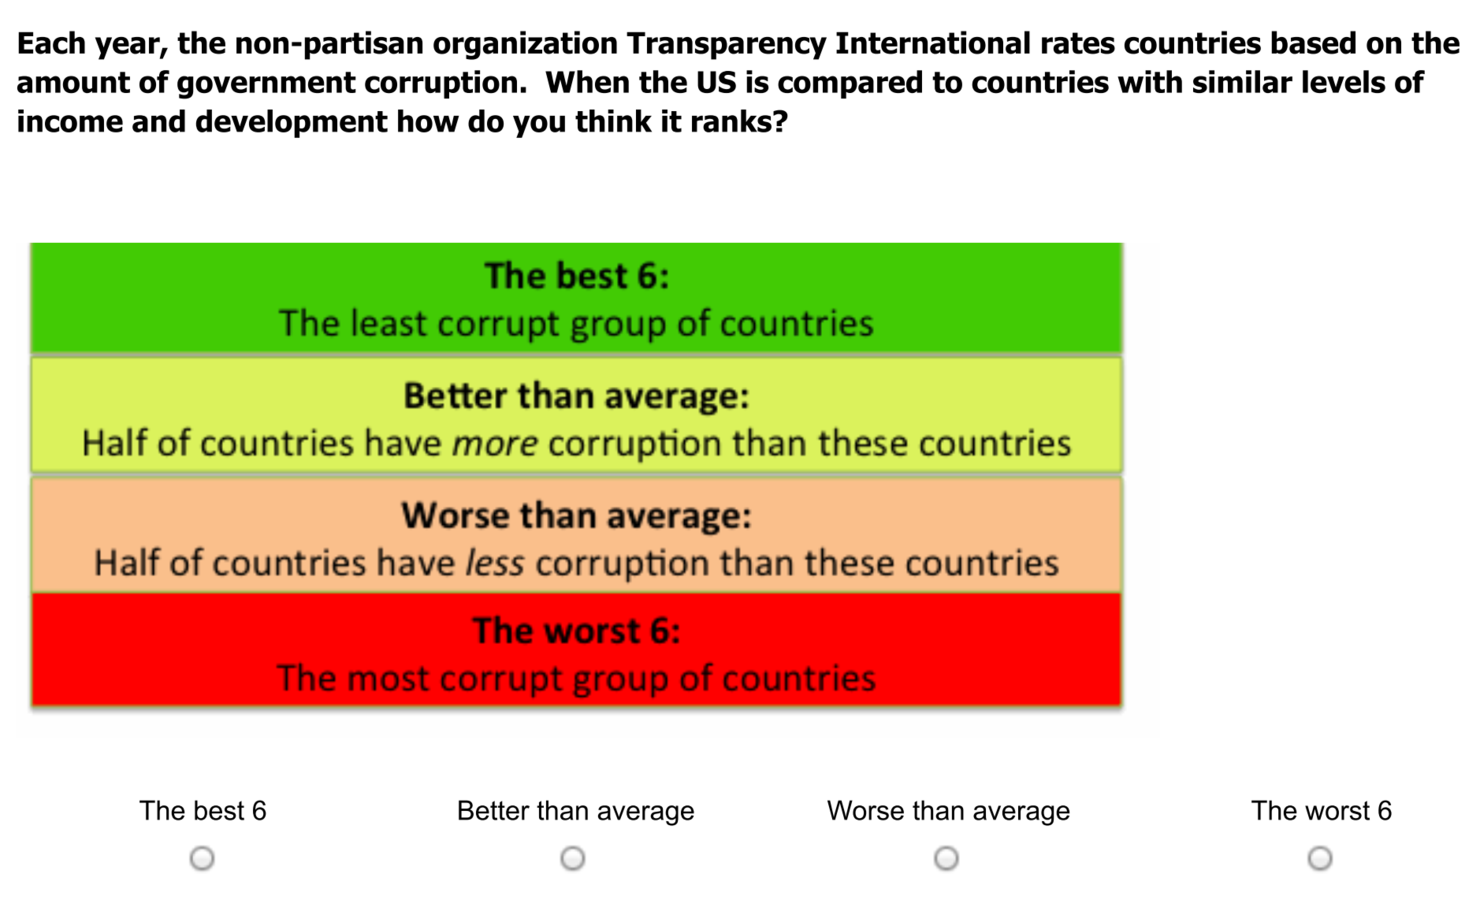
2. Randomly chosen half learn about
how corrupt the US government is
2nd Experiment proceeds as follows (try yourself)
3. All subjects answer questions on their opinion
about inequality and redistribution policies
Any difference in opinions at Step 3
is thus the impact of distrust in government raised at Step 2
To see if trust in government matters...
Appendix Figure 8 of Kuziemko et al. (2015)
Screenshot from the experiment
Appendix Figure 8 of Kuziemko et al. (2015)
Source: Table 8 (column 1) of Kuziemko et al. (2015)
Results
% of subjects chose "Always" or "Most of the time"
7%
of treated
13%
of control
How much of the time do you think you can trust government in Washington to do what is right?
Always Most of the time Only some of the time Never
Source: Table 8 (column 1) of Kuziemko et al. (2015)
Results
2.3
of treated
2.5
of control
Average score that subjects give:
Should the federal government increase or decrease its spending on food stamps?
4 (Significantly increase) 3 (Slightly increase)
2 (Keep at current level)
1 (Slightly decrease) 0 (Significantly decrease)
Small difference
but not by chance
Possible reasons
US citizens
just don't know about
the rising inequality
US citizens
don't trust the government
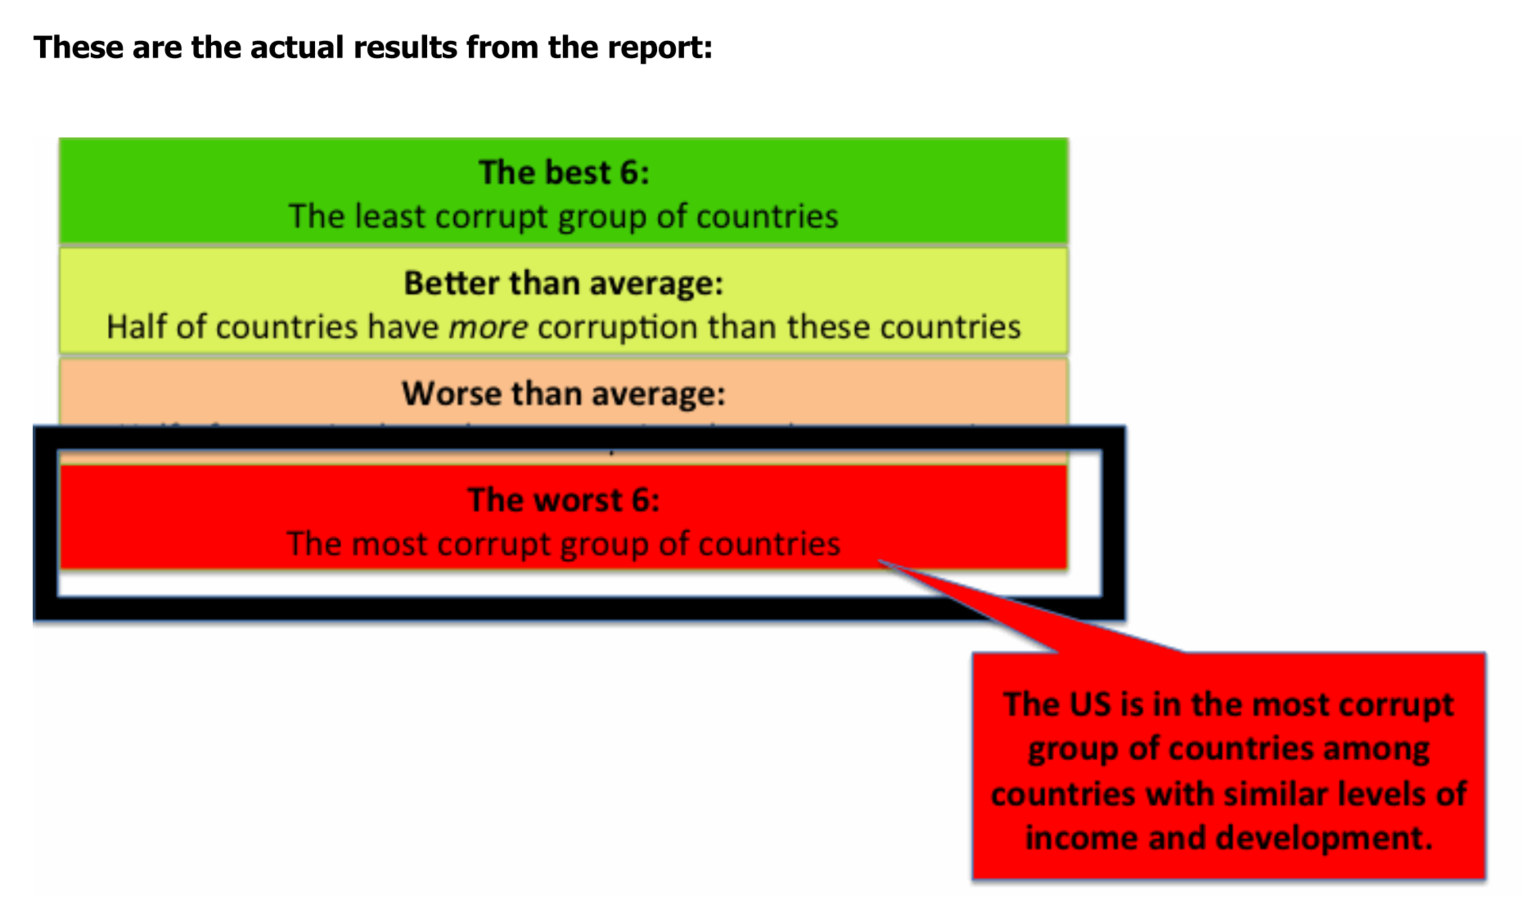
Distrust in government appears to be one reason
for the lack of support for redistribution in US
What we've seen is an example of
Empiricism in economics
A model of the world:
rising inequality
leads to more redistribution
Rejected by data
A revised model of the world:
ignorance about inequality
Run an experiment
to reject the model
3rd model of the world:
distrust in government
Run an experiment to find
some support for the model
Today's Road Map
Inequality and Income Redistribution
Economic Impact of Democracy
Where does economic growth come from?
Democracy
Economic Growth
Who chooses economic policy?
?
Democracy
Economic Growth
?
Who chooses economic policy?
Where does economic growth come from?
Who chooses economic policy?
Workers
Employees
The poor
Capitalists
Firm managers
The rich
Consider a model of the world where:
Two groups of people engage in economic activities
Who chooses economic policy?
Workers
Employees
The poor
Capitalists
Firm managers
The rich
Consider a model of the world where:
control policy-making
in aristocracy
Who chooses economic policy?
Workers
Employees
The poor
Capitalists
Firm managers
The rich
Consider a model of the world where:
In democracy, everyone has one vote
Who chooses economic policy?
Workers
Employees
The poor
Capitalists
Firm owners
The rich
Consider a model of the world where:
In democracy, everyone has one vote
Workers are the majority
A worker is the median voter
Median Voter Theorem predicts:
Workers choose economic policy in democracy
Democracy
Economic Growth
Who chooses economic policy?
?
Where does economic growth come from?
Sources of economic growth
Investment
Innovation
Developing countries
Industries far from frontier
Developed countries
Industries at world frontier
Today's economics lesson #2
Sources of economic growth
Image source: images.slideplayer.com/16/5128640/slides/slide_35.jpg
e.g. East Asian economic growth until the 1990s
Innovationdriven
Investmentdriven
Innovation or Investment
Democracy
Economic Growth
Workers, not capitalists, choose economic policy
What policies discourage
innovation or investment?
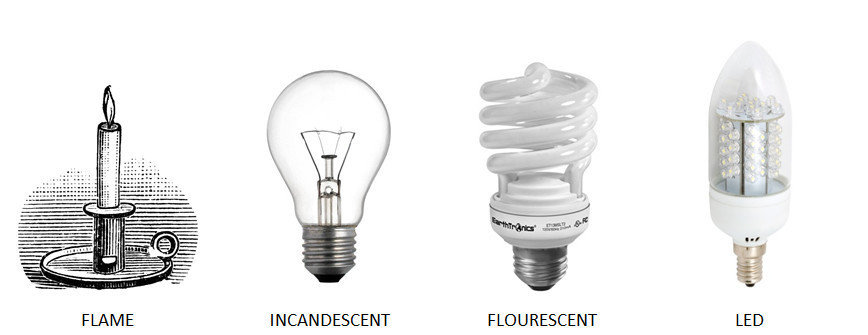
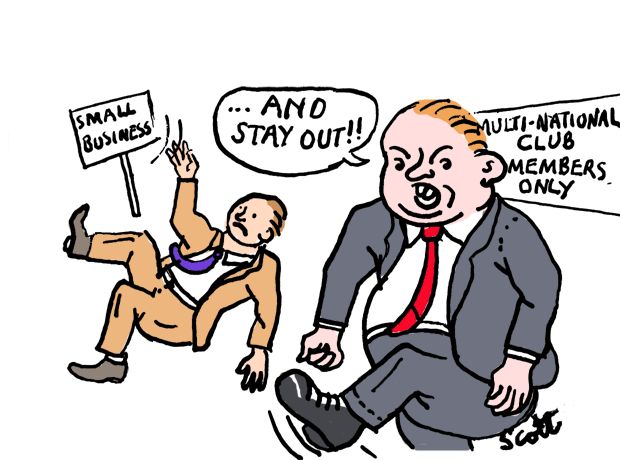
Policy that discourages innovation:
Entry Barrier
Competitors drive prices down
>> Profit shrinks
Incumbent firms want entry barrier
Image source: www.romeconomics.com/barriers-to-entry-explained/
Policy that discourages innovation:
Entry Barrier
Workers don't want entry barrier
Image source: www.romeconomics.com/barriers-to-entry-explained/
More producers
= More labor demand
= Higher wage
Policy that discourages innovation:
Entry Barrier
Entry barrier stifles innovation
Image source: www.romeconomics.com/barriers-to-entry-explained/
Incumbent firms may not be the most innovative producer
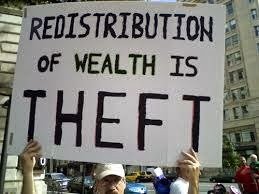
Policy that discourages investment:
Redistribution
Workers want higher wages
Redistribution achieves this by taxing profits and paying benefits to workers
But then capitalists are less willing to invest to earn profits
Ideal policies
Redistribution
No entry barrier
Entry barrier
No redistribution
In Aristocracy
Redistribution
No entry barrier
Entry barrier
No redistribution
Less innovation
More investment
Higher growth in developing countries
In Aristocracy
Redistribution
No entry barrier
Entry barrier
No redistribution
Less innovation
More investment
Higher growth in catching-up industries
In Democracy
Redistribution
No entry barrier
Entry barrier
No redistribution
Less investment
More innovation
Higher growth in developed countries
In Democracy
Redistribution
No entry barrier
Entry barrier
No redistribution
Less investment
More innovation
Higher growth in frontier industries
Evidence?
Identifying the impact of democracy is really hard
Democracy may be caused by economic growth
Culture may cause both democracy and economic growth
We cannot randomly assign democracy across countries
Evidence?
A solution: compare industries over time within each country
year
Democratization
Industry
output
Industry far from frontier
Industry close to frontier
Evidence?
year
Democratization
Industry
output
Industry far from frontier
Industry close to frontier
A specific industry's growth is unlikely to cause democracy
Evidence?
year
Democratization
Industry
output
Industry far from frontier
Industry close to frontier
Cultural change (which may cause democratization)
is unlikely to affect industries differentially by distance to frontier
Evidence?
year
Democratization
Industry
output
Industry far from frontier
Industry close to frontier
So if data shows the graph as below,
we can interpret it as the impact of democratization (do you agree?)
Evidence
Collect industry-level annual output data (UNIDO-INDSTAT)
from 180 countries for 1963-2003
>>> Difference from max = Distance to technological frontier
Measure output per worker for each industry in each country
>>> Obtain the maximum for each industry across countries
How to measure the distance to frontier?
Evidence
Industries at the frontier
= Democratization increases growth rate by 12%
Industries half as productive as at the frontier
= Democratization decreases growth rate by 57%
Source: p. 15 of Aghion et al. (2007)
Note: "Democratization" is defined as a 10-point increase in POLITY IV Index
Summary #1
Median Voter Theorem predicts
Falling median income relative to GDP
More income redistribution
Evidence suggests
Distrust in government breaks down this prediction
Summary #2
Median Voter Theorem predicts
Democracy adopts workers' preferred policies
= Income redistribution + No entry barrier
Industry-level evidence confirms this prediction
Democracy causes innovation-driven economic growth, but not investment-driven growth
Next lecture
Citizen-candidate model
To what extent does the Median Voter Theorem still holds
if candidates
have their own ideal policy, and
cannot commit to electoral promise?
Model of Politics #2
This lecture is based on the following academic articles:
Economic Origin of Democratization
Acemoglu and Robinson (2000) (See also their book)
Economic Impacts of Democracy
Income Redistribution