Politics through the Lens of Economics
Lecture 7: Electoral Rules and Voter Intimidation
Masayuki Kudamatsu
15 November, 2017
What evidence do we need to say
the probabilistic voting model explains
Why Japan hasn't legalized same-sex marriage?
Background information
Countries that have legalized same-sex marriage

Background information
Some municipalities in Japan issue
partnership certificates for same-sex couples
Image source: en.wikipedia.org/wiki/Same-sex_marriage_in_Japan

Sapporo (2017)
Shibuya (2015)
Setagaya (2015)
Iga (2016)
Takarazuka (2016)
Naha (2016)
What evidence do we need to say
the probabilistic voting model explains
Why Japan hasn't legalized same-sex marriage?
What evidence do we need to say
the probabilistic voting model explains
Why Japan hasn't legalized same-sex marriage?
Come up with a wrong answer!


Today's Road Map
Impact of electoral rules
Voter intimidation
We apply the Probabilistic Voting Model to understand...
Today's Road Map
Impact of electoral rules
Voter intimidation
We apply the Probabilistic Voting Model to understand...
Motivation: Role of Political Institutions
So far in this course
Election outcomes were determined by a simple majority voting
In reality
How voting outcomes translate into who assumes office
depends on political institutions such as
Electoral rules (this lecture)
Presidential vs parliamentary systems (Lecture 13)
Term limits (Lecture 11)
Impact of electoral rules
Public goods
(welfare spending)
Geographically targeted spending
Public pension
Unemployment benefits
Local infrastructure
Fiscal transfer to local government
Composition of government expenditure
Outcome of interest:
Start with the standard probabilistic voting model
Two parties (A & B) offer policy
Voters choose which party to vote for based on policy and ideology
Step 1
Step 2
Step 3
The party who wins a majority
implement the offered policy
Modify the standard probabilistic voting model so that...
Two parties (A & B) offer how much to
Step 1
provide public goods
spend in each district
We assume there is a fixed amount of government revenue
i
ii
Voters choose which party to vote for based on policy and ideology
Step 2
Step 3
The party who wins a majority of seats
implement the offered policy
Modify the standard probabilistic voting model so that...
Step 2.5
Electoral rule determines how votes translate into seats in legislature
Road map
Each party's optimal mix of two policies
Impact of electoral rules on the optimal mix
Each party's optimal mix of two policies
Impact of electoral rules on the optimal mix
Road map
# of
citizens
Bias to
Party B
0
Distribution of citizens' ideological bias to party B
# of
citizens
Bias to
Party B
0
Without any policy, these citizens vote for:
A
B
# of
citizens
Bias to
Party B
0
If party A offers public good, citizens vote for:
A
Benefit
from public good
A
B
# of
citizens
Bias to
Party B
0
Doubling public good increases votes less than twice
A
Benefit from
2nd unit of public good
A
B
Extra votes
to win
Public good
provision
# of extra votes declines
as public good increases
Extra votes
to win
Targeted
spending
Same is true
for targeted spending
What's the optimal mix of these two policies to maximize # of votes?
Public goods
(welfare spending)
Geographically targeted spending
Public pension
Unemployment benefits
Local infrastructure
Fiscal transfer to local government
Extra votes
to win
Targeted
spending
Draw the graph
for targeted spending
from the right
Extra votes
to win
Public good
provision
Targeted
spending
Extra votes
to win
Targeted
spending
Draw the graph
for public good
from the left
Extra votes
to win
Public good
provision
Targeted
spending
Public good
Extra votes
to win
Targeted
spending
Amount of government revenue
Extra votes
to win
Public good
provision
Targeted
spending
Extra votes
to win
Consider
this mix of the two policies
Extra votes
to win
Public good
provision
Targeted
spending
Shaded area
= total # of votes
Extra votes
to win
Public good
provision
Targeted
spending
Can win more votes by less transfer
Extra votes
to win
Public good
provision
Targeted
spending
Can win more votes by more transfer
Extra votes
to win
Public good
provision
Targeted
spending
Maximize
total # of votes
Each party's optimal mix of two policies
Impact of electoral rules on the optimal mix
Road map
Modelling electoral rules
District magnitude
Electoral formula
# of legislators elected per district
How vote shares translate into seat shares in legislature
2 aspects of any electoral rules
Modelling electoral rules
Majoritarian election
District magnitude
Electoral formula
# of legislators elected per district
How vote shares translate into seat shares in legislature
1 per district
Largest vote share
= 100% seat share
Modelling electoral rules
Proportional Representation
District magnitude
Electoral formula
# of legislators elected per district
How vote shares translate into seat shares in legislature
All elected from one district
Vote share
= Seat share
# of
citizens
Bias to
Party B
0
1
Consider three districts
District 1: lots of Party A supporters
# of
citizens
Bias to
Party B
0
3
District 3: lots of Party B supporters
Consider three districts
# of
citizens
Bias to
Party B
0
2
District 2: "Swing" voters
Consider three districts
# of
citizens
Bias to
Party B
0
Alternatively, consider three sets of districts
And none has a majority of citizens
# of
citizens
Bias to
Party B
0
Majoritarian elections
Each district elects one legislator

by plurality rule
# of
citizens
Bias to
Party B
0
Proportional Representation
All legislators elected from the whole country

in proportion to vote share
Party's objective
Obtain the majority of seats to become the ruling party
In Proportional Representation
Obtain the majority of votes in the whole country
In Majoritarian Elections:
Obtain the majority of votes in two out of three districts
# of
citizens
Bias to
Party B
0
In majoritarian elections
Public good provision
doesn't affect election outcome
in District 1
Majority vote for A
# of
citizens
Bias to
Party B
0
In majoritarian elections
Public good provision
doesn't affect election outcome
in District 3
Majority
vote for B
# of
citizens
Bias to
Party B
0
In majoritarian elections
More votes from District 2
due to public good provision
count for winning the election
# of
citizens
Bias to
Party B
0
More votes from District 1
due to public good provision
DOES count for winnning
In proportional representation
# of
citizens
Bias to
Party B
0
More votes from District 3
due to public good provision
DOES count for winnning
In proportional representation
# of
citizens
Bias to
Party B
0
More votes from District 2
due to public good provision
DOES count for winnning
In proportional representation
Extra votes
to win
Public good
provision
PR
Majoritarian
Public good provision
is more effective under PR
to win a majority of seats
# of
citizens
Bias to
Party B
0
In majoritarian elections
Targeted spending to District 2
yields most extra votes
# of
citizens
Bias to
Party B
0
In proportional representation
Targeted spending to District 2
yields most extra votes
(Same as in majoritarian)
Extra votes
to win
Public good
provision
Transfer
to District 2
PR
Majoritarian
Extra votes from transfer is the same for both electoral rules
Extra votes
to win
Public good
provision
Transfer
to District 2
PR
Majoritarian
Optimal level of
public good provision
is larger under PR
Evidence
Hard to prove causality running from electoral rules to policies
Electoral rules rarely change
Thus impossible to separate the impact of electoral rules
from that of country characteristics
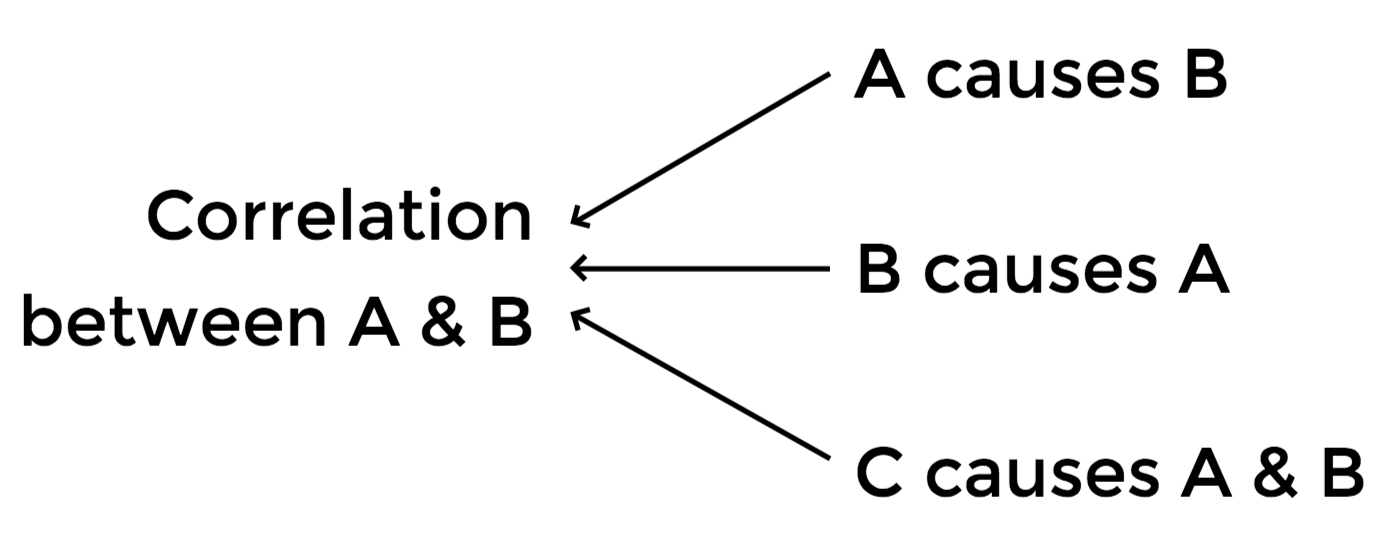
Evidence
We can only check
if correlation is consistent with the theoretical prediction
Electoral rules around the world in 1998
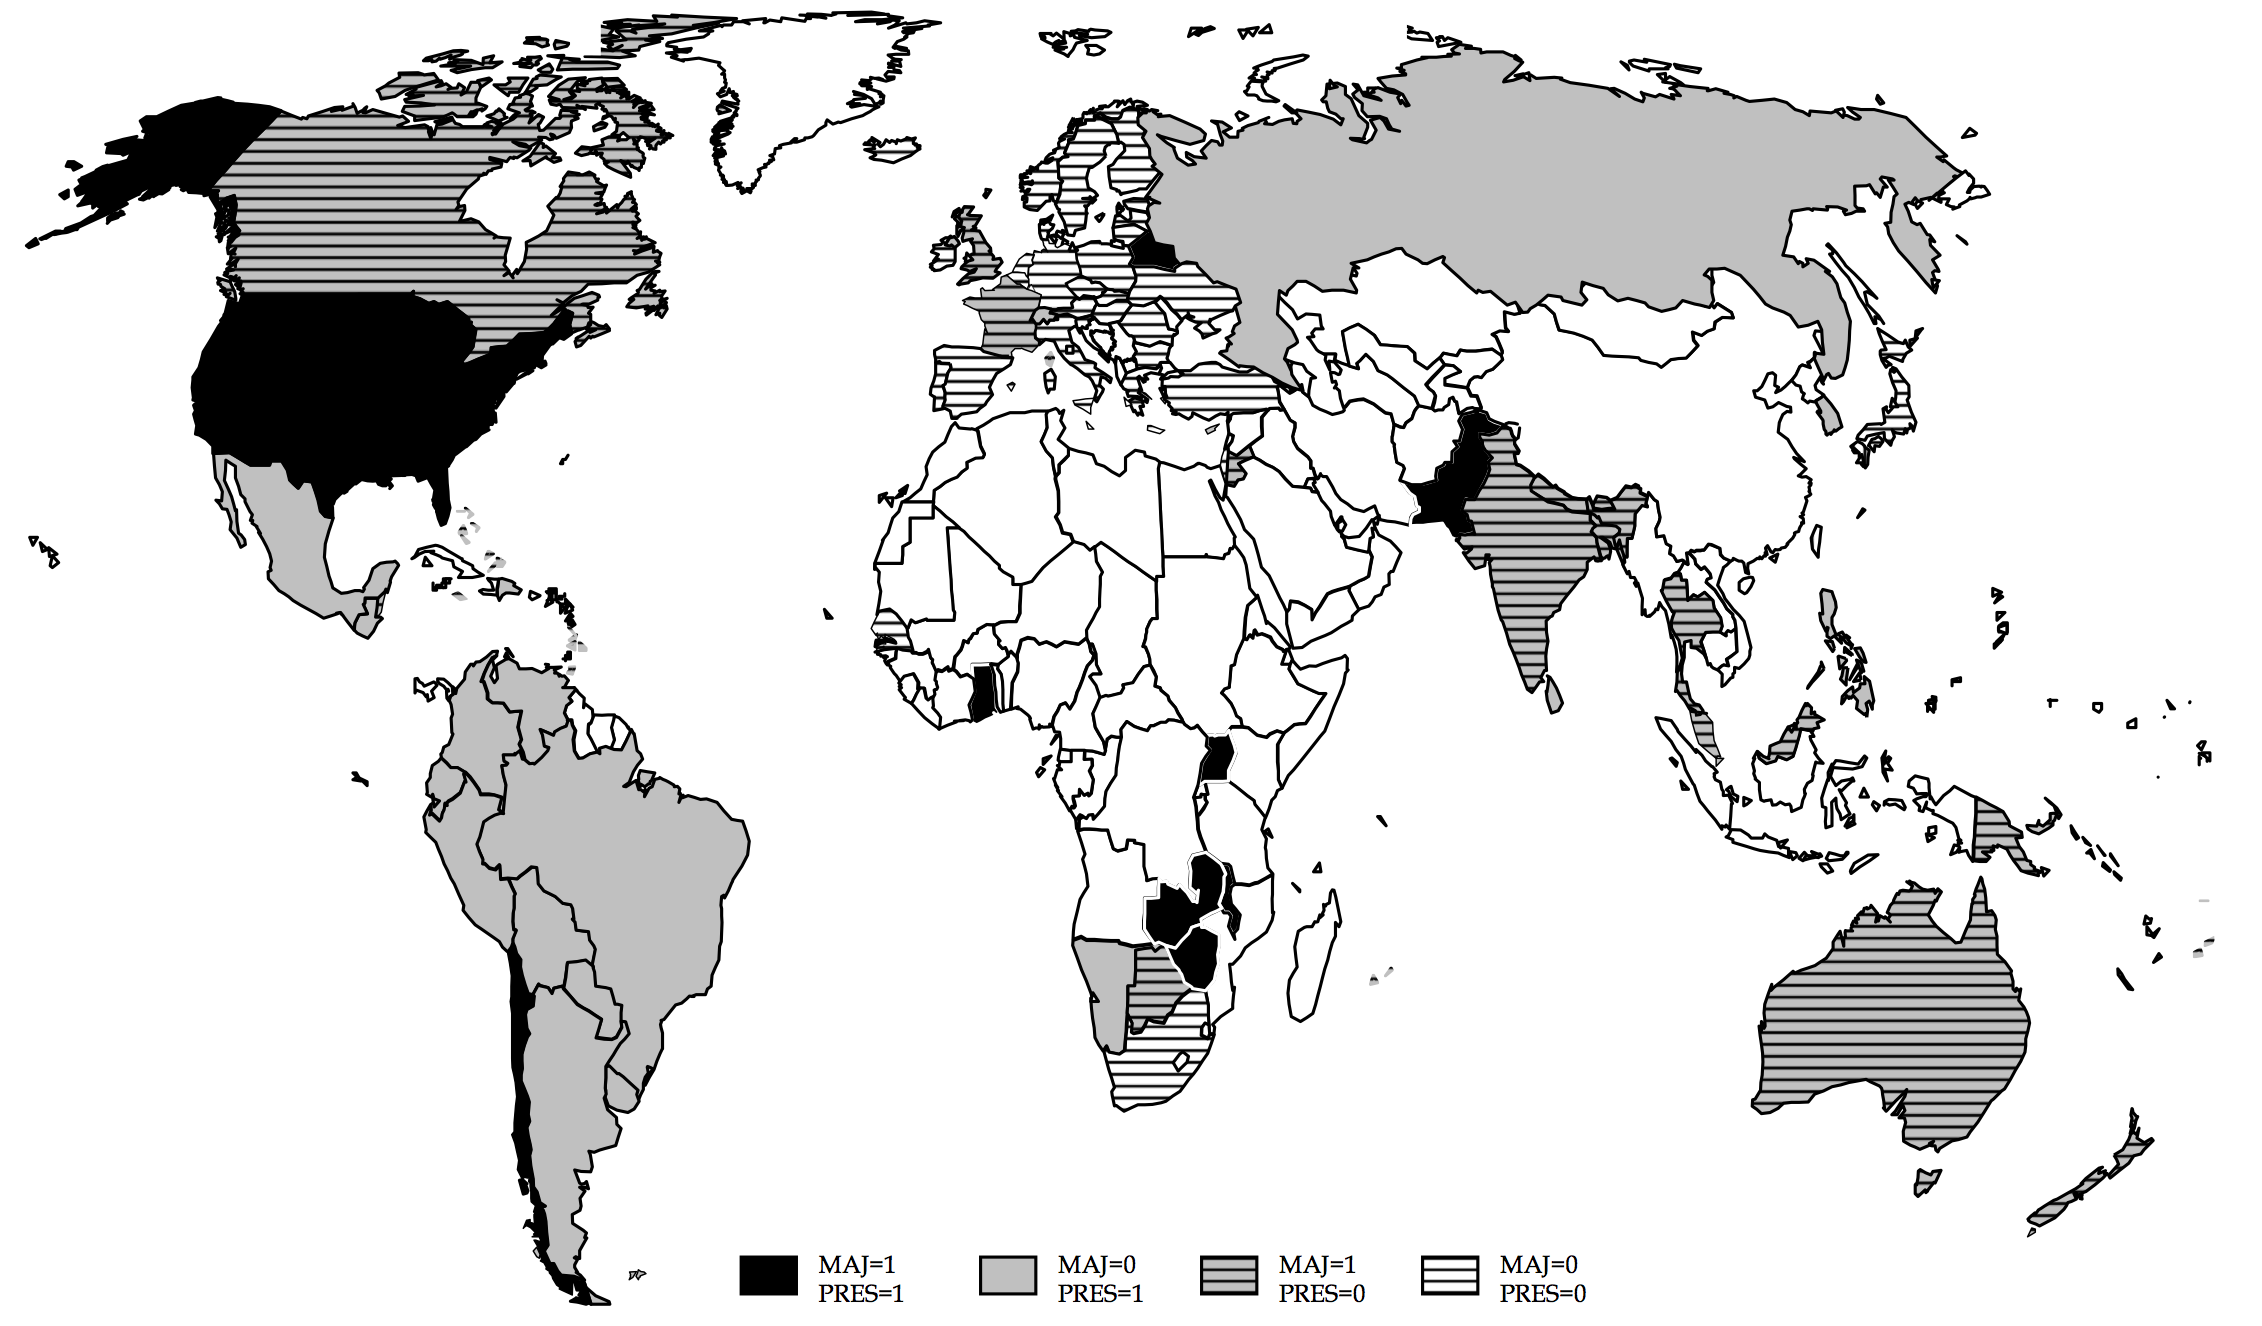
Majoritarian
Proportional Representation
Not democratic
Average social welfare spending as % of GDP
Majoritarian Elections
Proportional Representation
4.7%
10.1%
This difference is not driven by
Forms of government (cf. Lecture 13)
Income per capita
Trade openness
Demographic composition
Years since democratization
Federal system
etc.
Source: Tables 1 and 4 of Persson and Tabellini (2004)
(data source: IMF's Government Financial Statistics)
Other impacts of majoritarian elections
(as opposed to PR)
Smaller size of government
Ambiguous impact on corruption
Smaller district magnitude increases corruption
Voting on individuals, not parties, reduces corruption
Today's Road Map
Impact of electoral rules
Voter intimidation
We apply the Probabilistic Voting Model to understand:
Motivation: Zimbabwe

1889: Colonized by UK
1965-1980: White minority rule
1980: Democratized, thanks to:
Robert Mugabe
and his ZANU-PF party

Motivation: Zimbabwe
Mugabe and ZANU-PF have allegedly harassed swing voters
2000: "... in Bikita West, a rural constituency that MDC had narrowly won...

Image source: en.wikipedia.org/wiki/Bikita_District
Martin Meredith (2002) Mugabe: Power and Plunder in Zimbabwe (p.215)
ZANU–PF militias set up camps around the constituency, beating up people, forcing them to attend rallies, and confiscated identity cards they needed in order to vote."
Motivation: Zimbabwe
Image source: www.bsap.org/hisgeography.html
Mugabe and ZANU-PF have allegedly harassed swing voters

1980: "Victoria Province, part of the Midlands and part of Manicaland, where both liberation parties had ground, were said to be the areas of most serious intimidation."
Liisa Laakso (1999) Voting Without Choosing: State Making and Elections in Zimbabwe (p.45)
Motivation: Zimbabwe
Why did Mugabe
target swing voters,
not loyal opposition voters?
Modify the Probabilistic Voting Model as follows
Party A is the ruling party who:
2. Maximize # of votes and minimize the government spending
So they can consume government revenue for their pleasure
1. Can disenfranchise a group of voters of their choice
i.e. Voter intimidation
# of
citizens
Bias to
Party B
0
Consider three districts
S
1. Swing districts
# of
citizens
Bias to
Party B
0
Consider three districts
A
2. Party A district
# of
citizens
Bias to
Party B
0
Consider three districts
B
3. Party B district
# of
citizens
Bias to
Party B
0
Under free and fair elections, with same amount of transfer:
# of voters swing
if targeting swing district
# of
citizens
Bias to
Party B
0
Under free and fair elections, with the same amount of transfer:
# of voters swing
if targeting party B's district
# of
citizens
Bias to
Party B
0
Under free and fair elections, with the same amount of transfer:
# of voters swing
if targeting party A's district
# of
citizens
Bias to
Party B
0
Under free and fair elections,
Both parties target
the swing district
Party A's optimization
Extra loss by spending one extra unit
Targeted
spending
Extra loss
Party A's optimization
Extra benefit from spending one extra unit
Targeted
spending
= the increase in winning probability weighted by rent
Party A's optimization
Extra benefit from spending one extra unit
Targeted
spending
= the increase in winning probability weighted by rent
Rent decreases with spending
Party A's optimization
Targeted
spending
Extra loss
Extra benefit
Net benefit is maximized where these two lines intersect
# of
citizens
Bias to
Party B
0
Both parties target
the other two districts
What if Party A disenfranchise voters in the swing district?
# of
citizens
Bias to
Party B
0
But transfer
swings less voters
What if Party A disenfranchise voters in the swing district?
Targeted
spending
Extra benefit
What if Party A disenfranchise voters in the swing district?
Extra benefit from additional transfer: shrinks
Swing district targeted
Loyal districts
targeted
# of
citizens
Bias to
Party B
0
On the other hand, total # of voters drops
What if Party A disenfranchise voters in the swing district?
Swinging one voter increases
vote share more
Targeted
spending
Extra benefit
What if Party A disenfranchise voters in the swing district?
Extra benefit from additional transfer: expands
All citizens vote
Swing district
disenfranchised
# of
citizens
Bias to
Party B
0
What if Party A disenfranchise voters in the swing district?
If swing districts are
very responsive
to transfer...
Targeted
spending
Extra benefit
What if Party A disenfranchise voters in the swing district?
Extra benefit from additional transfer: shrinks in net terms
Free and fair election
Swing district
disenfranchised
If swing districts are
very responsive
to transfer...
Targeted
spending
What if Party A disenfranchise voters in the swing district?
If swing districts are
very responsive
to transfer...
Spending
drops
Party A can consume more of the government budget
# of
citizens
Bias to
Party B
0
What if Party A disenfranchise voters in Party B's district?
# of
citizens
Bias to
Party B
0
What if Party A disenfranchise voters in Party B's district?
Party A's vote share
is larger
Party A is more likely to win than if intimidating swing voters
# of
citizens
Bias to
Party B
0
What if Party A disenfranchise voters in Party B's district?
Both parties target
the swing district
Party A cannot consume more of the government budget
Disenfranchising the swing district is preferred if
The swing district is very responsive
Increase in
probability of winning
by disenfranchising party B's supporters
>
Increase in
the govt budget that can be consumed
by disenfranchising swing voters
This is the case when
Today's summary
Proportional representation elections induce politicians
to provide more public goods than majoritarian elections
In countries where politicians can consume govt budget
they may want to disenfranchise swing voters
Probabilistic voting model is a useful framework
to consider the division-of-a-pie policy issues
Next lecture...
Legislative Bargaining Model

Image source: i.huffpost.com/gen/1883261/images/n-NATIONAL-DIET-large570.jpg
Model of politics #4
This lecture is based on the following academic articles and books:
Chapter 8 of Persson, Torsten, and Guido Tabellini. 2000. Political Economics: Explaining Economic Policy. Cambridge, Massachusetts: MIT Press.
Persson, Torsten, and Guido Tabellini. 2004. “Constitutional Rules and Fiscal Policy Outcomes.” American Economic Review 94(1): 25–45.
See also Persson, Torsten., and Guido Enrico Tabellini. 2003. The Economic Effects of Constitutions. MIT Press.
Robinson, James A, and Ragnar Torvik. 2009. “The Real Swing Voter’s Curse.” American Economic Review 99(2): 310–15.