Political Economics I
This course is officially called:
Political Economics I
This course is officially called:
But we will learn
Causal Inference with Spatial Data
Each week (except today)
First 30 minutes
How spatial data can be used for causal inference
with one top 5 econ journal paper as an example
The rest of class
Practice to generate the data used by the top 5 journal paper
by using ArcGIS and Python
cf. Syllabus
The course is meant for
PhD students in economics and (quantitative) political science
But the large part of the course is all about:
Don't need to understand everything in the course
Pick up whatever you think is useful for your research
how to use ArcGIS and Python
to generate datasets from spatial data
For those who need credits (単位)
Your grade will be based on term paper
You're asked to write a research proposal
You don't have to use spatial data
But you have to convince me that your proposed research is
Original
Important
Feasible
Each week we pick up a piece of research and discuss why it's original, important, and feasible
See the guideline for more detail on how to write a proposal
Submission deadline
Friday 14th December
9:00 am
Last class: Friday 7th December
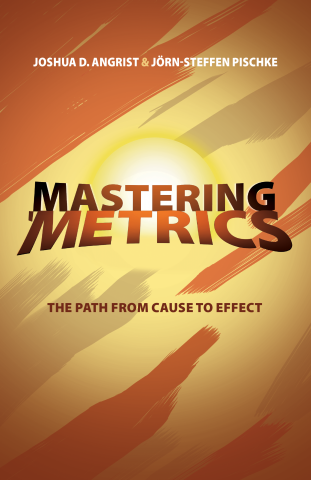
For those eager to learn
Causal inference

Chapter 2: Regression
for Lectures 2, 3, 5, and 8
Chapter 3: Instrumental Variables
for Lectures 4 and 6
Chapter 4: Regression Discontinuity
for Lecture 7
For those eager to learn
Python
(in English, for free of charge)
(in Japanese)

