Agenda & Expectations
Agenda & Expectations
1. Familiarize yourself with WHAT Turn GRaph Is and its terms ARE.
2. Learn How to access and read it to make conclusions.
prerequisites
(optional)
grafana
loki
console
studio
TURN GRAPH
tracing
distributed tracing
distributed request tracing
call graph
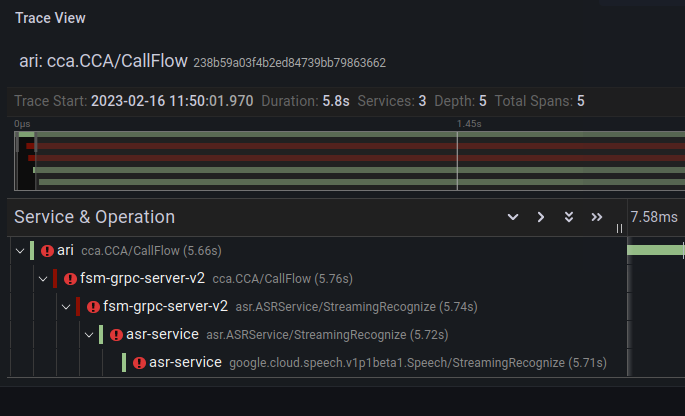
It aims to simplify the workflow of debugging calls.
It is directly connected to a call’s turn i.e., every turn has a corresponding turn graph displaying the technical path it went through.
TURN GRAPH
It is an abstraction over “distributed tracing.”
(3rd pillar of observability)
TURN GRAPH
Understanding TERMS
OpenTelemetry (or OTEL): It is an open-source observability framework. It is a collection of tools, APIs, and SDKs.
Instrumentation: Tweaking any microservice in order to gather telemetry data out of it (may or may not require any source code change).
Understanding TErms
Tempo: It is a distributed tracing backend responsible for storing traces. We use the S3 bucket to store traces.
Understanding TErms #2
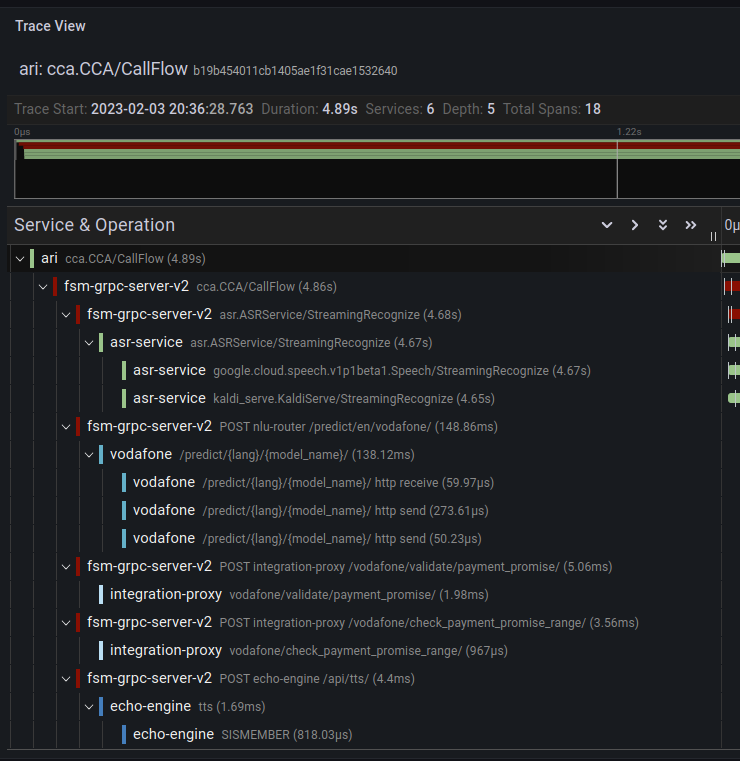
Span: It represents an operation within a transaction. It’s the smallest unit and uniquely identified by a span_id.
Trace: It is a directed acyclic graph (DAG) of spans, where the edges between spans are defined as a parent/child relationship and uniquely identified by a trace_id.
High-level Architechture

How it works?
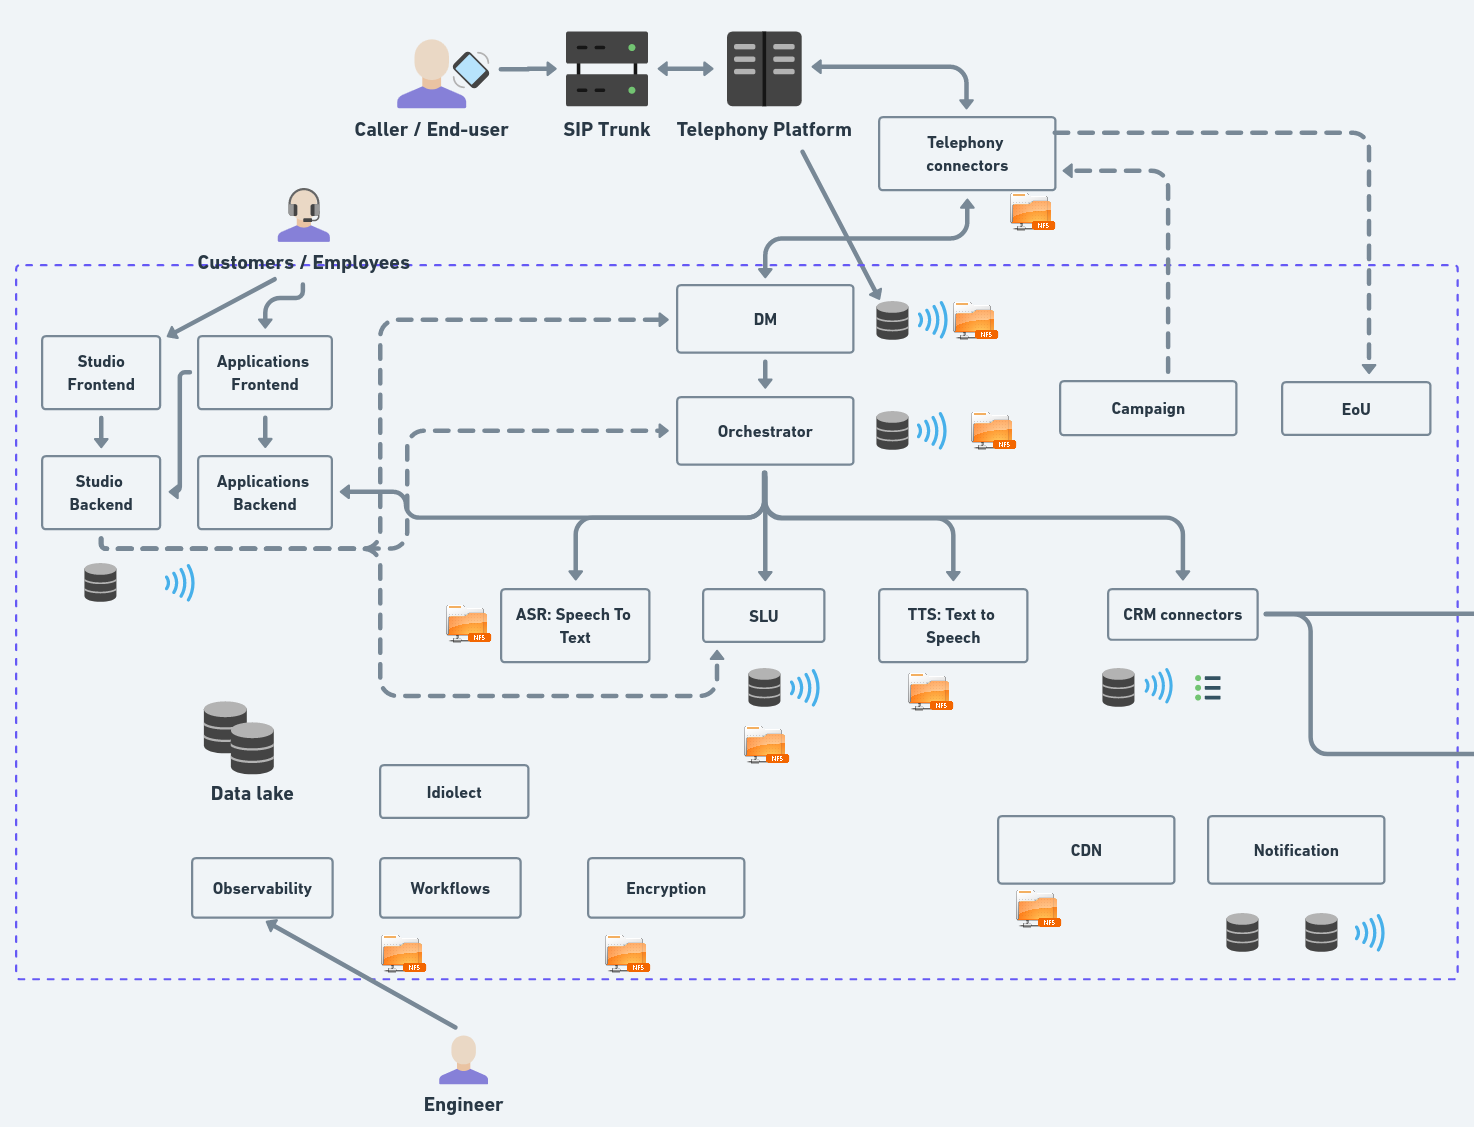
Traceparent
Collector
Grafana
PUSH
PULL
How to access it?
1. Via Console & Studio
2. Via Sentry Events
How to Access it?
--- ACTION!
(only for services)The goal is to get the trace_id to access the corresponding turn graph.
--- ACTION! #2
3. If these workflows don't work for whatever reason - The Vanilla Approach
4. Via Linkerd tap
How to Access it? (BONUS)
--- ACTION
The goal is to get the trace_id to access the corresponding turn graph.
Reading TuRN GRAPH
READING TURN GRAPH #1

READING TURN GRAPH #2
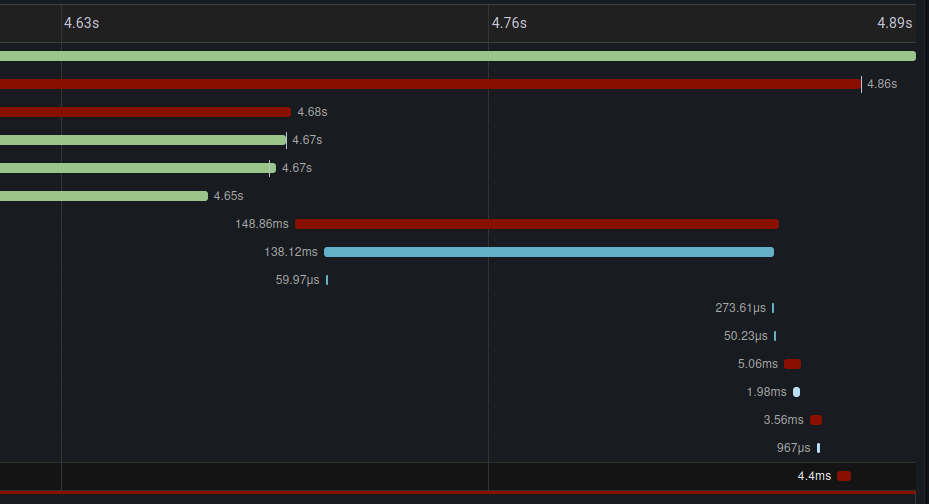
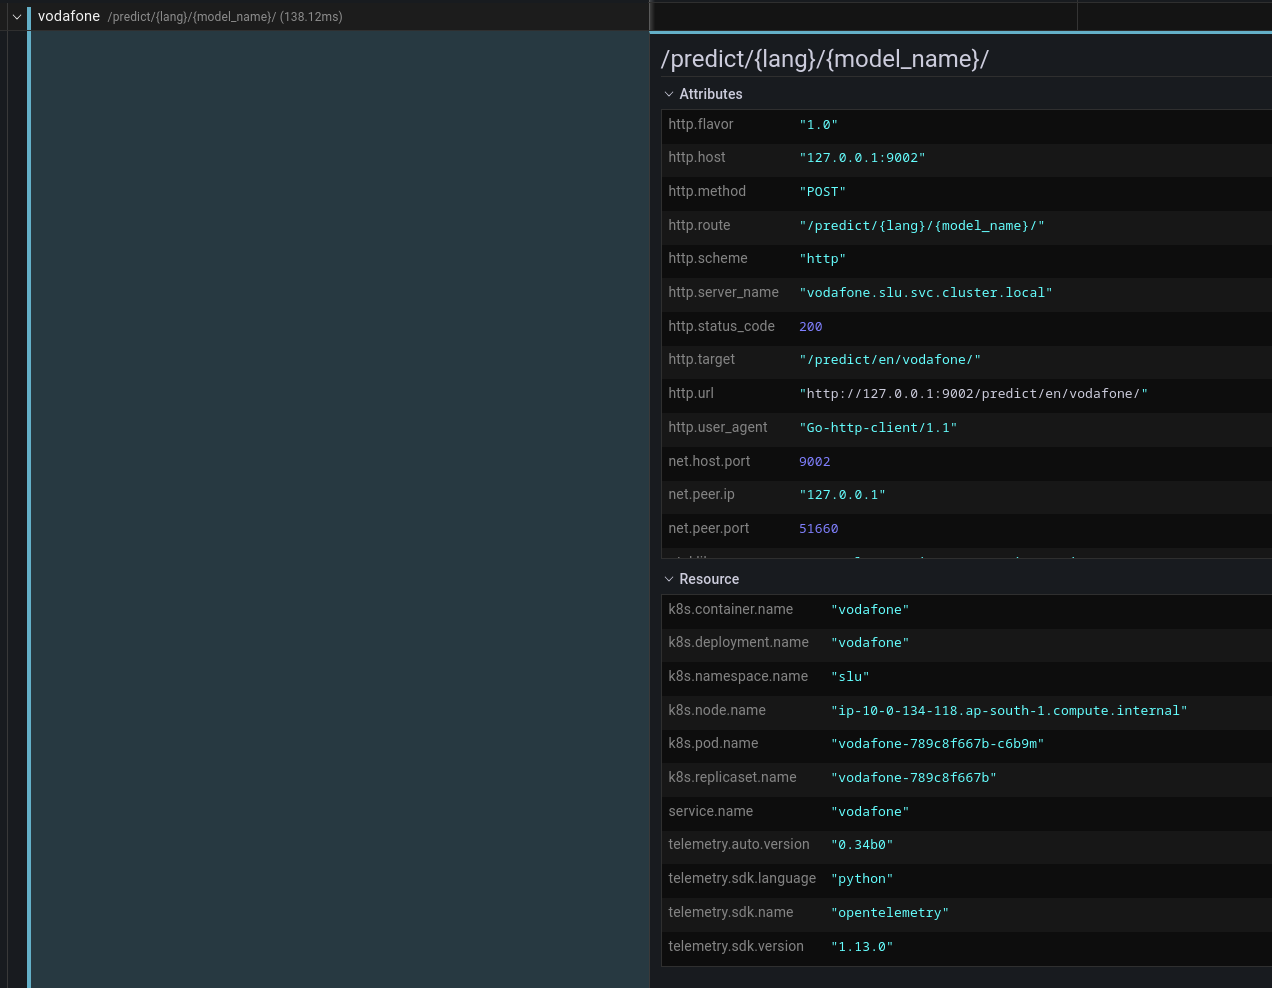
READING TURN GRAPH #3 (http)
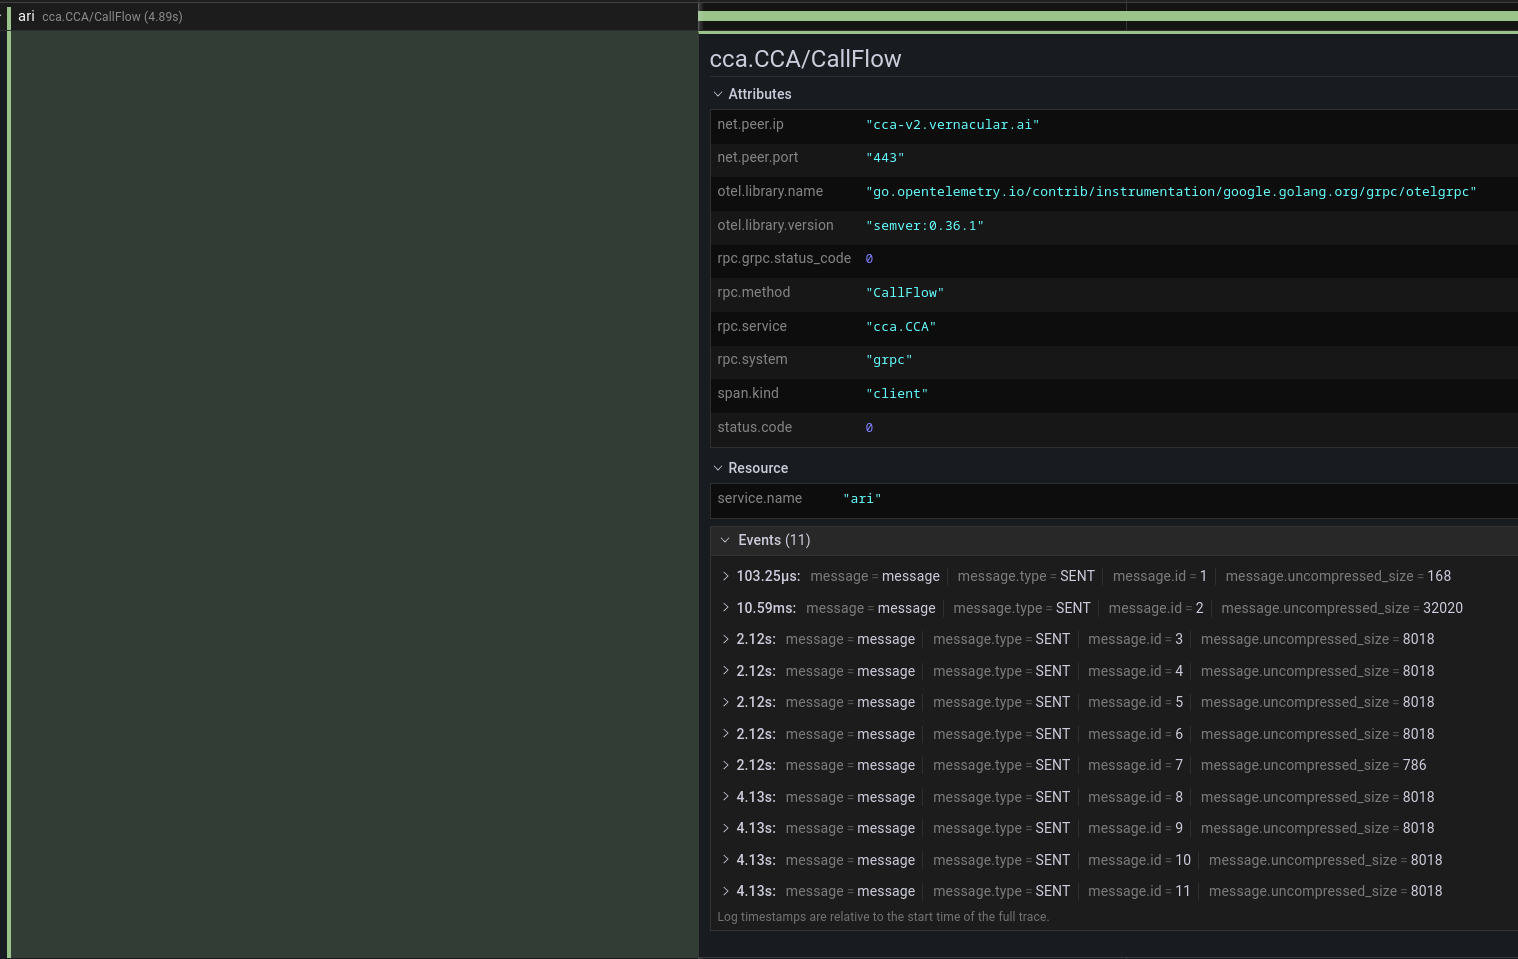
READING TURN GRAPH #4 (Grpc)
READING TURN GRAPH #5 (nodeS)
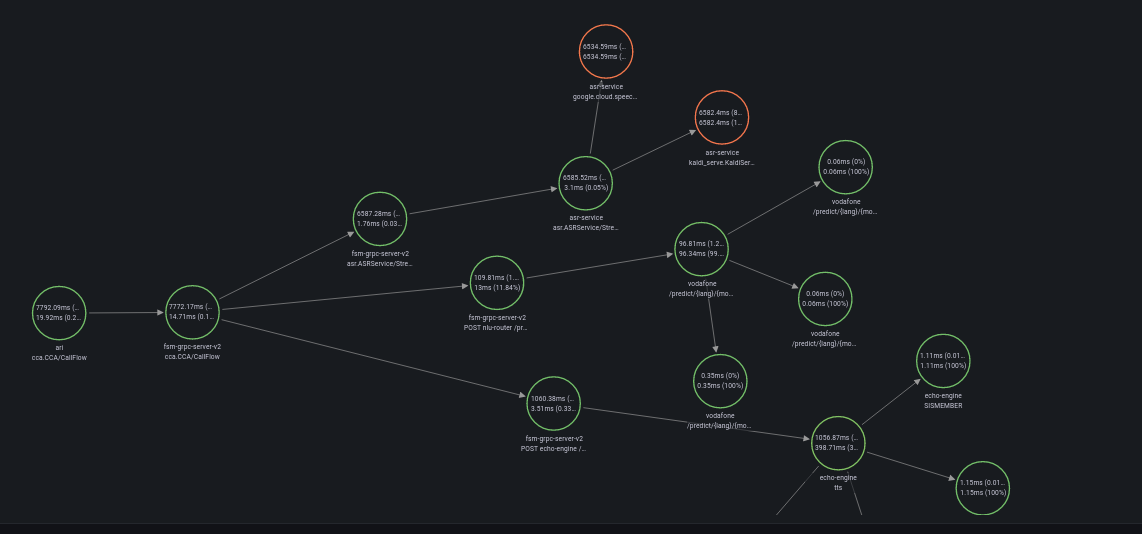
READING TURN GRAPH #6 (ErrORS)
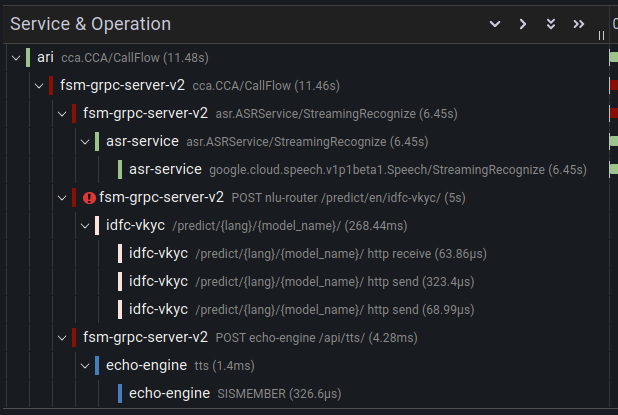
READING TURN GRAPH #7 (More Errors)
