diamonds.head()

import seaborn as sns

sns.stripplot(x='cut', y='price', data=diamonds)
plt.show()
Seaborn


Univariate plots - Stripplot
diamonds.head()

import seaborn as sns

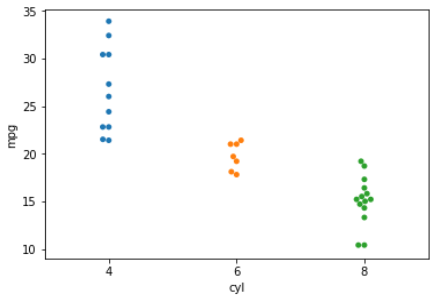
sns.swarmplot(x='cyl', y='mpg', data=mtcars)
plt.show()
Seaborn
Spreads out points to prevent overplotting
note: very slow
Univariate plots - Swarmplot
import seaborn as sns

sns.boxplot(x='cut', y='price', data=diamonds)
plt.show()

sns.violinplot(x='cut', y='price', data=diamonds)
plt.show()
Seaborn
Violinplot, alternative to boxplot that also shows frequency distribution
Univariate plots


Standard boxplot
import seaborn as sns

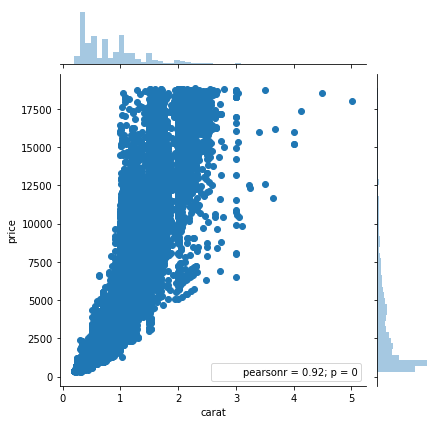
sns.jointplot(x='carat', y='price', data=diamonds)
plt.show()
Seaborn
plots continuous x and y variables against eachother with correlation and histograms on both sides
Multivariate plots - Jointplot
import seaborn as sns

sns.pairplot(data=diamonds)
plt.show()
Seaborn
Plots each variable in the dataset against each other to quickly get an overview of the data
Multivariate plots - pairplot

import seaborn as sns

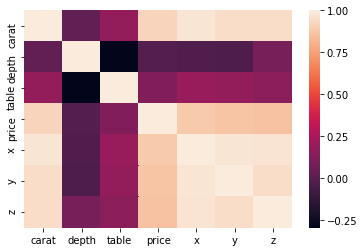
diamonds2 = diamonds.drop(diamonds.columns[[1, 2, 3]], axis=1)
covars = diamonds2.corr()

sns.heatmap(covars)
plt.show()
Seaborn
First calculate covariances, the heatmap will display them visually
Multivariate plots - heatmap
import seaborn as sns

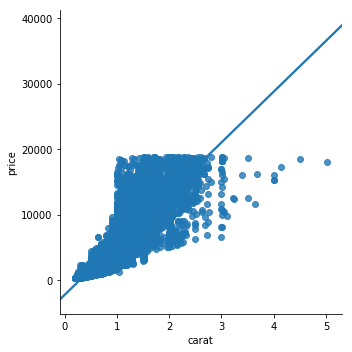
sns.regplot(x='carat', y='price', data=diamonds)
plt.show()
Seaborn
Simple way to plot linear model over a scatterplot
Statistical plots - regplot (1/2)
import seaborn as sns

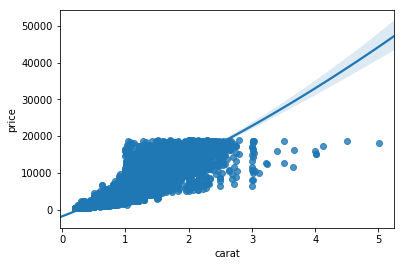
sns.regplot(x='carat', y='price', data=diamonds, order=2)
plt.show()
Seaborn
Add 'order' argument to fit different level polynomials over the data
Statistical plots - regplot (2/2)
import seaborn as sns

sns.lmplot(x='carat', y='price', data=diamonds, hue='cut', scatter_kws={'alpha':0.1})
plt.show()
Seaborn
- Hue divides the data in different groups based on a factor variable
- scatter_kws={'alpha':0.1} sets the alpha of the scatter plot part of the lmplot()
Statistical plots - lmplot
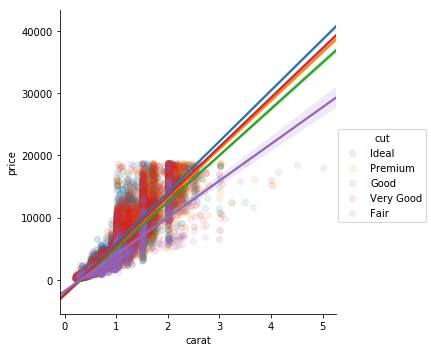
Combination of sns.regplot() and facet grid. Allows you to set extra arguments like 'hue'
import seaborn as sns

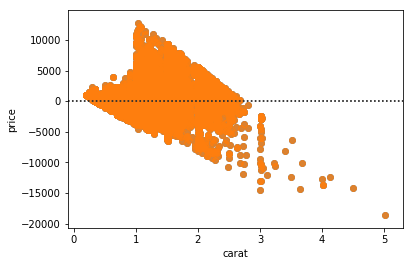
sns.residplot(x='carat', y='price', data=diamonds)
plt.show()
Seaborn
Statistical plots - Residplot
Allows you to plot residuals of the relationship between different continuous variables
Seaborn
Further information
Many more options available
- https://seaborn.pydata.org/
- http://www.puzzlr.org/a-quick-overview-of-seaborn/
import matplotlib.pyplot as plt
import pandas as pd
df=pd.read_csv("/Users/anchaljaiswal/Downloads/diamonds.csv")
plt.scatter(x=df.carat,y=df.price)
plt.show()
Customization

We start with a simple scatter plot between Carat and Price of a diamond
Now let's add axis labels and chart title to improve readability
plt.scatter(x=df.carat,y=df.price)
plt.xlabel("Carat")
plt.ylabel("Price")
plt.title("Diamonds")
plt.show()
Customization

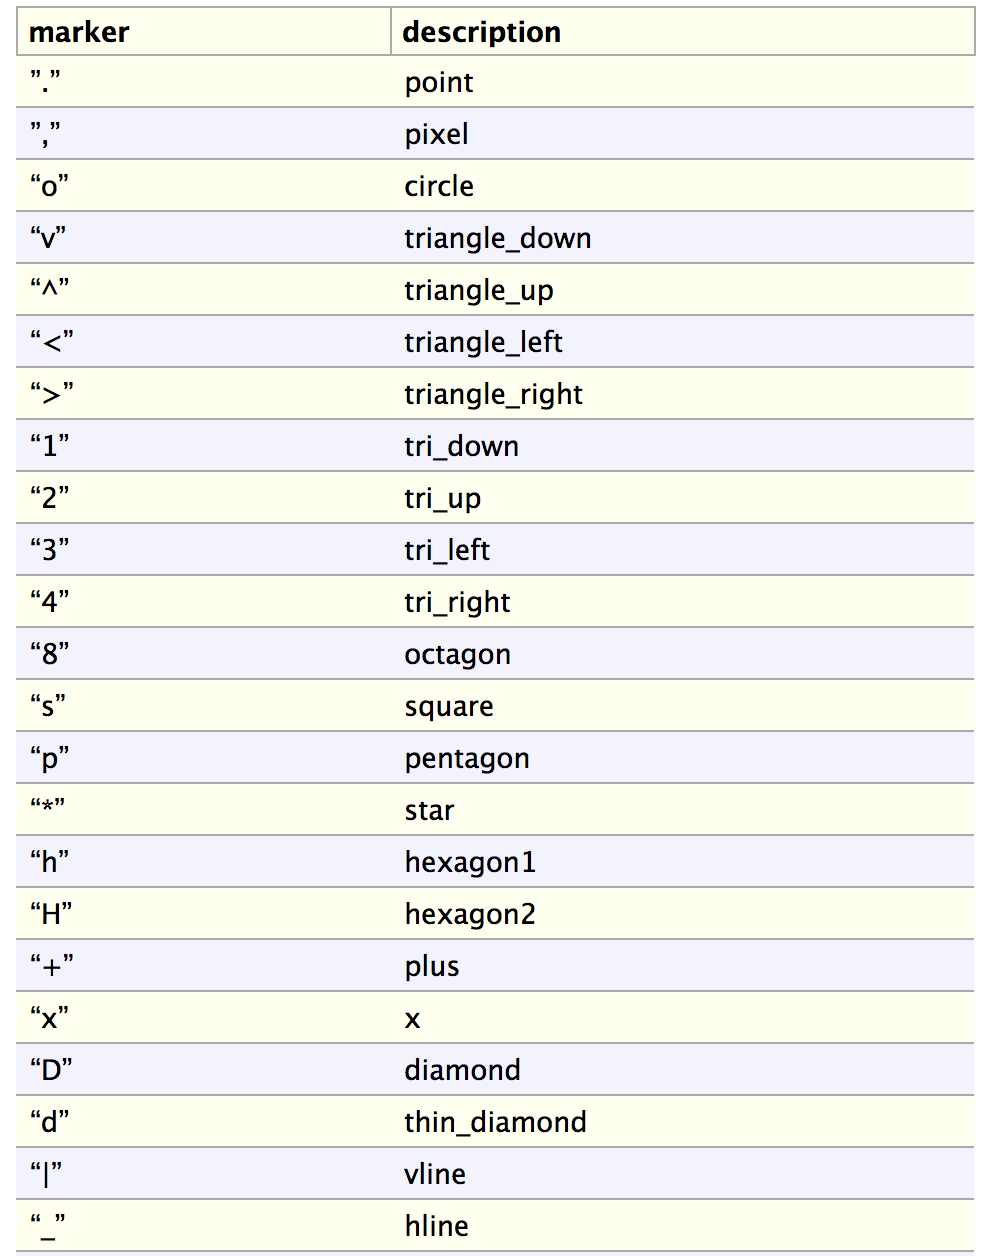
We can also change the color and shape of the points in the graph
plt.scatter(x=df.carat,y=df.price,marker='2')
plt.xlabel("Carat")
plt.ylabel("Price")
plt.title("Diamonds")
plt.show()
Customization

Changing the shape
Customization
plt.scatter(x=df.carat,y=df.price,c='g',
marker='2')
plt.xlabel("Carat")
plt.ylabel("Price")
plt.title("Diamonds")
plt.show()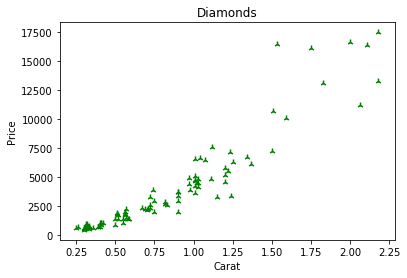
Changing the Color: Option1

plt.scatter(x=df.carat,y=df.price,c='#0000FF',
marker='2')
plt.xlabel("Carat")
plt.ylabel("Price")
plt.title("Diamonds")
plt.show()
Changing the Color: Option 2
Customization
plt.scatter(x=df.carat,y=df.price,marker='^')
plt.xlabel("Carat")
plt.ylabel("Price")
plt.title("Diamonds")
y_max=max(df.price)
x_max=df.carat[df.price==y_max]
print(x_max)
plt.annotate('Max Price', xy=(x_max,y_max), xytext=(3, 5),
    arrowprops=dict(facecolor='black', shrink=0.05))
plt.show()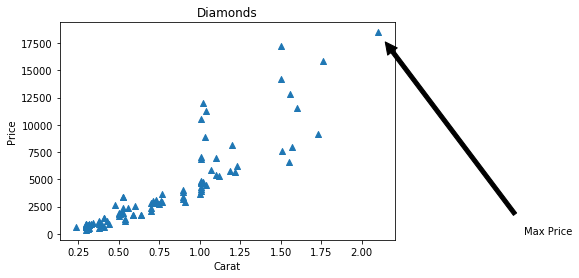
We can use the annotate function to highlight a specific feature in the graph
Customization
plt.scatter(df.carat,df.price,)
plt.xlabel("Carat")
plt.ylabel("Price")
plt.xticks(np.arange(min(df.carat)+0.1, max(df.carat)+0.3, 0.5))
plt.yticks(np.arange(500, max(df.price)+2000, 3000))
plt.title("Diamonds")
plt.show()
Get or set the x-limits and y-limits of the current tick locations and labels.

Customization
plt.scatter(df.carat,df.price,)
plt.xlabel("Carat")
plt.ylabel("Price")
plt.title("Diamonds")
plt.tight_layout()
plt.show()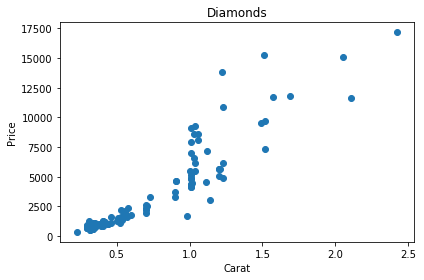
Tight layout automatically adjusts the parameters, so that the plot fits the figure area
Customization
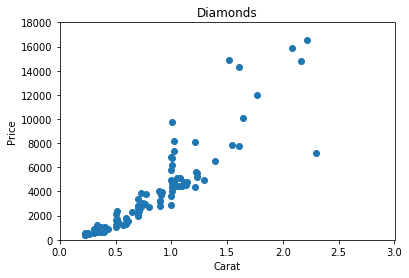
plt.scatter(df.carat,df.price,)
plt.hist(df.carat)
plt.xlabel("Carat")
plt.ylabel("Price")
plt.xlim(0,3)
plt.ylim(0,18000)
plt.title("Diamonds")
plt.show()
Xlim and Ylim automatically sets limits in y and x parameters.
Customization
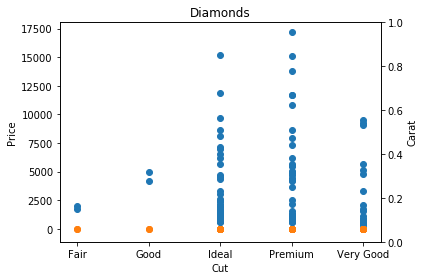
plt.scatter(df.cut, df.price)
plt.scatter(df.cut, df.carat)
plt.ylabel("Price")
plt.xlabel("Cut")
plt.twinx()
plt.ylabel("Carat")
plt.title("Diamonds")
plt.show()
Create a twin Axes sharing the x-axis
Customization
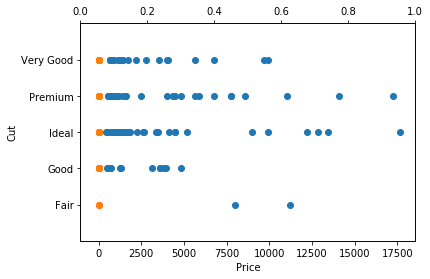
plt.scatter(df.price, df.cut)
plt.scatter(df.carat, df.cut)
plt.ylabel("Cut")
plt.xlabel("Price")
plt.ylim(0,18000)
plt.twiny()
plt.ylabel("Cut")
plt.ylim(-1,5)
plt.show()
Create a twin Axes sharing the y-axis
Customization
plt.subplot(2,1,1);
plt.scatter(df.price, df.cut)
plt.scatter(df.carat, df.cut)
plt.ylabel("Cut")
plt.xlabel("Price")
plt.ylim(0,18000)
plt.twiny()
plt.ylabel("Cut")
plt.ylim(-1,5)

plt.subplot(2,1,2);
plt.scatter(df.cut, df.price)
plt.scatter(df.cut, df.carat)
plt.ylabel("Price")
plt.xlabel("Cut")
plt.twinx()
plt.ylabel("Carat")


plt.tight_layout()
plt.show()
Customization
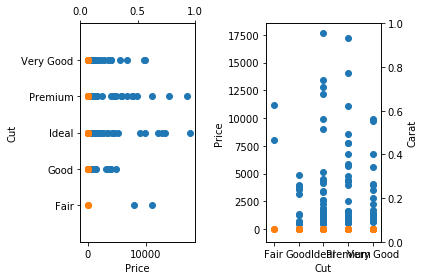
plt.subplot(1,2,1);
plt.scatter(df.price, df.cut)
plt.scatter(df.carat, df.cut)
plt.ylabel("Cut")
plt.xlabel("Price")
plt.ylim(0,18000)
plt.twiny()
plt.ylabel("Cut")
plt.ylim(-1,5)

plt.subplot(1,2,2);
plt.scatter(df.cut, df.price)
plt.scatter(df.cut, df.carat)
plt.ylabel("Price")
plt.xlabel("Cut")
plt.twinx()
plt.ylabel("Carat")


plt.tight_layout()
plt.show()
In the previous subplot (2,1,1) and (2,1,2) while in this one (1,2,1) and (1,2,2)
