Behind the scenes of the
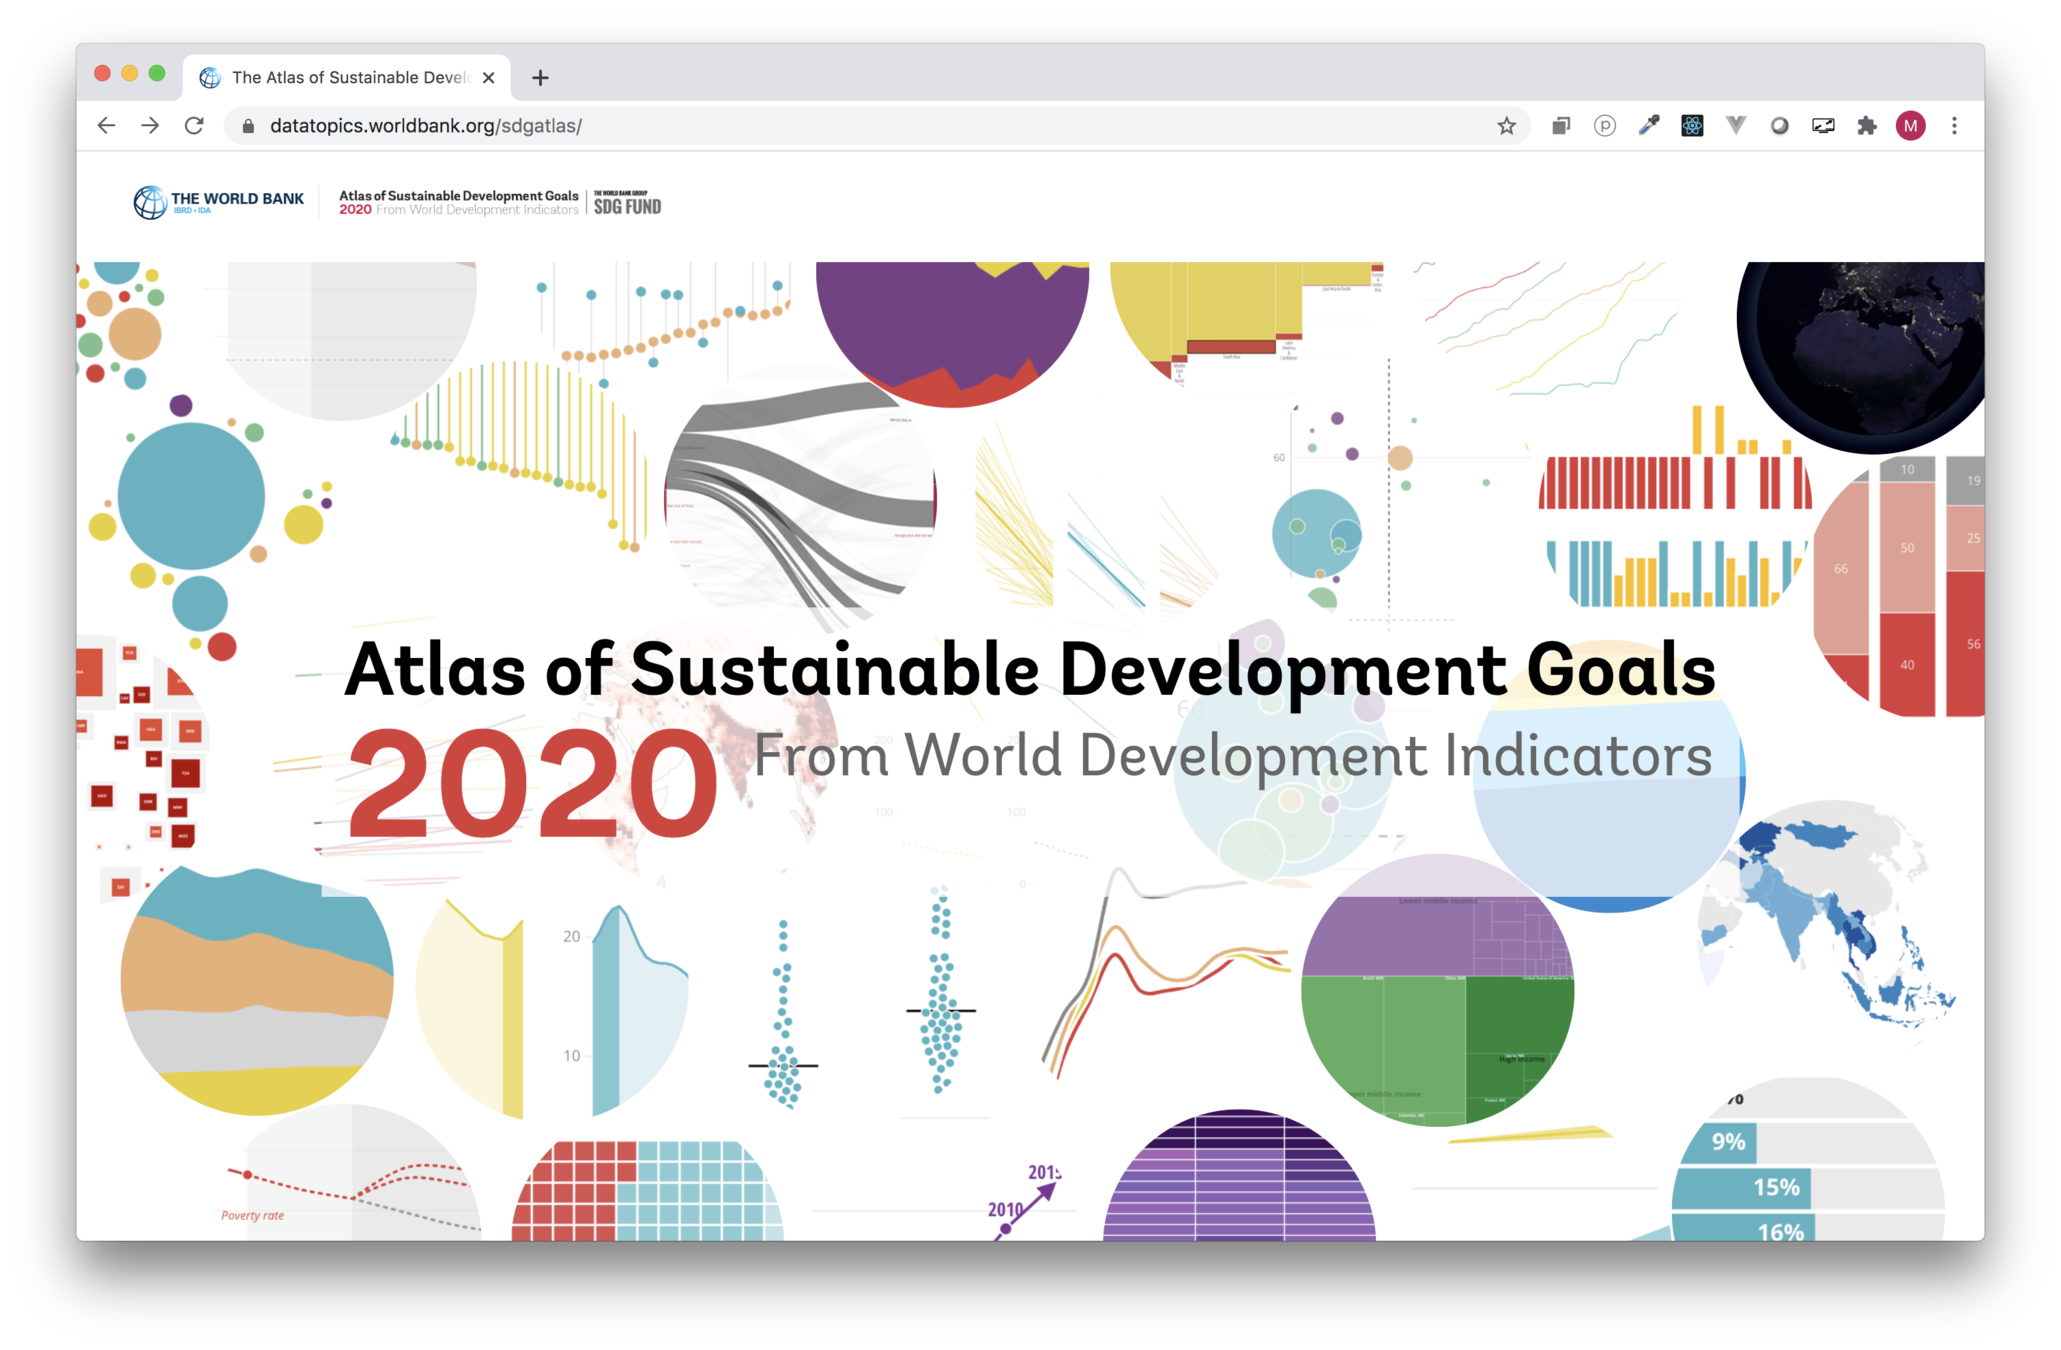
SDG Atlas 2020
Maarten Lambrechts
From raw data to 17 interactive data stories
World Bank Data Lab
2021-02-25
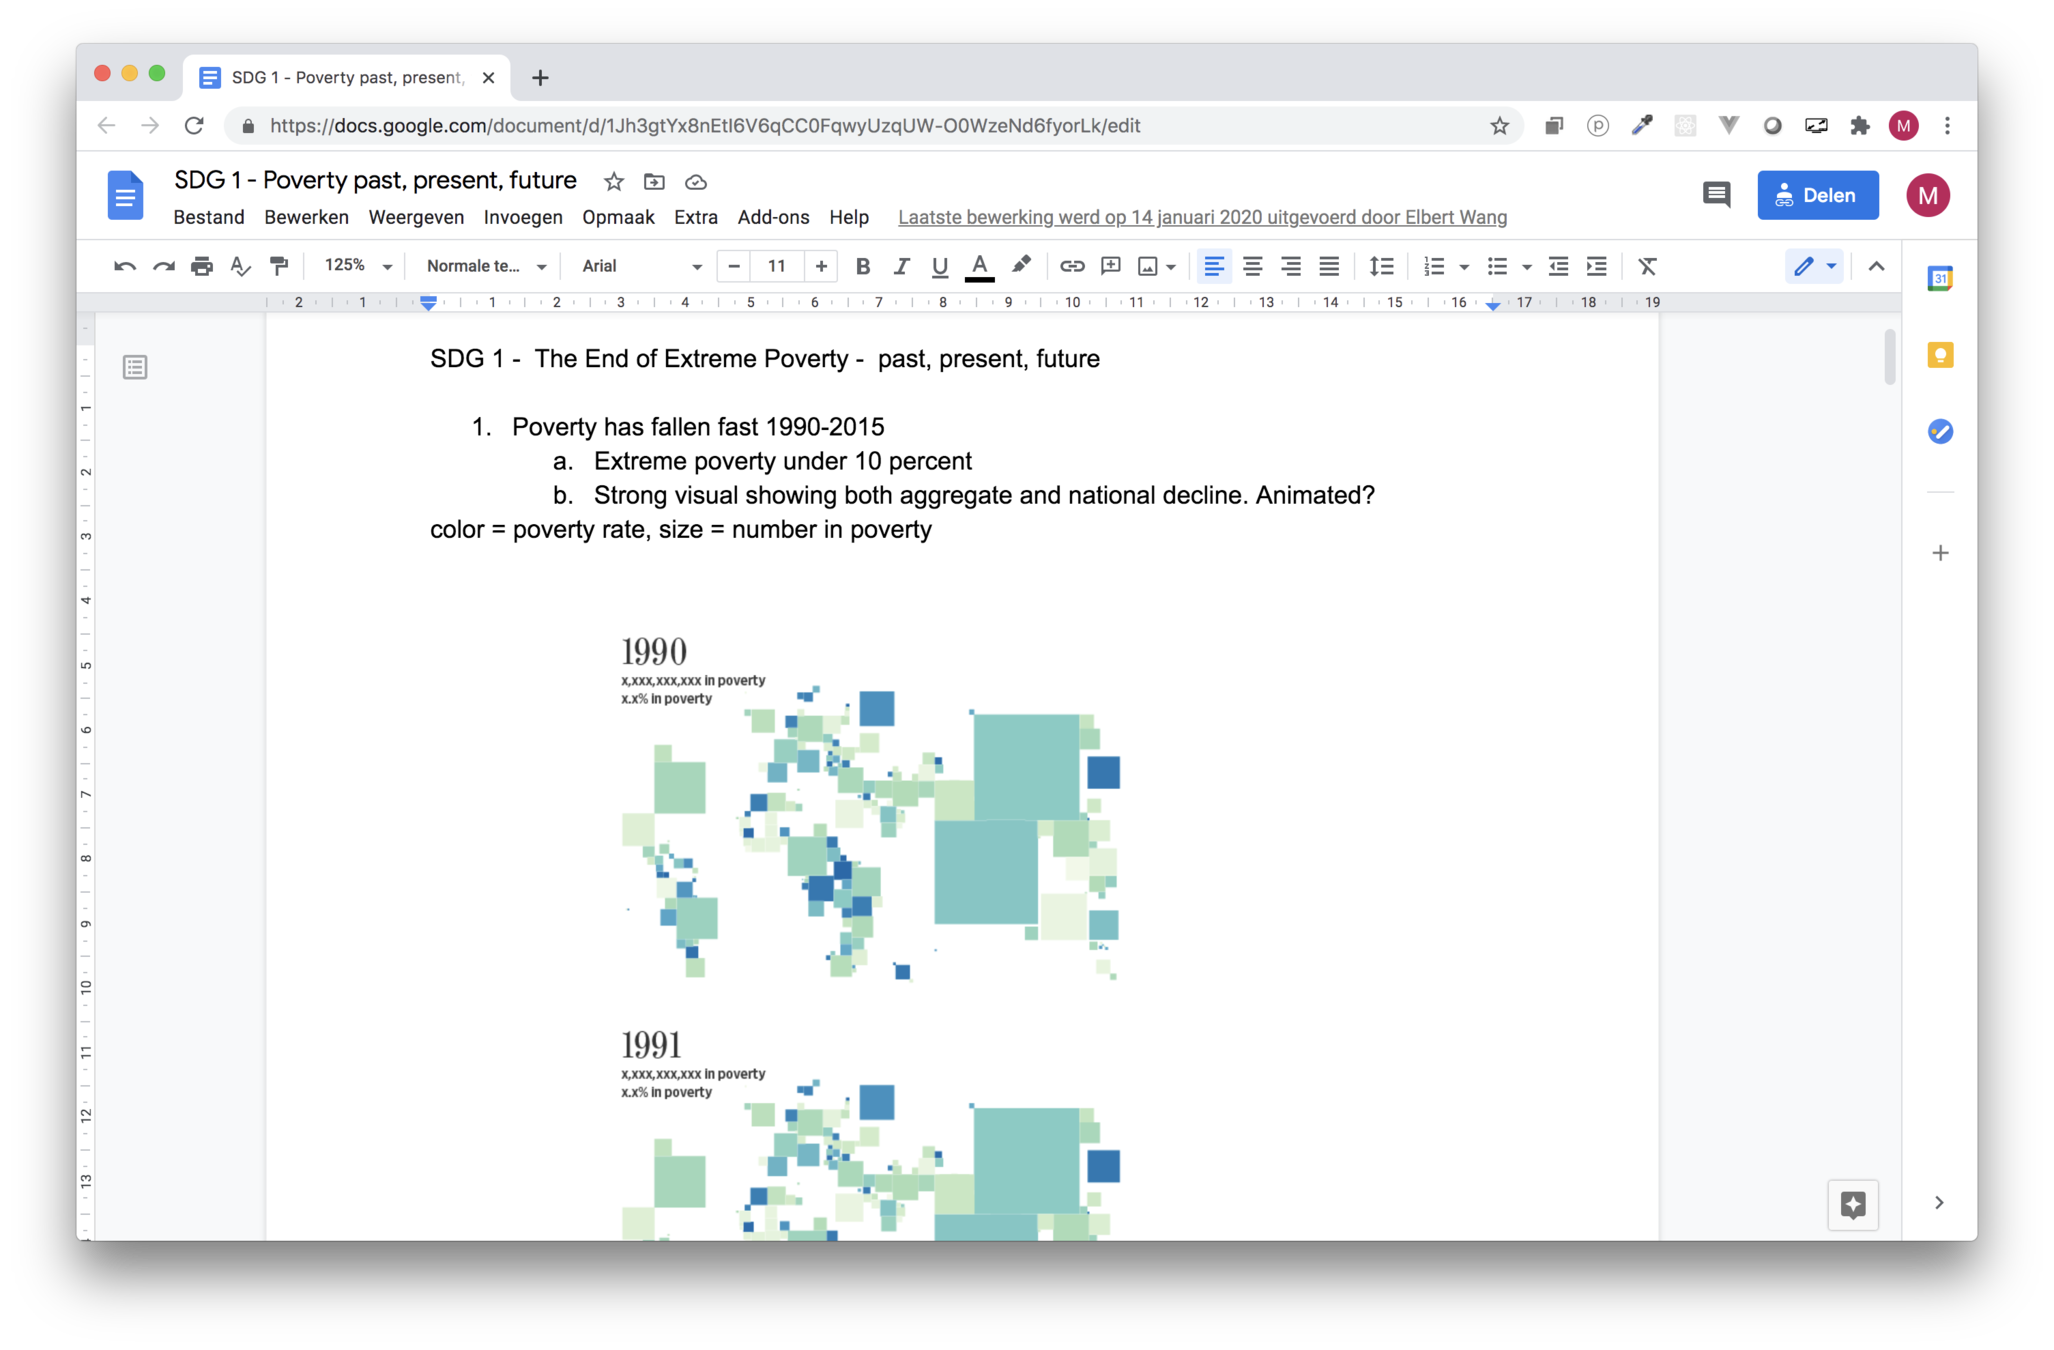
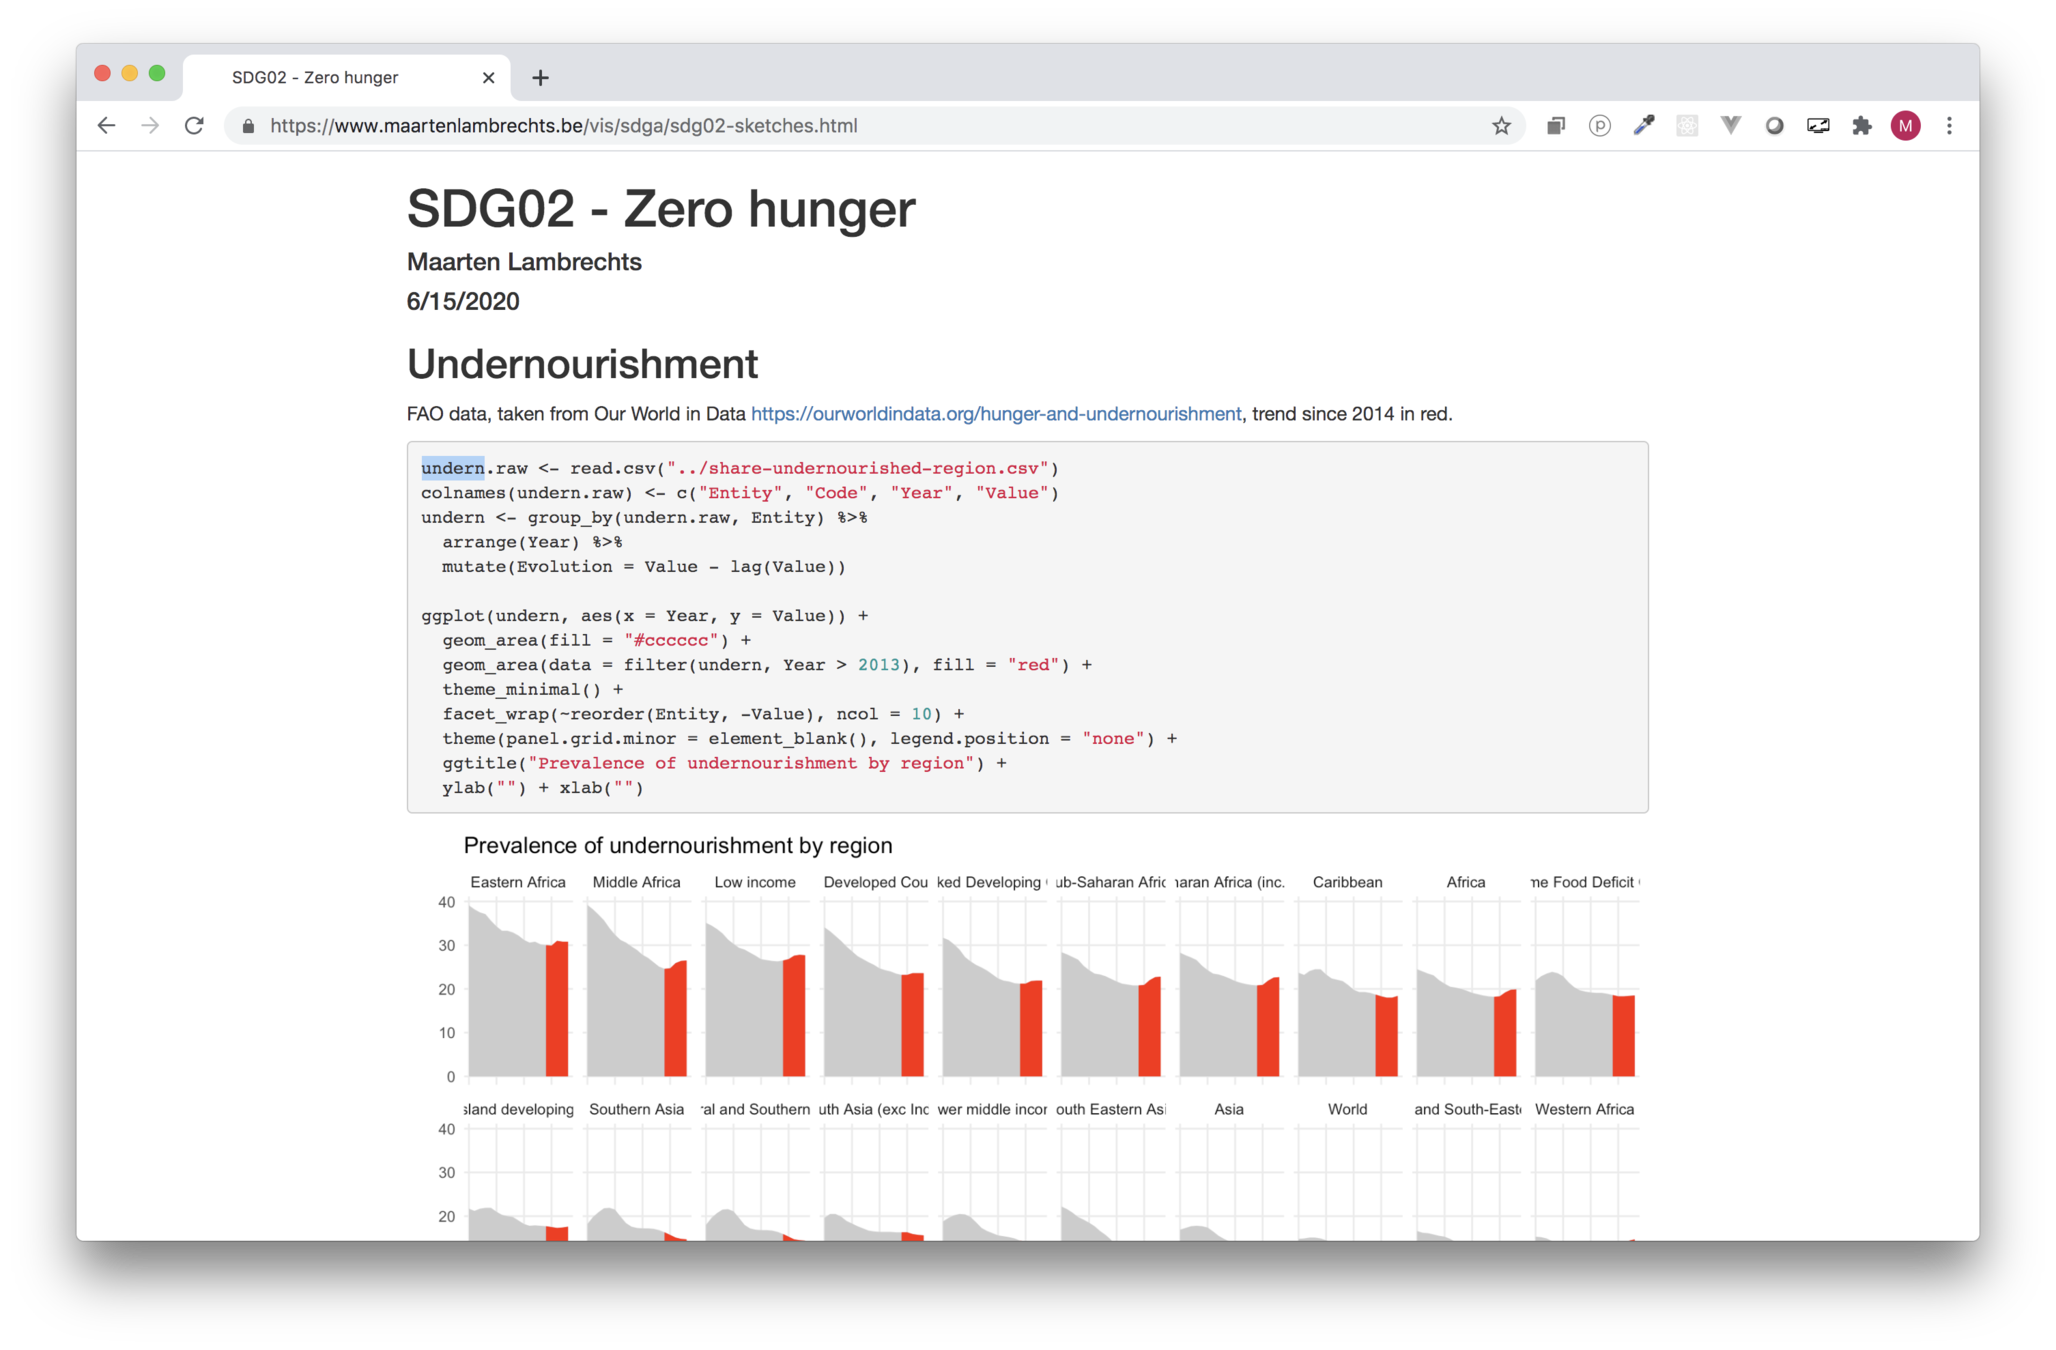
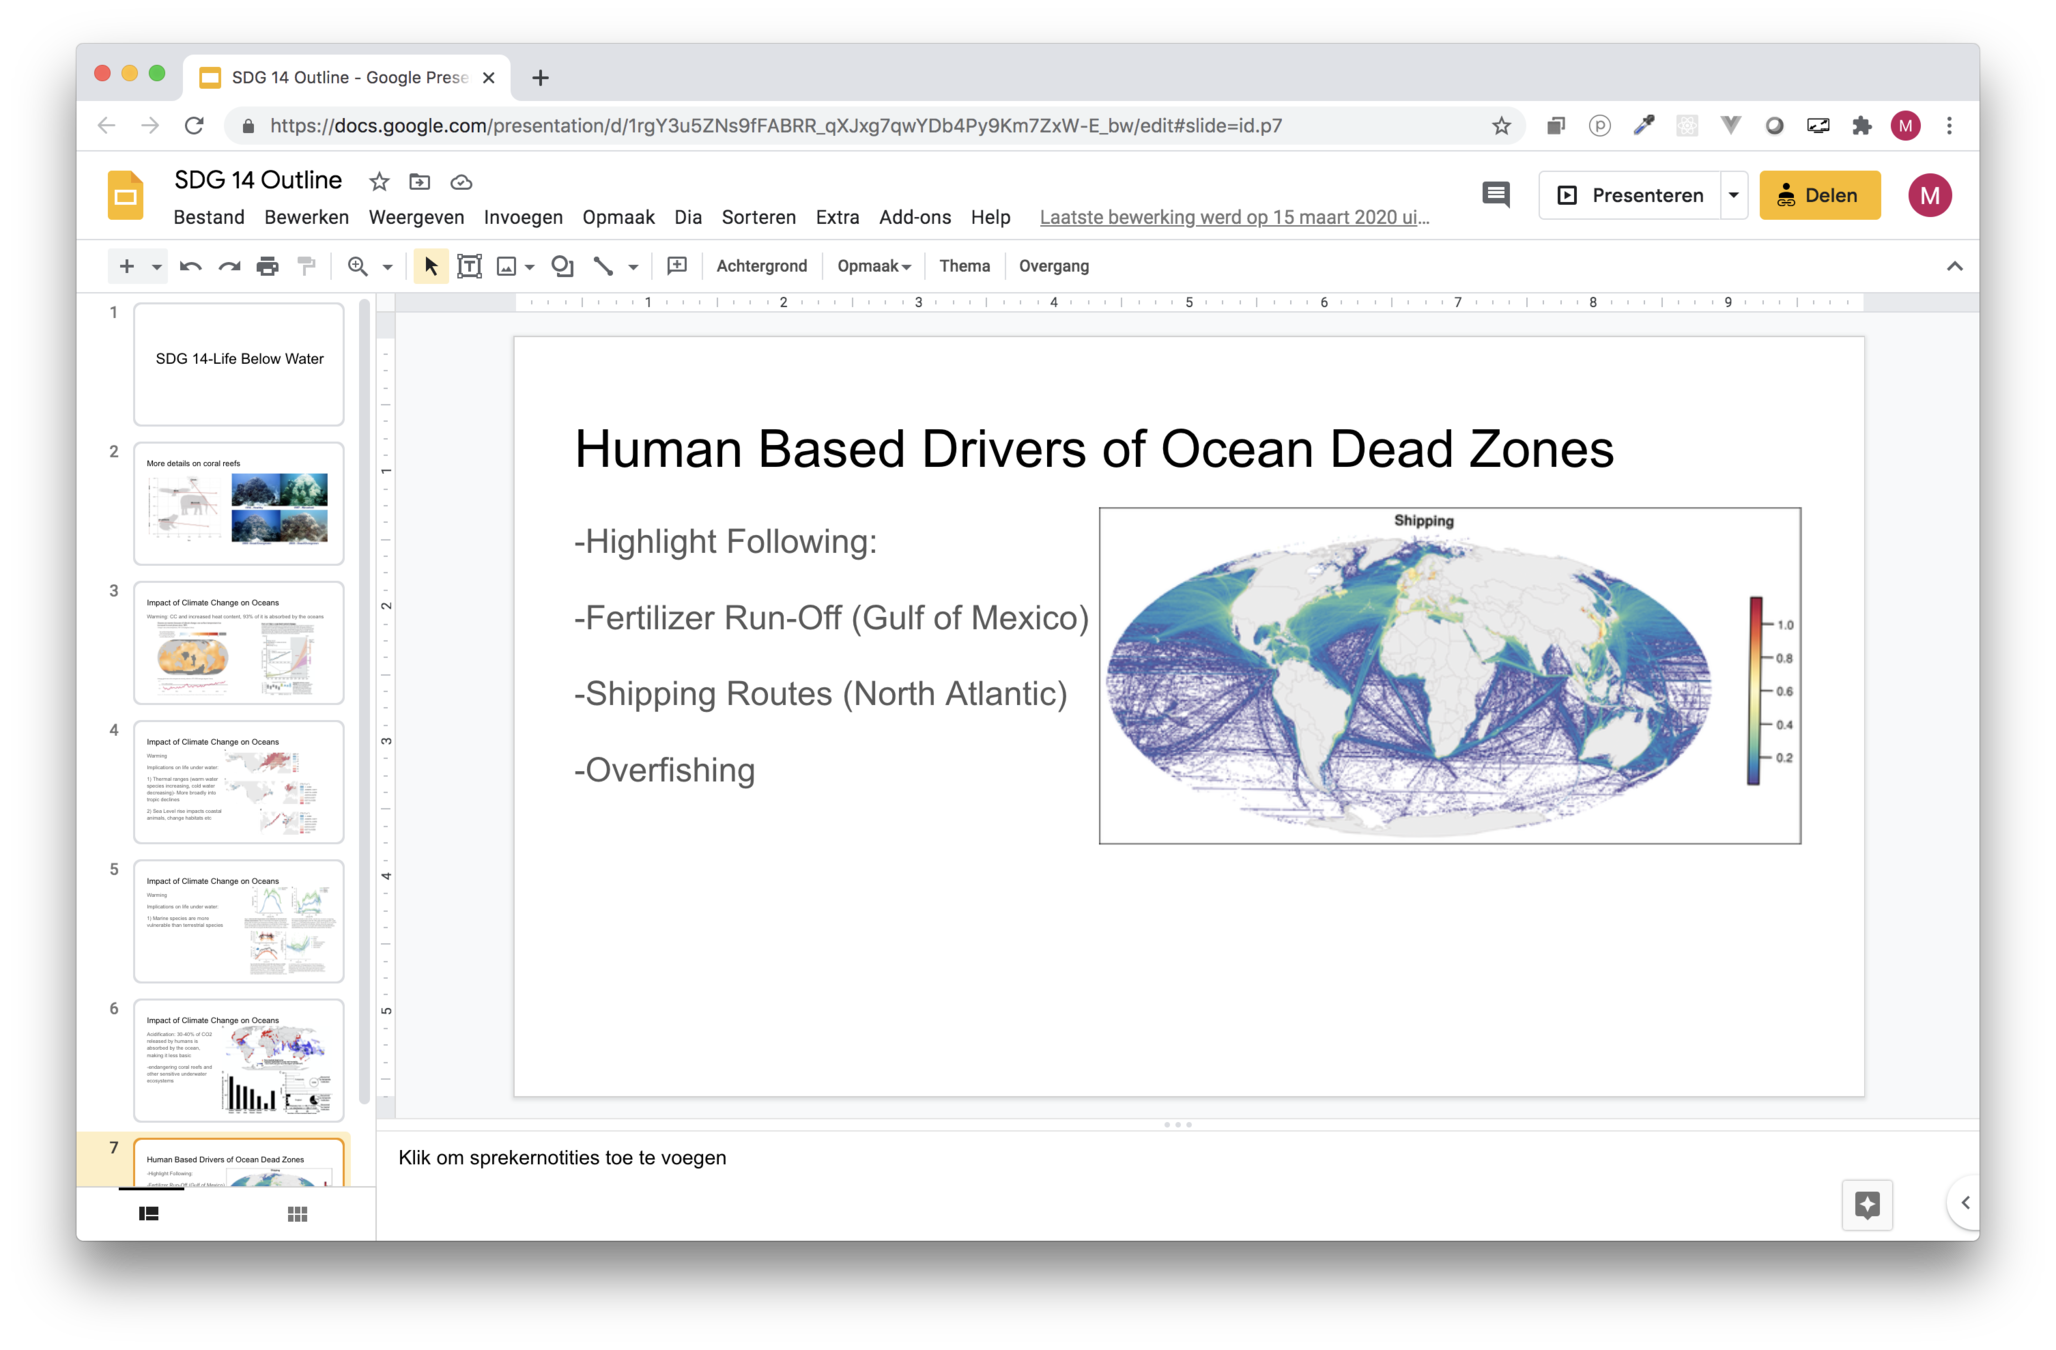
Sketching storylines & visualizations
Defining the angle
Selecting the data
Finding best visual representations
Developing a narrative
Data
Sources
World Development Indicators
Other Worldbank data
Other public data
Open research data
Researchers
Google Earth Engine
...
Data
API's
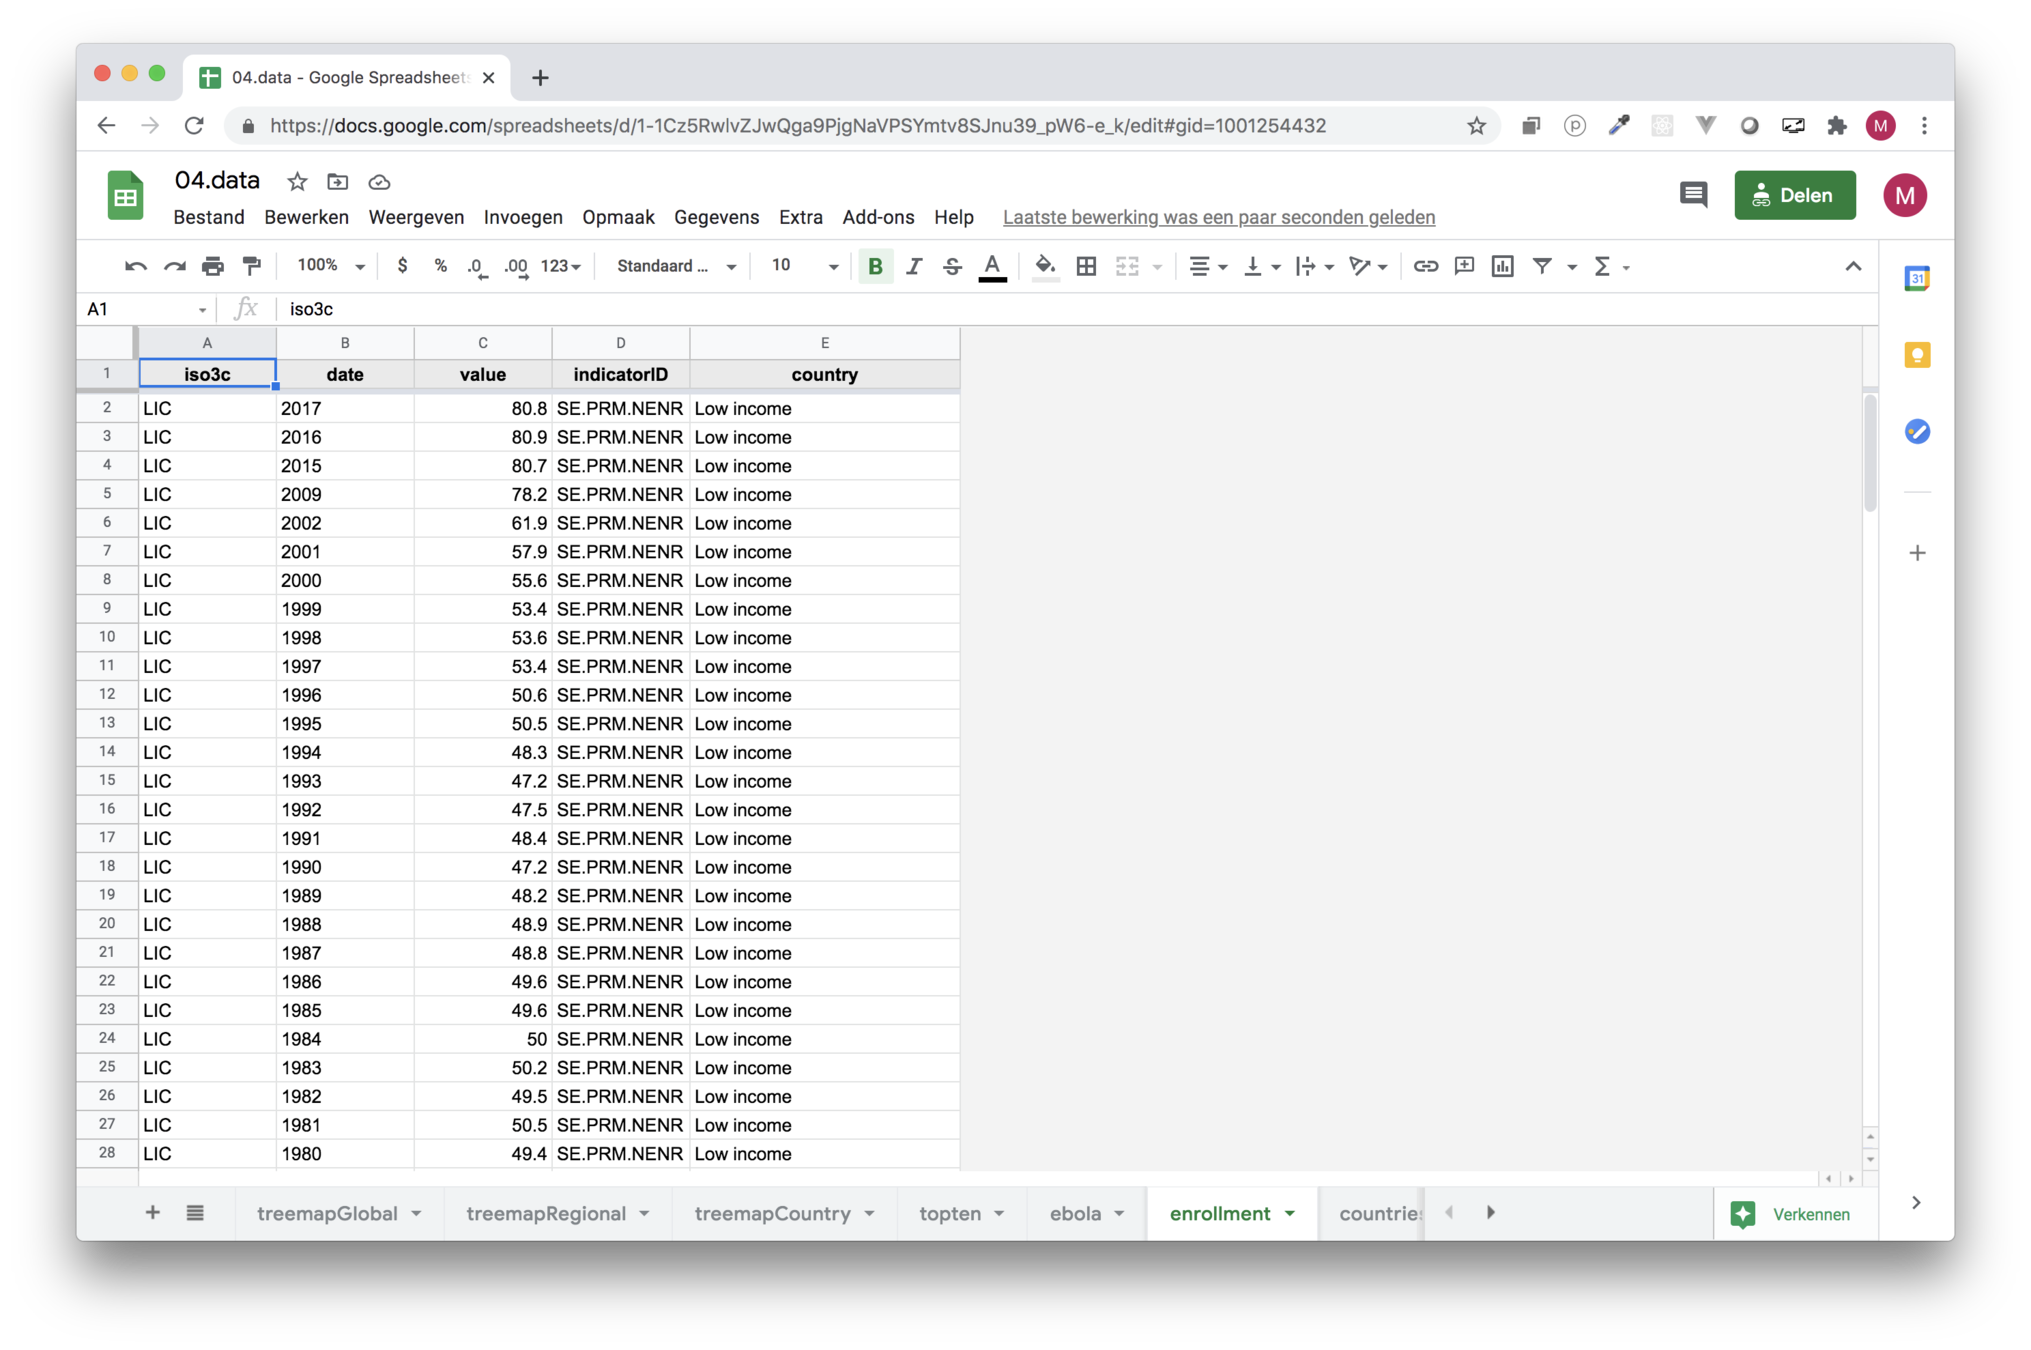
Csv, Excel
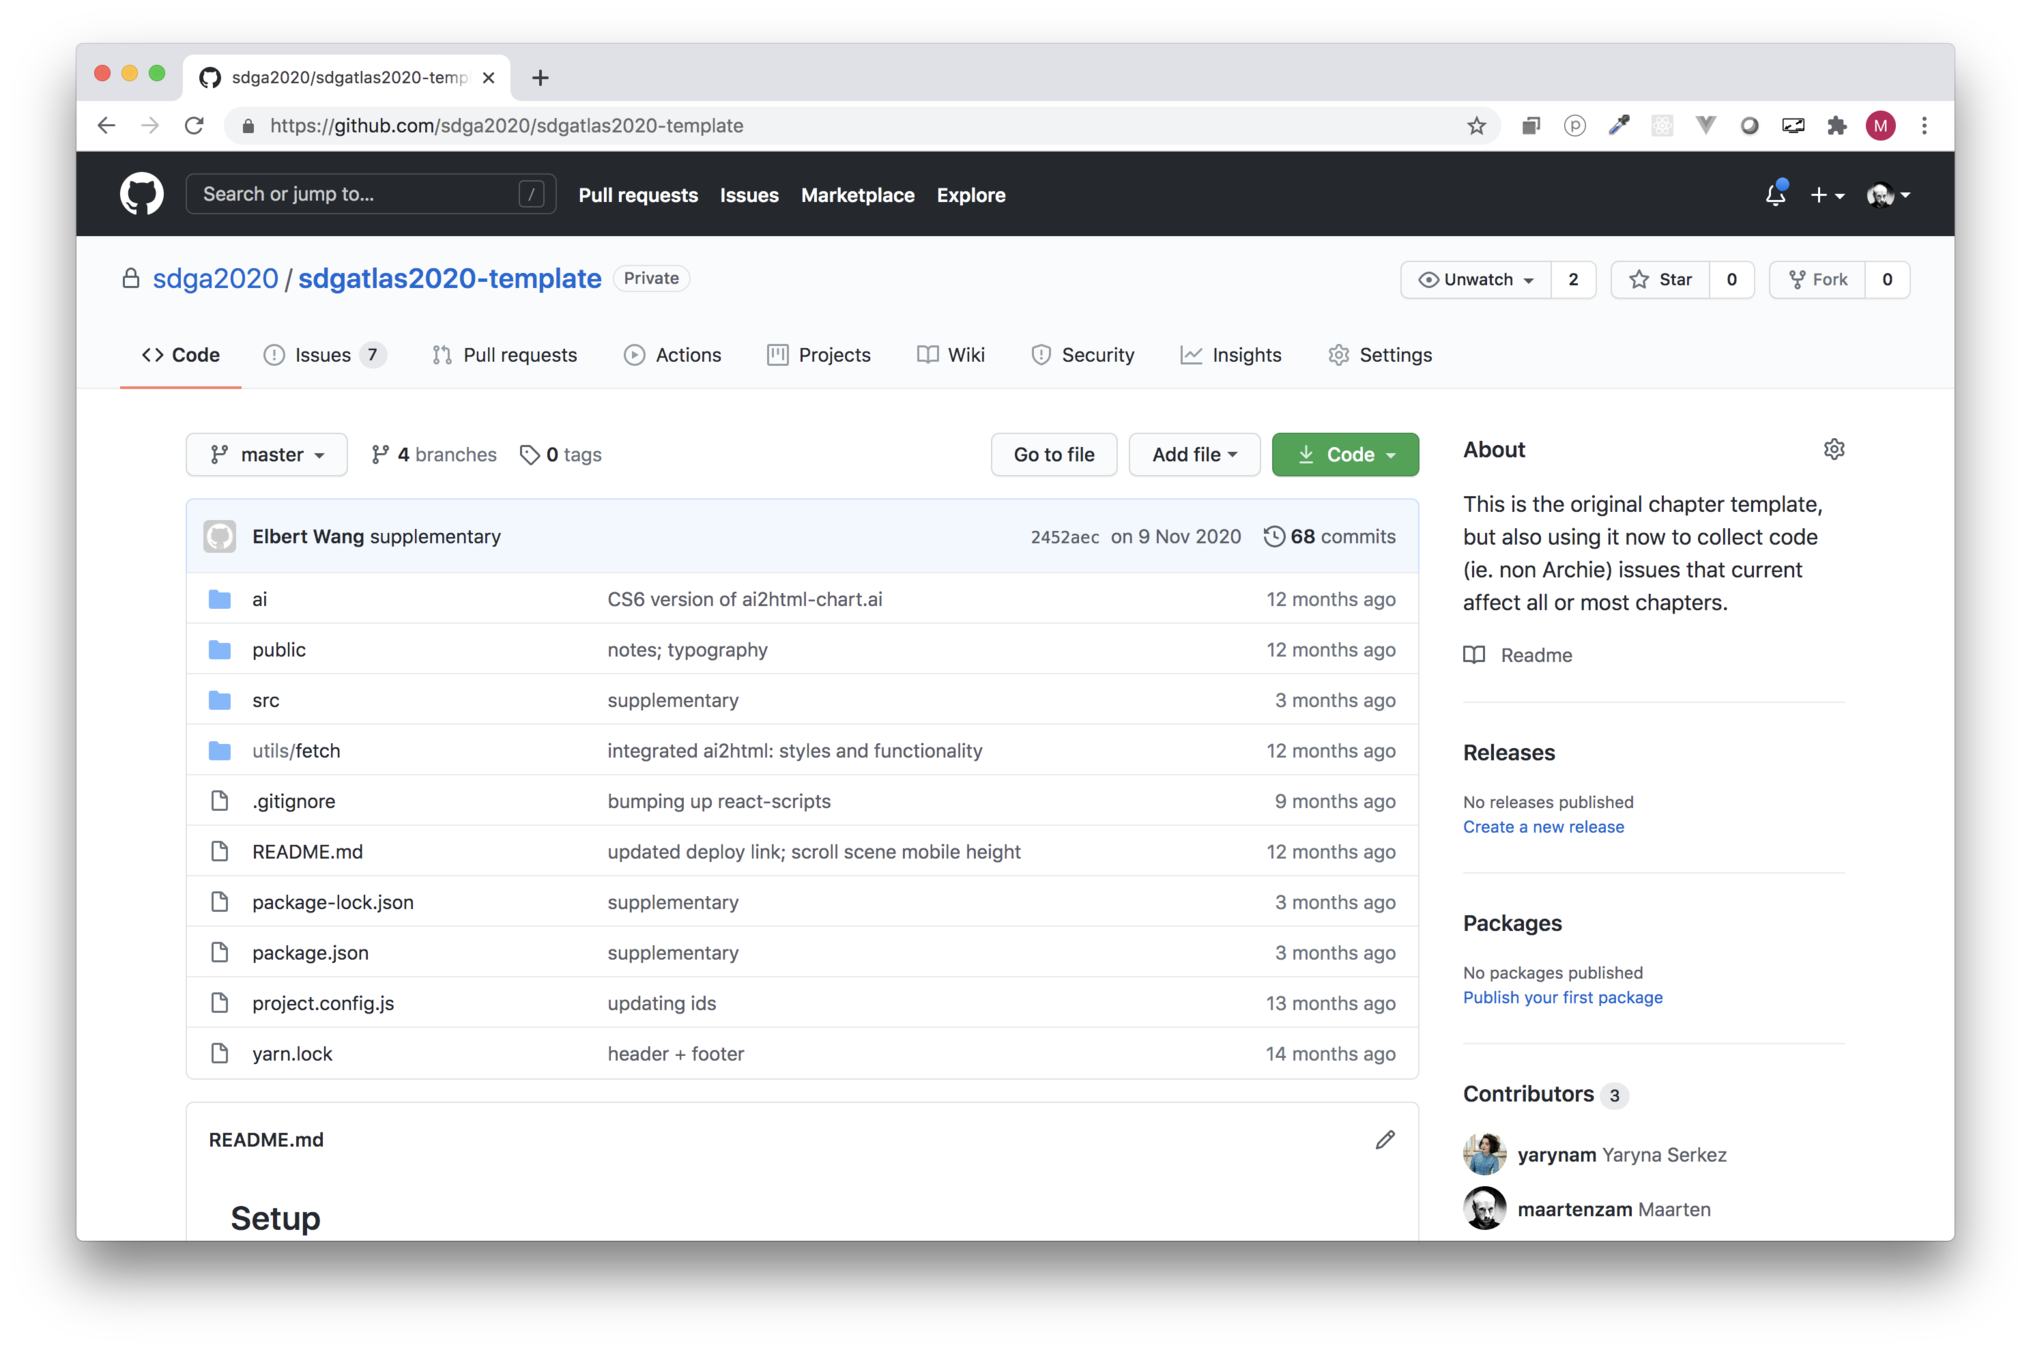
Github repositories
R-scripts
Stata files
Shapefiles, raster data
...
Data: process
Ingest in R (wbstats, readxl, ...)
Transform (filter, aggregate, calculate, ...) and reshape with dplyr and tidyr
Upload to Google sheets with googlesheets4
Story template
Create React App
React: components, state
Development server
Optimized builds
Template
Shared styling
Shared components, eg. scrollytelling
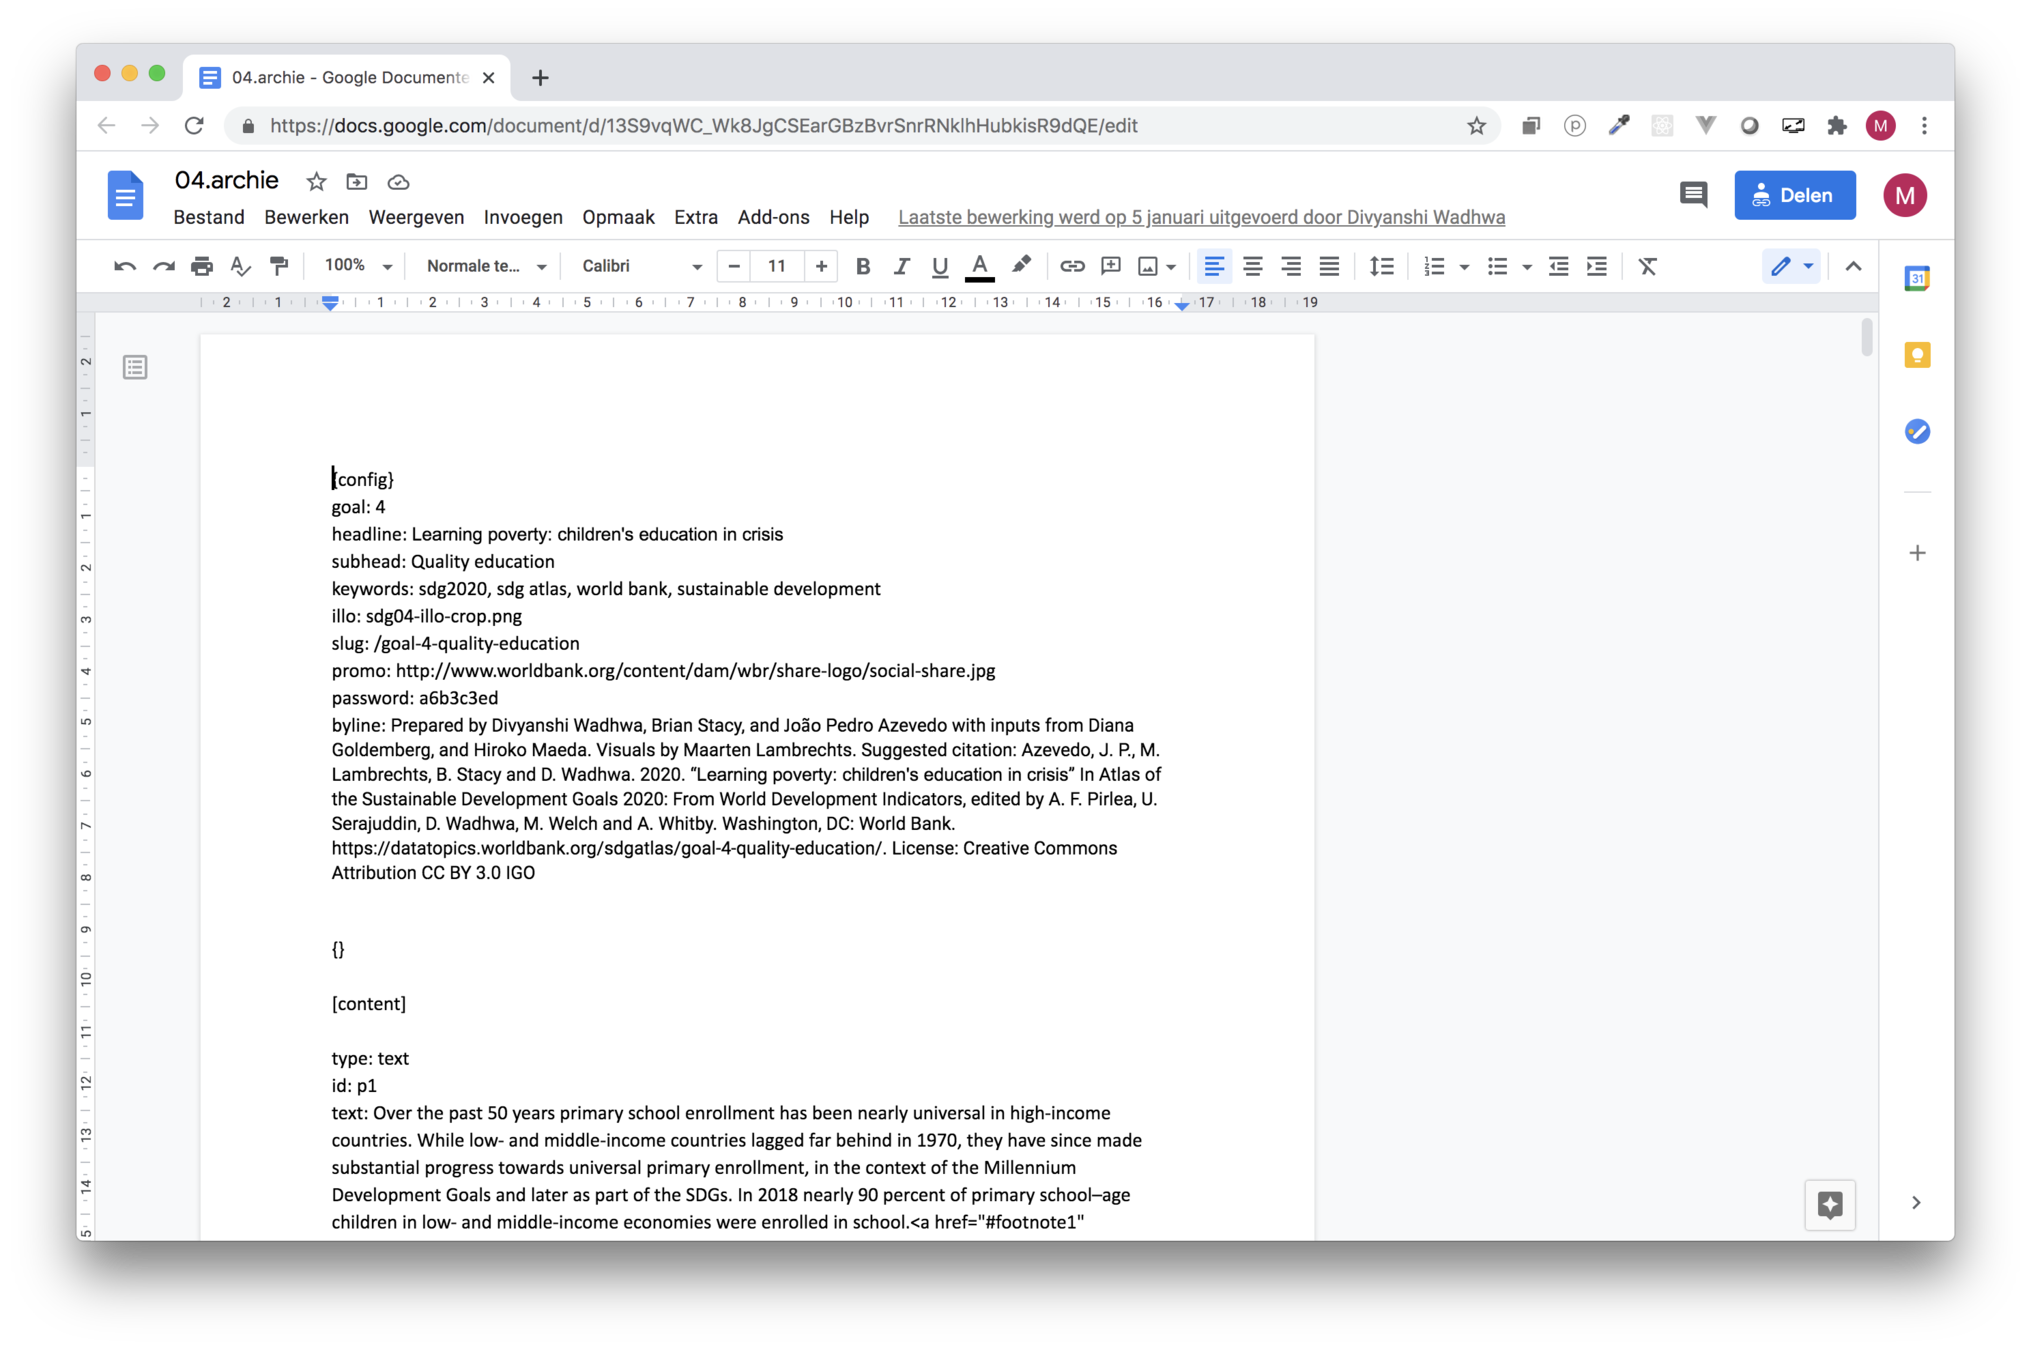
Fetching content
Content
Title Text
npm run data:fetch

Visualizations
<svg width={width} height={height}>
    <g className="bubbles-g">
        {countries.map((d) => {
            return (
                <circle
                  key={"bubble-" + d.Country}
                  cx={xScale(d.coosshare)}
                  cy={yScale(d.bmpshare)}
                  r={sizeScale(d.total)}
                  fill={colorScale(d.Region)}
                  stroke={
                    activeCountry === ""
                      ? highlightcountries.length === 0
                        ? "white"
                        : highlightcountries.includes(d.Country)
                        ? "black"
                        : "white"
                      : d.Country === activeCountry
                      ? "black"
                      : "white"
                  }
                  strokeWidth={...}
                  style={{ cursor: "pointer" }}
                  opacity={...}
                  onMouseOver={() => {//Show tooltip}}
                  onMouseLeave={() => {//Hide tooltip}}
                ></circle>
    </g>
</svg>
React & svg
D3.js: utility components
React utilities
Responsive graphics from Adobe Illustrator
Other tools
Video in SDG5 and SDG15
React-globe-gl in SDG7
QGIS in SDG9
Mapbox GL JS in SDG11
WebGL/REGL in SDG13
Building
Before launch
Password protected versions through Github pages
Build and deploy
Automated builds from Github repositories and Google Drive
