How fast is your website, really?
Macklin Hartley
https://macklin.me

Spoiler Alert
⬛ User-Centric Performance
⬛ Capture Metrics from End User Devices
⬛ Continuous Monitoring
Not in this Talk
❌ Web Performance Improvement

Page Load event
const start = Date.now();

window.addEventListener('load', () => {
  console.log({ load: Date.now() - start });
});
Performance Inspector

Navigation Timing API

https://www.w3.org/TR/navigation-timing-2/
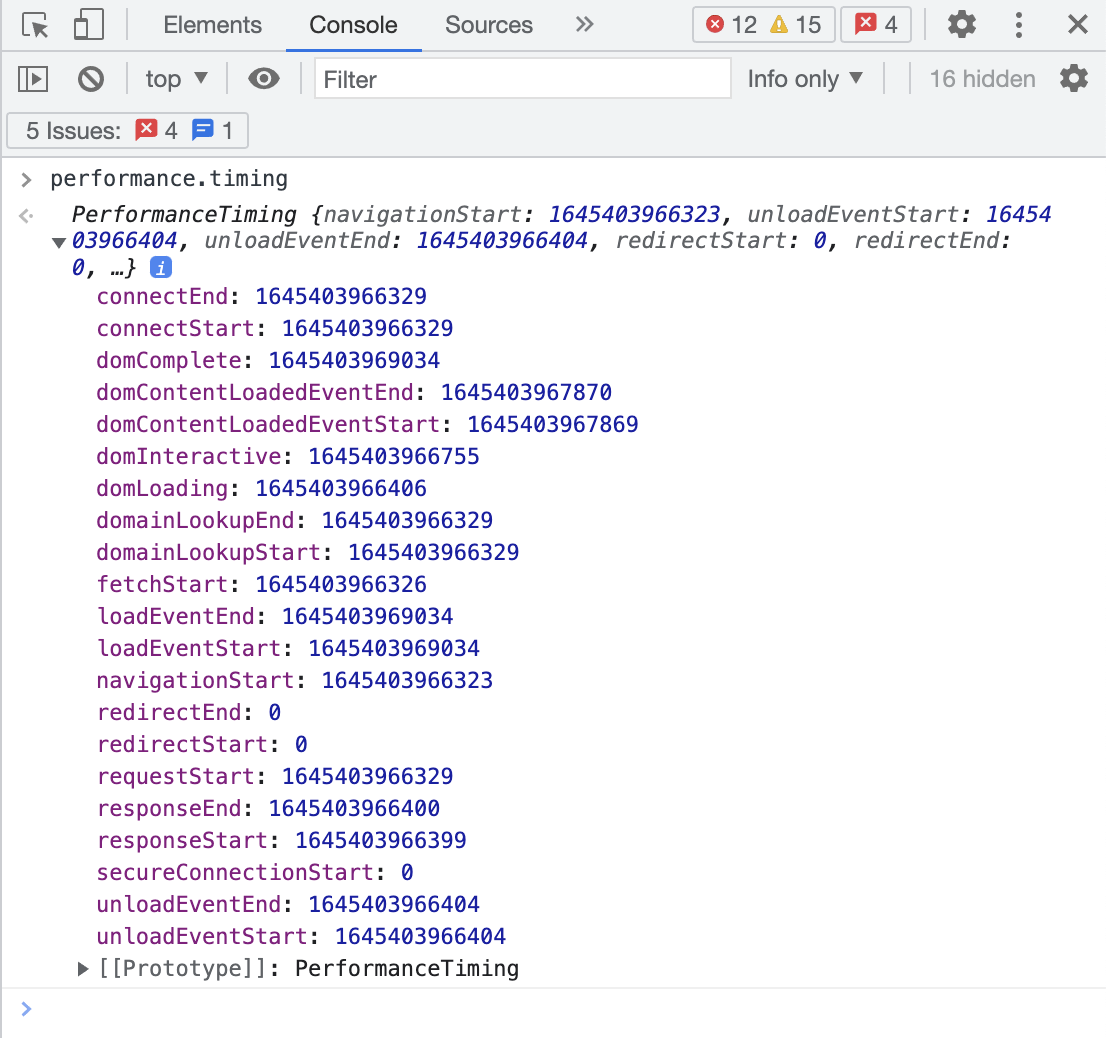
window.performance.timingAdobe
Airbnb Inc
Akamai Technologies
Alibaba Group
Apple, Inc.
Baidu, Inc.
BBC
Cloudflare
Fastly
Google LLC
Microsoft Corporation
Mozilla Foundation
Salesforce
Shopify
The New York Times
Wikimedia Foundation
W3C Web Performance Working Group
User Centric PerformancE
- Perceived Load Speed
- Load Responsiveness
- Runtime Responsiveness
- Visual stability
- Smoothness
https://web.dev/user-centric-performance-metrics/
User-Centric PerformancE
https://web.dev/user-centric-performance-metrics/
TTFB
Time to First Byte
FCP
First Contentful Paint
LCP
Last Contentful Paint
FID
First Input Delay
INP
Interaction to Next Paint
CLS
Cumulative Layout Shift
https://developer.mozilla.org/en-US/docs/Glossary/time_to_first_byte
the time between the browser requesting a page and when it receives the first byte of information from the server.
TTFB
Time to First Byte
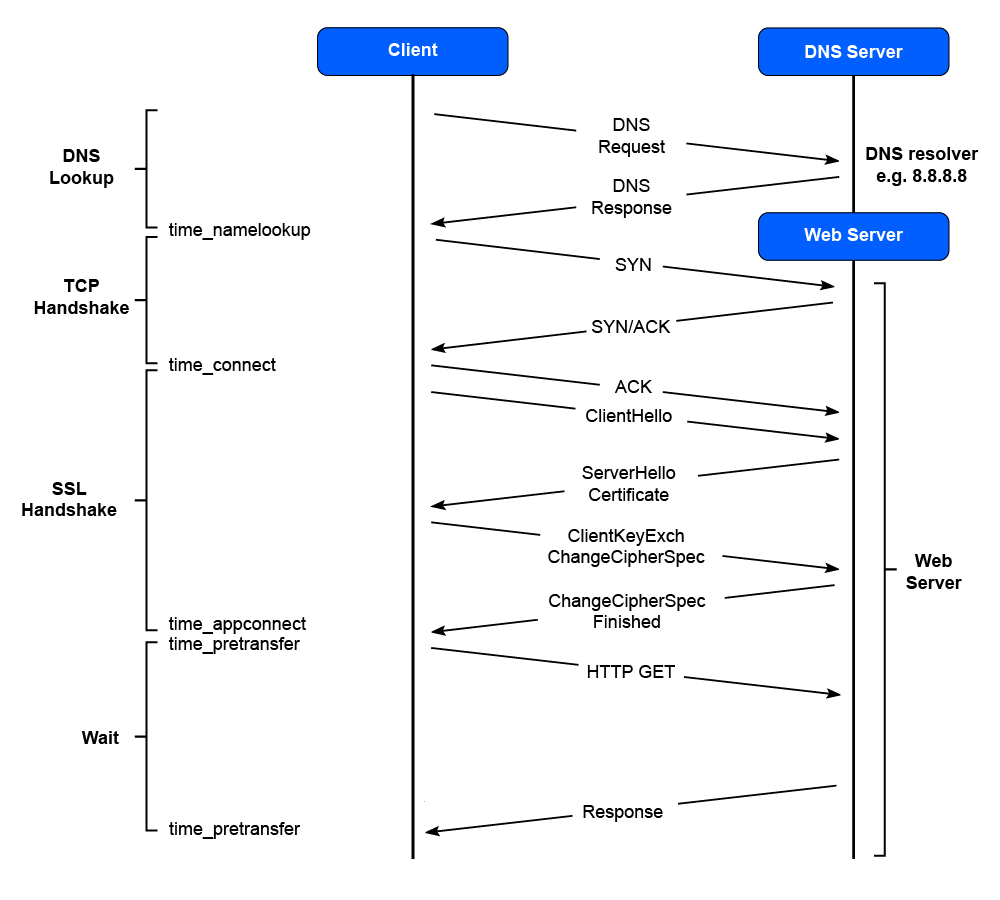
https://www.mindspun.com/blog/time-to-first-byte-ttfb/
TTFB
Time to First Byte
GOOD
POOR
NEEDS
IMPROVEMENT
800ms
1.8s
https://web.dev/ttfb/
TTFB
Time to First Byte
https://web.dev/fcp/
the time from when the page starts loading to when any part of the page's content is rendered on the screen...
FCP
First Contentful Paint
https://macklin.me/7-useful-tools-for-monitoring-web-performance-user-experience

FCP
First Contentful Paint
GOOD
POOR
NEEDS
IMPROVEMENT
1.8 sec
3.0 sec
https://web.dev/fcp/
FCP
First Contentful Paint
https://calibreapp.com/blog/largest-contentful-paint
...tracks how many seconds it takes for your page’s most data-intensive, above-the-fold element to load.
LCP
Largest Contentful Paint
https://macklin.me/7-useful-tools-for-monitoring-web-performance-user-experience

LCP
Largest Contentful Paint
GOOD
POOR
NEEDS
IMPROVEMENT
2.5 sec
4.0 sec
https://web.dev/lcp/
LCP
Largest Contentful Paint
https://web.dev/fid/
the time from when a user first interacts with a page[...] to the time when the browser is actually able to begin processing event handlers...
FID
First Input Delay
https://requestmetrics.com/web-performance/first-input-delay
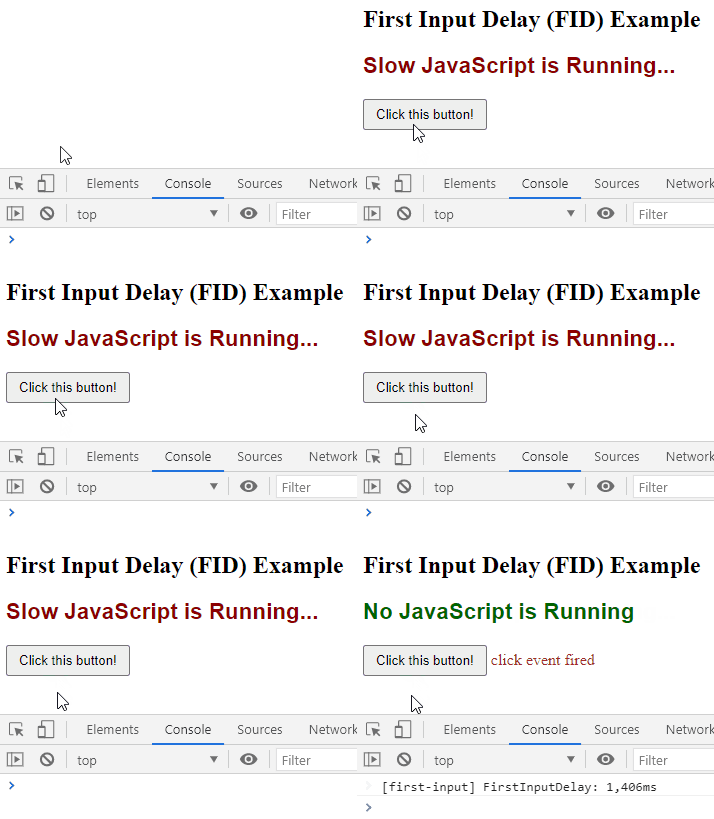
FID
First Input Delay
GOOD
POOR
NEEDS
IMPROVEMENT
100ms
300ms
https://web.dev/fid/
FID
First Input Delay
https://web.dev/inp/
...represents a page's overall responsiveness by measuring all click, tap, and keyboard interactions made with a page.
INP
Interaction to Next Paint
https://web.dev/inp/

INP
Interaction to Next Paint
GOOD
POOR
NEEDS
IMPROVEMENT
200ms
500ms
https://web.dev/inp/
INP
Interaction to Next Paint
https://web.dev/cls/
[a calculated score] for every unexpected layout shift that occurs during the entire lifespan of a page...
CLS
Cumulative Layout Shift
https://macklin.me/7-useful-tools-for-monitoring-web-performance-user-experience

CLS
Cumulative Layout Shift
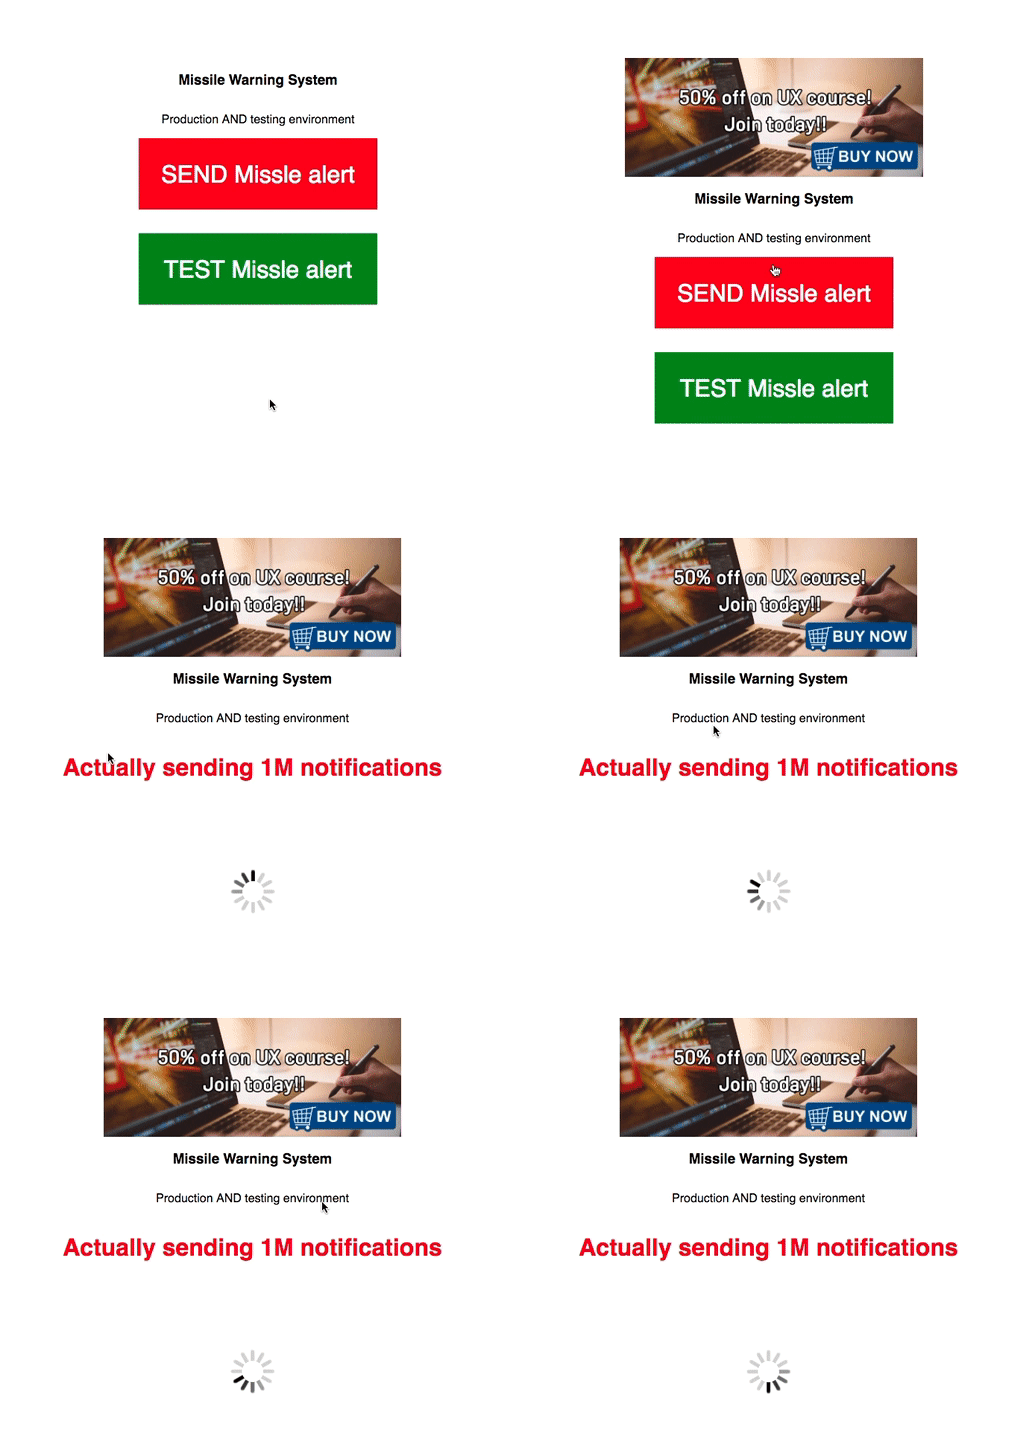
CLS
Cumulative Layout Shift
GOOD
POOR
NEEDS
IMPROVEMENT
0.1
0.25
https://web.dev/cls/
CLS
Cumulative Layout Shift
Core Web Vitals
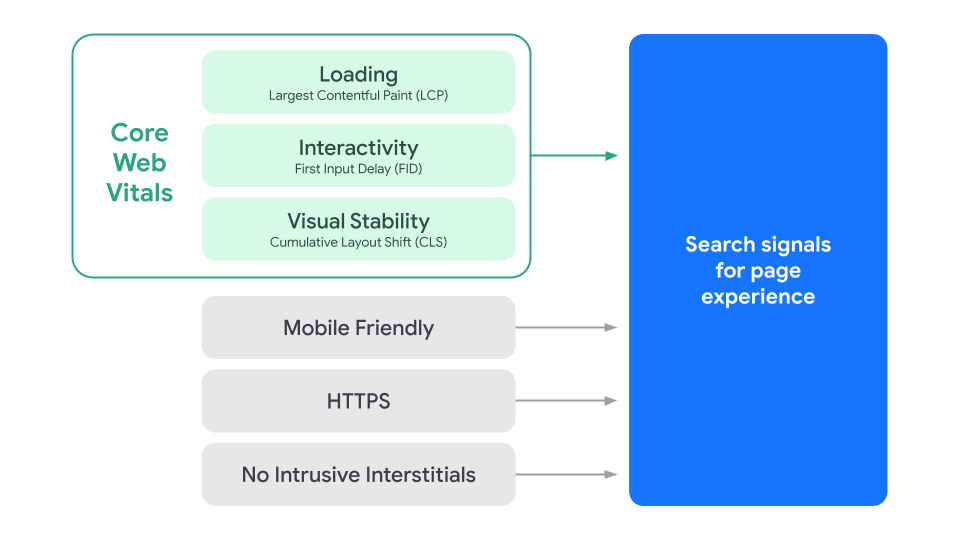
https://developers.google.com/search/blog/2020/11/timing-for-page-experience
Atomicity
TTFB ≈ 290ms
FCP ≈ 500ms
LCP ≈ 1.625 sec

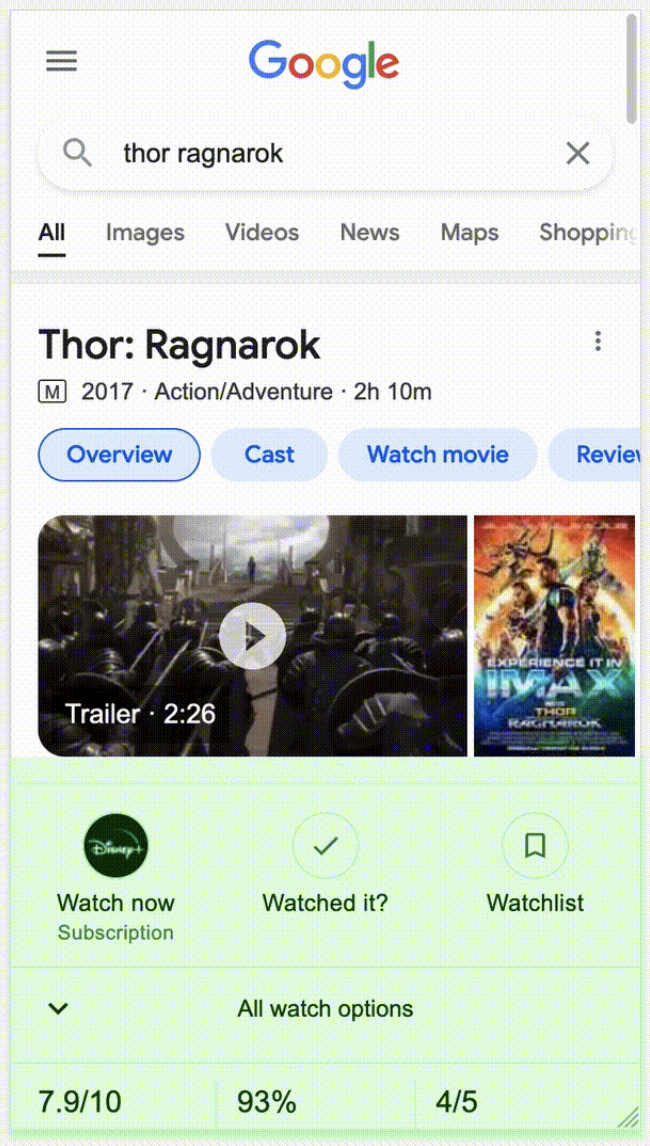

https://csswizardry.com/2022/08/measure-what-you-impact-not-what-you-influence/
https://web.dev/vodafone/

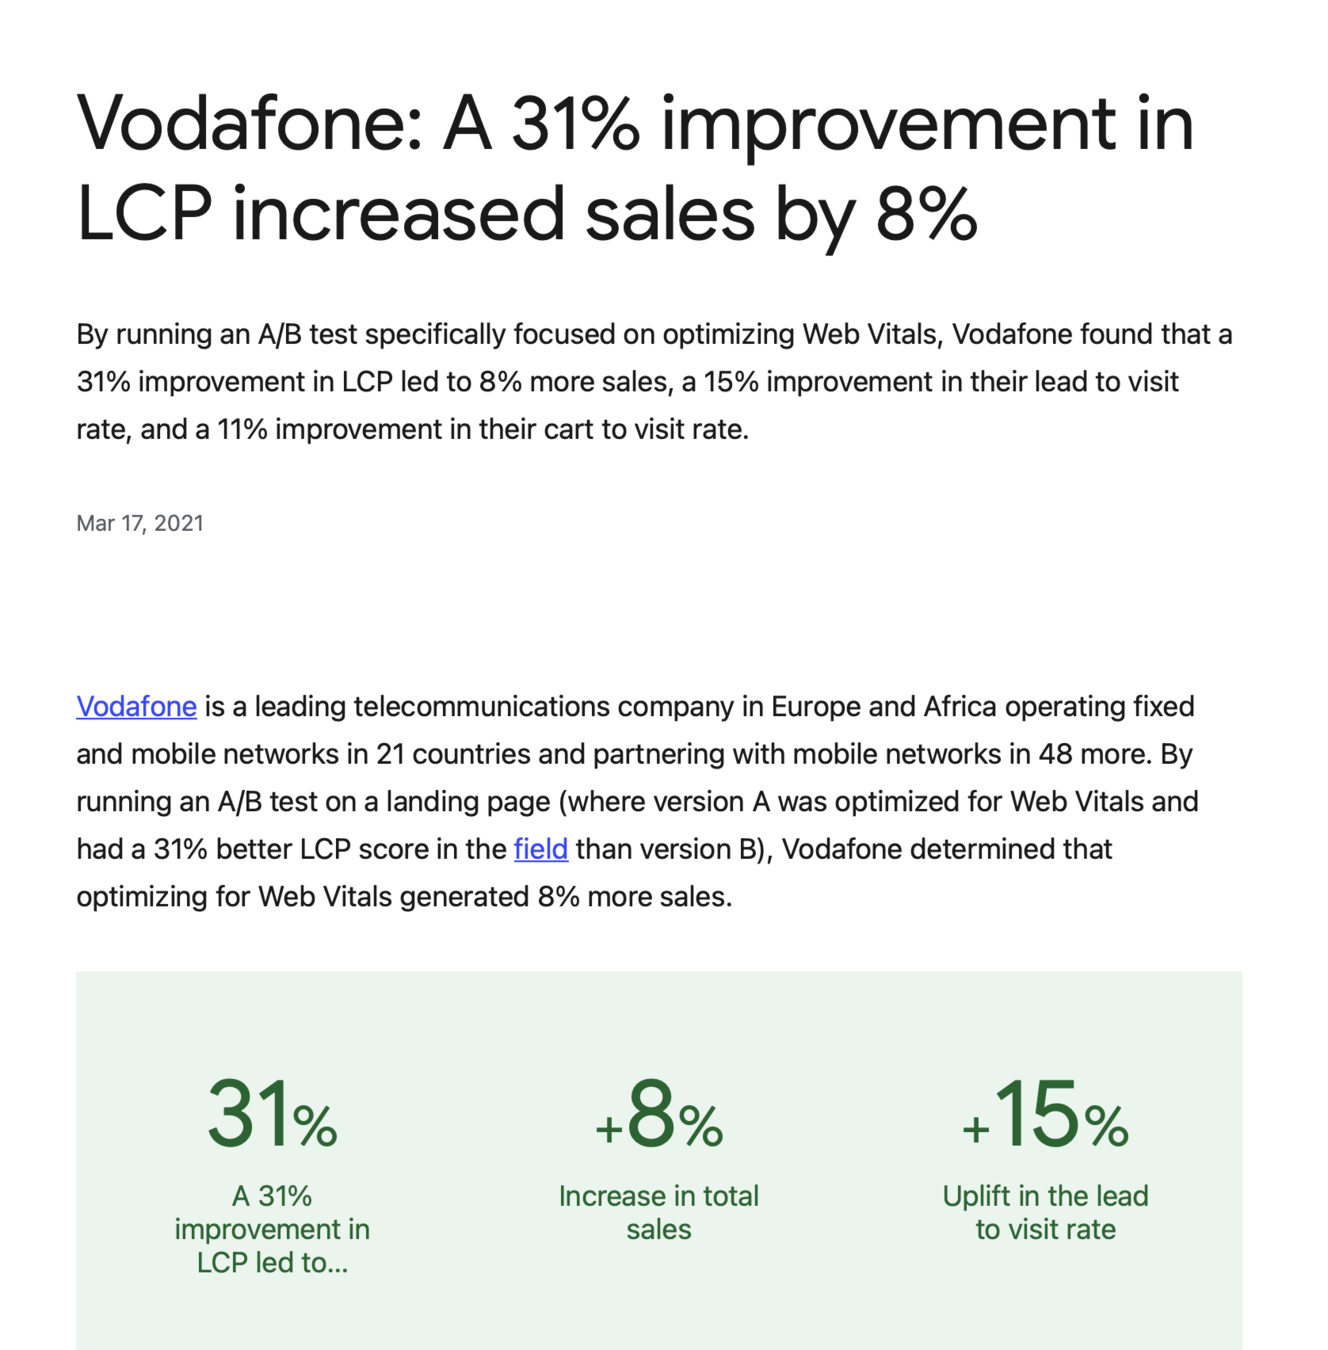
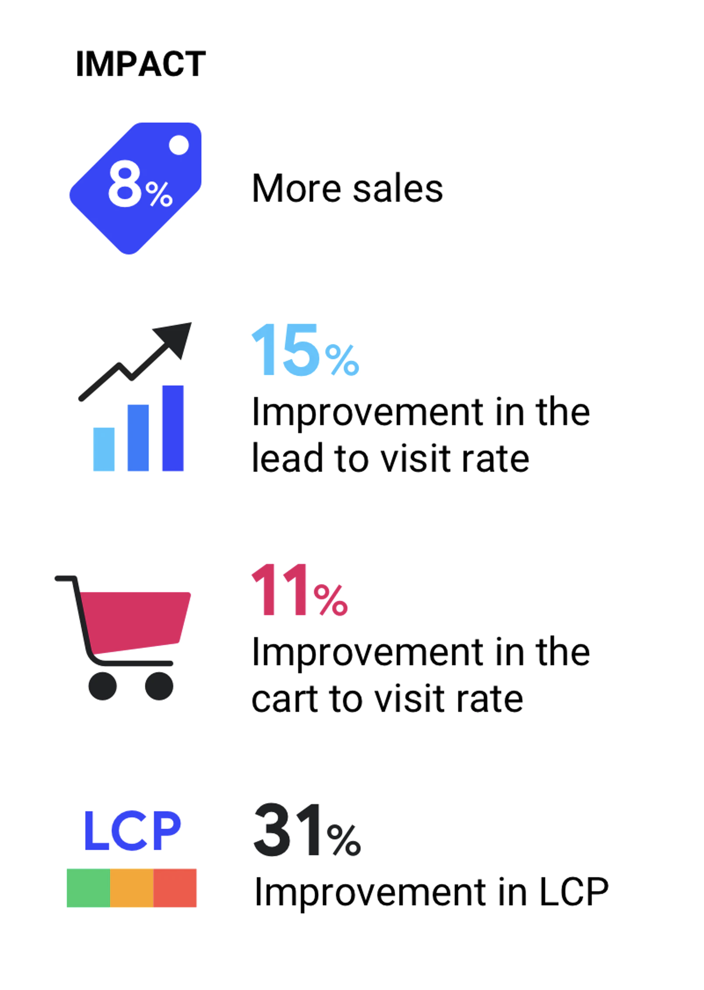
Vodafone Case Study
Goals
✅ User-Centric Performance
⬛ Capture Metrics from End User Devices
⬛ Continuous Monitoring
Ad-hoc Testing
Synthetic Monitoring
Real User Monitoring (RUM)
Capture Methods
Ad-hoc Testing

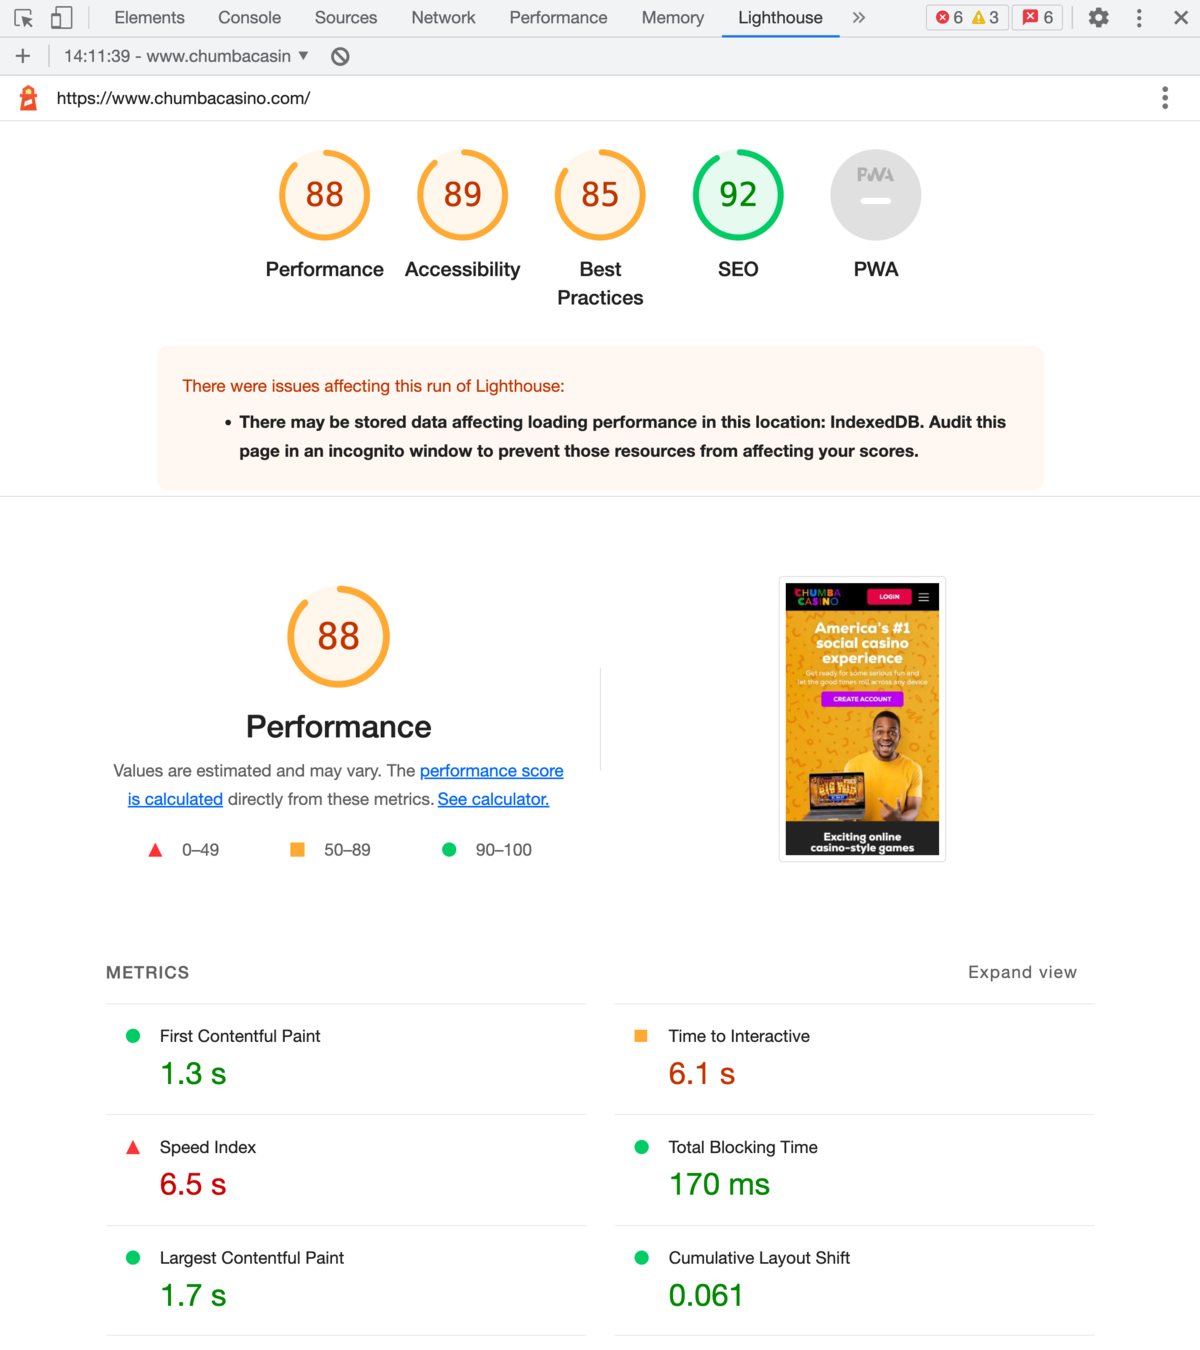
Lighthouse for
Google Chrome
Ad-hoc Testing
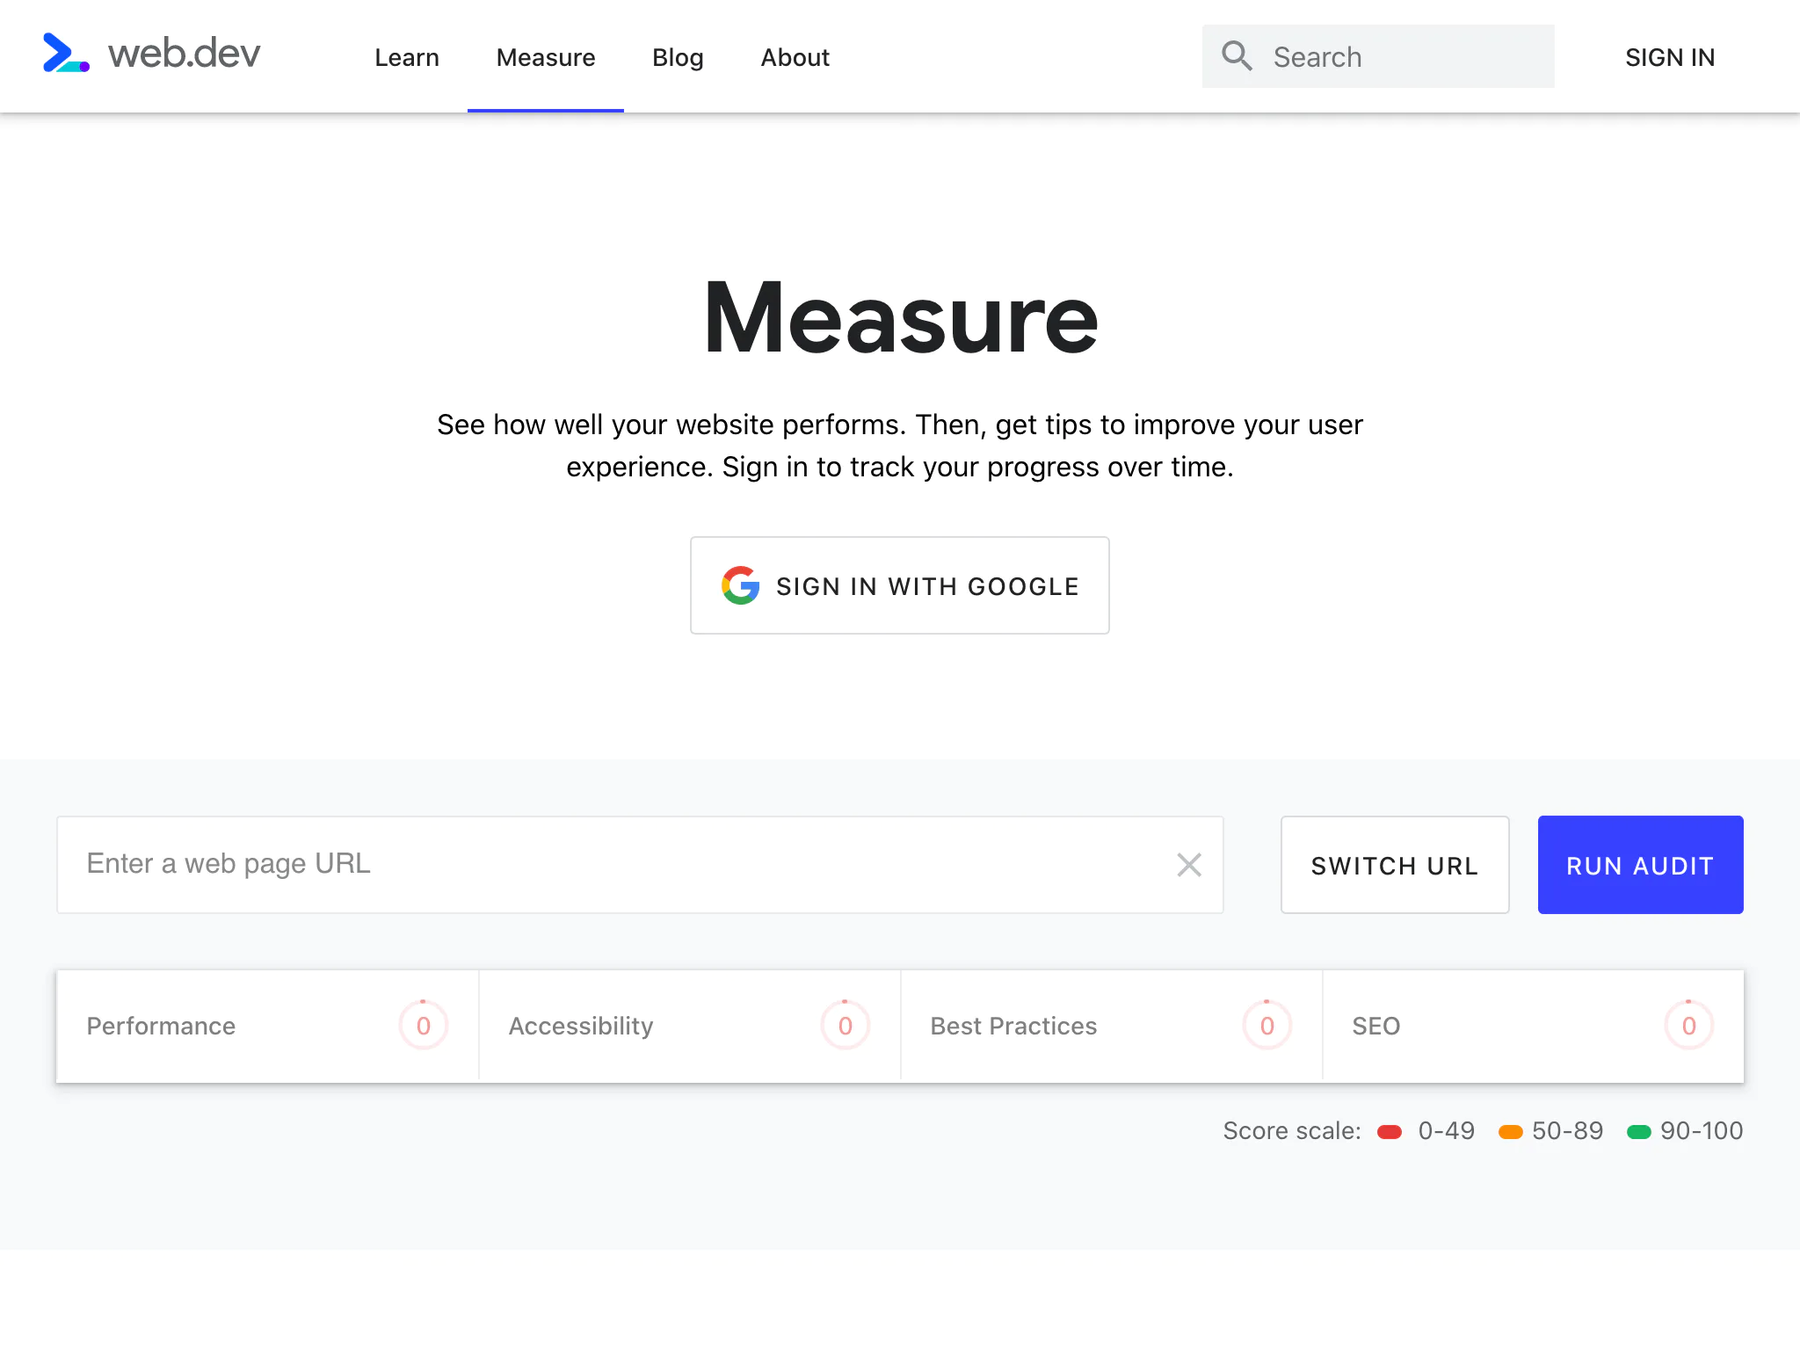

web.dev/measure
Ad-hoc Testing
👍 Free, no setup required
👎 Once-off, manual tests only
👎 Unlikely to represent real world traffic
Synthetic Monitoring

Calibre
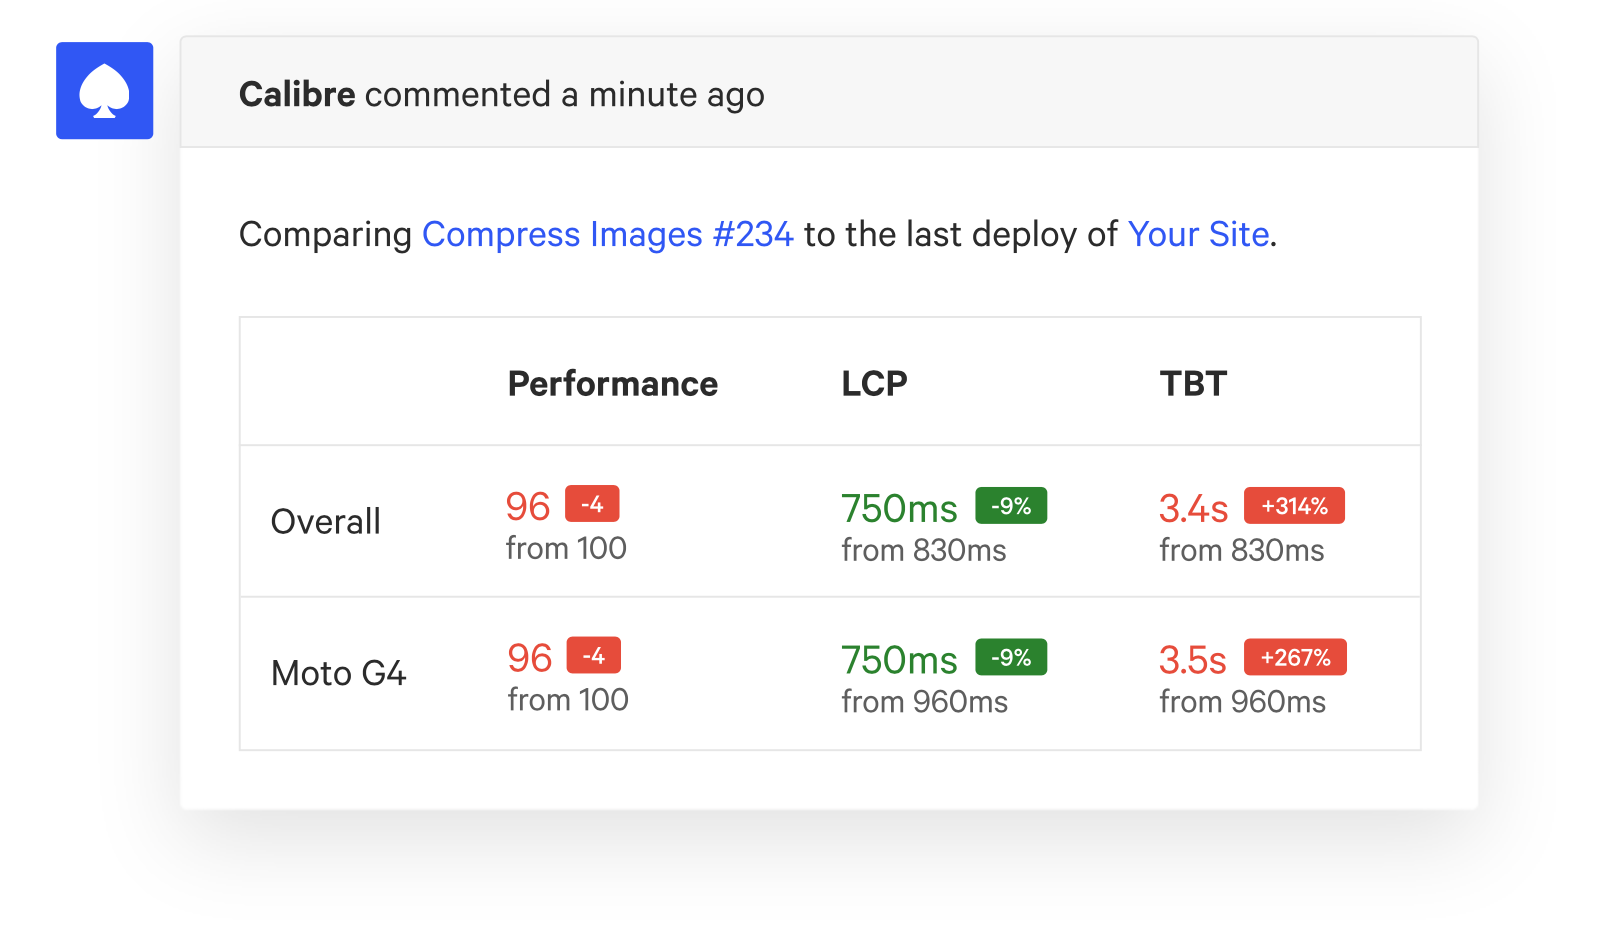
https://calibreapp.com/features/pull-request-reviews
Calibre
👍 CI/CD + scheduled automation
👍 Monitor change over time
👎 Not free, although competitively priced
👎 Still not representative of real world traffic
Global Mobile Market Share
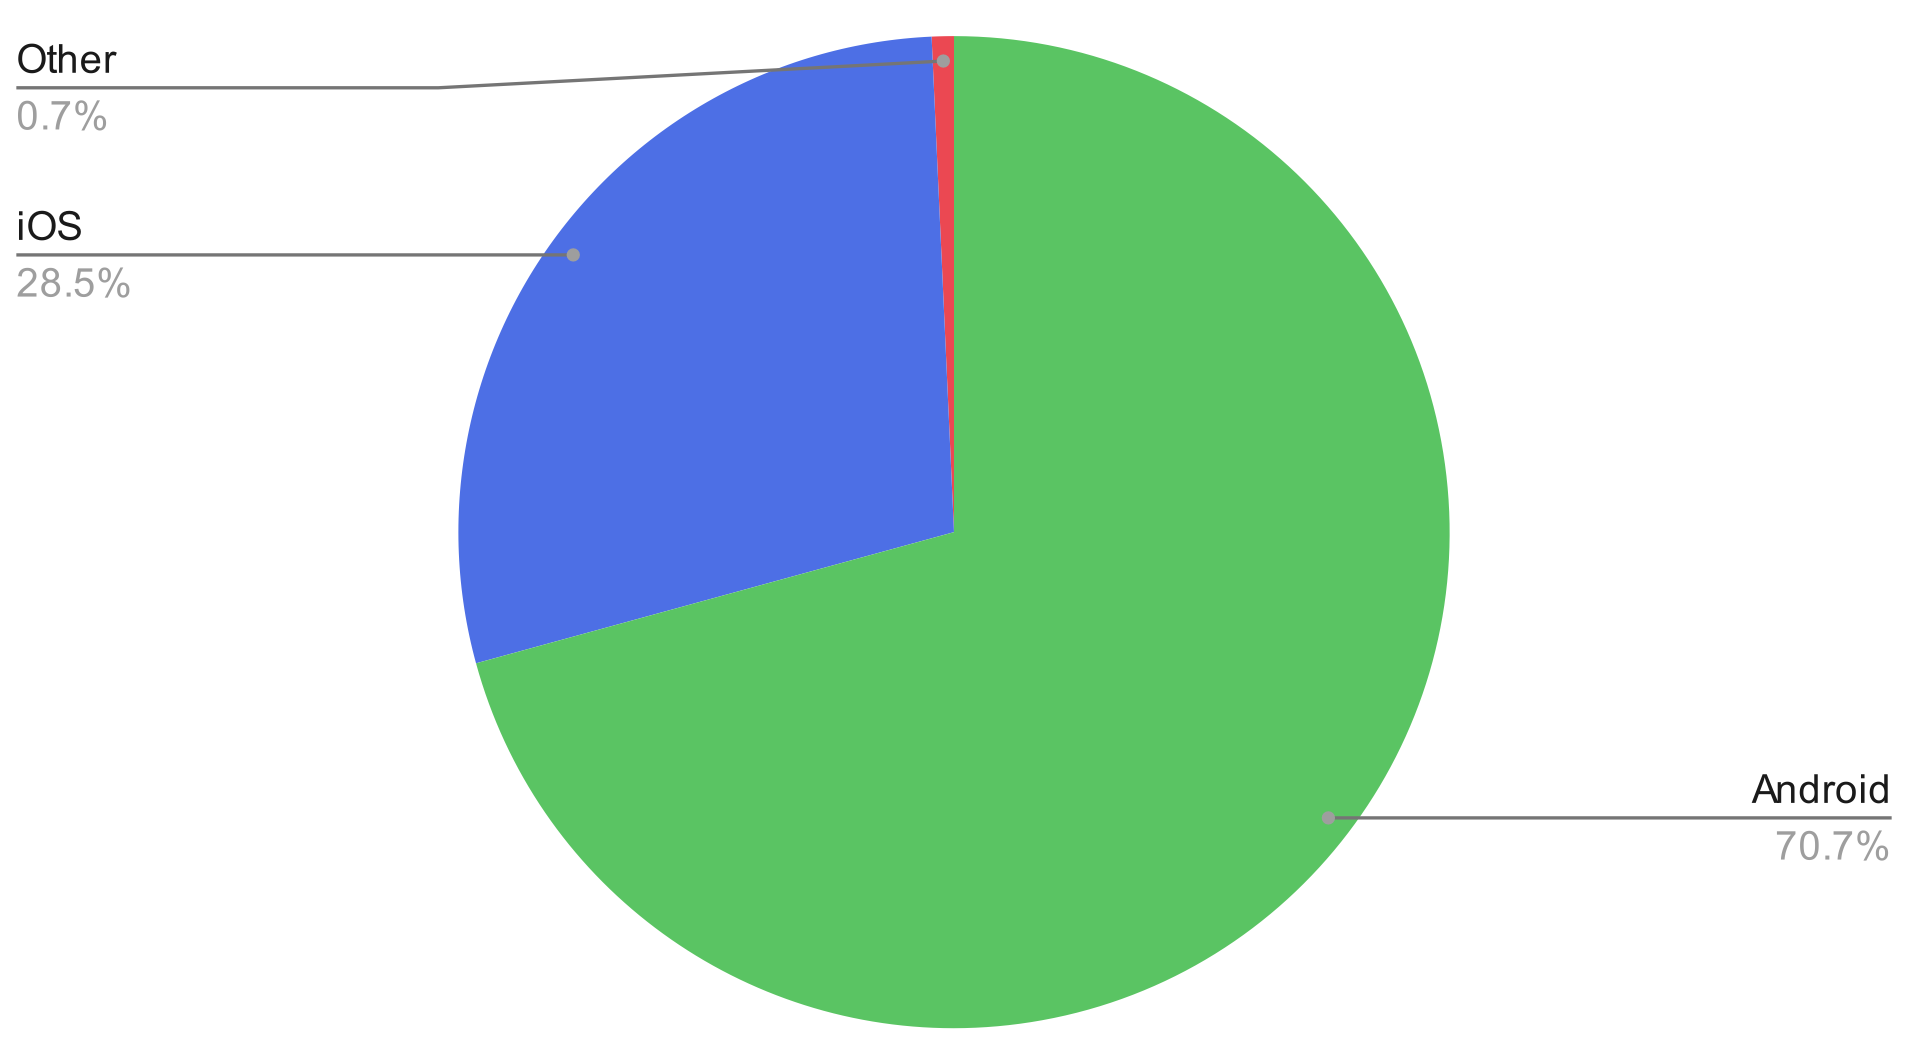
https://engineering.linecorp.com/en/blog/the-baseline-for-web-development-in-2022
Low End vs High End Performance
Low End Device
Motorola Moto E30
800%
https://infrequently.org/2022/12/performance-baseline-2023/
High End Device
Apple iPhone 14 Pro Max
https://infrequently.org/2022/12/performance-baseline-2023/
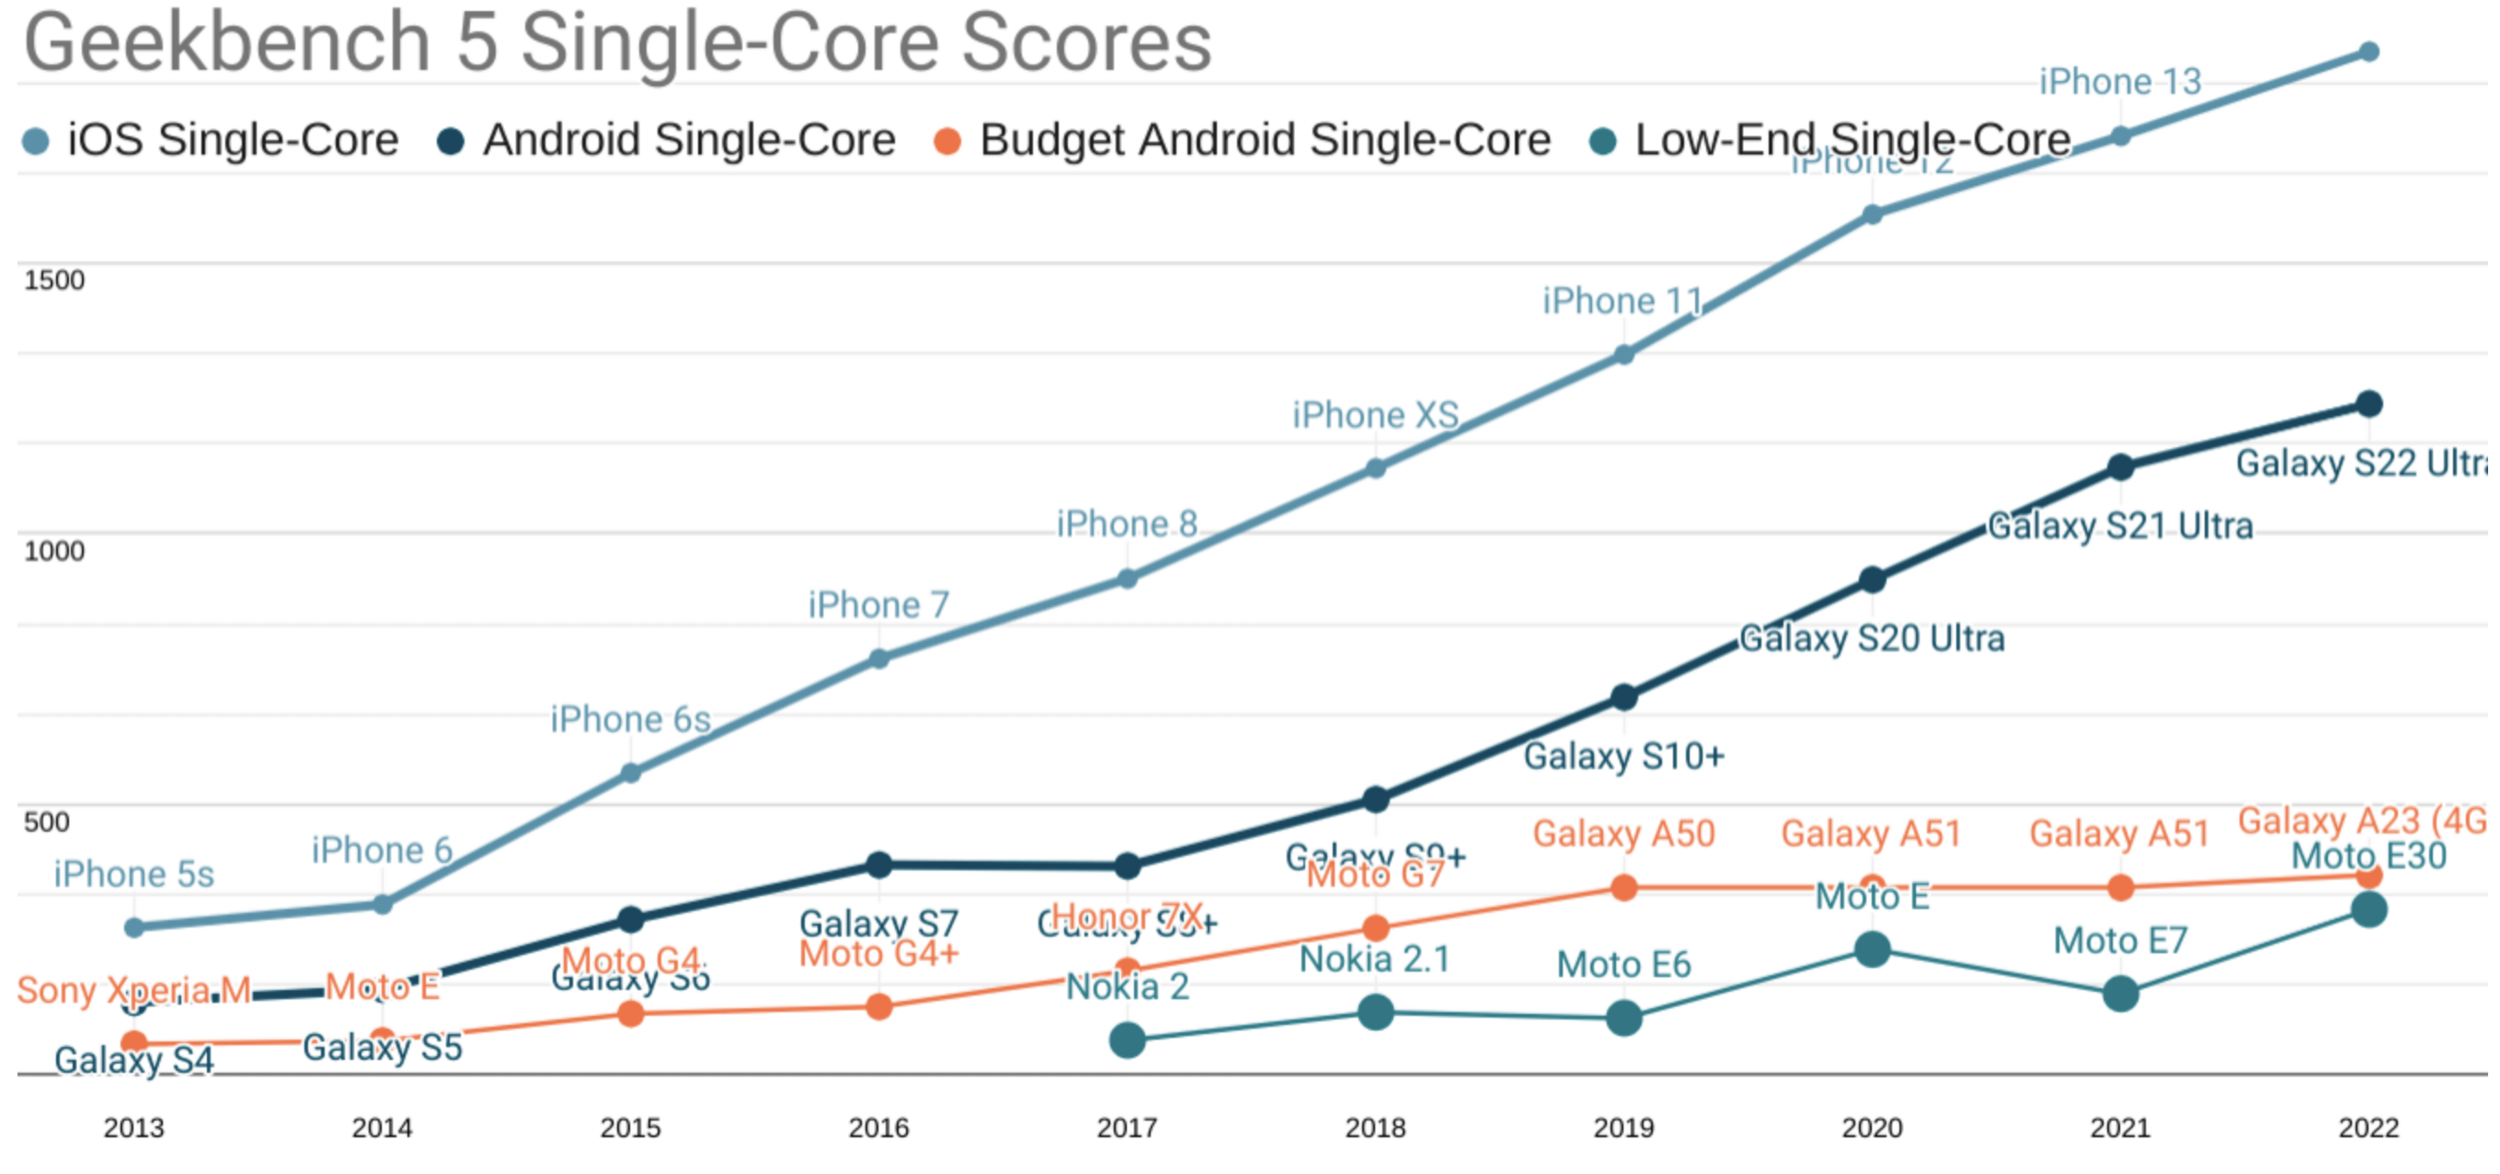
Geekbench 5 Single-core
https://infrequently.org/2022/12/performance-baseline-2023/
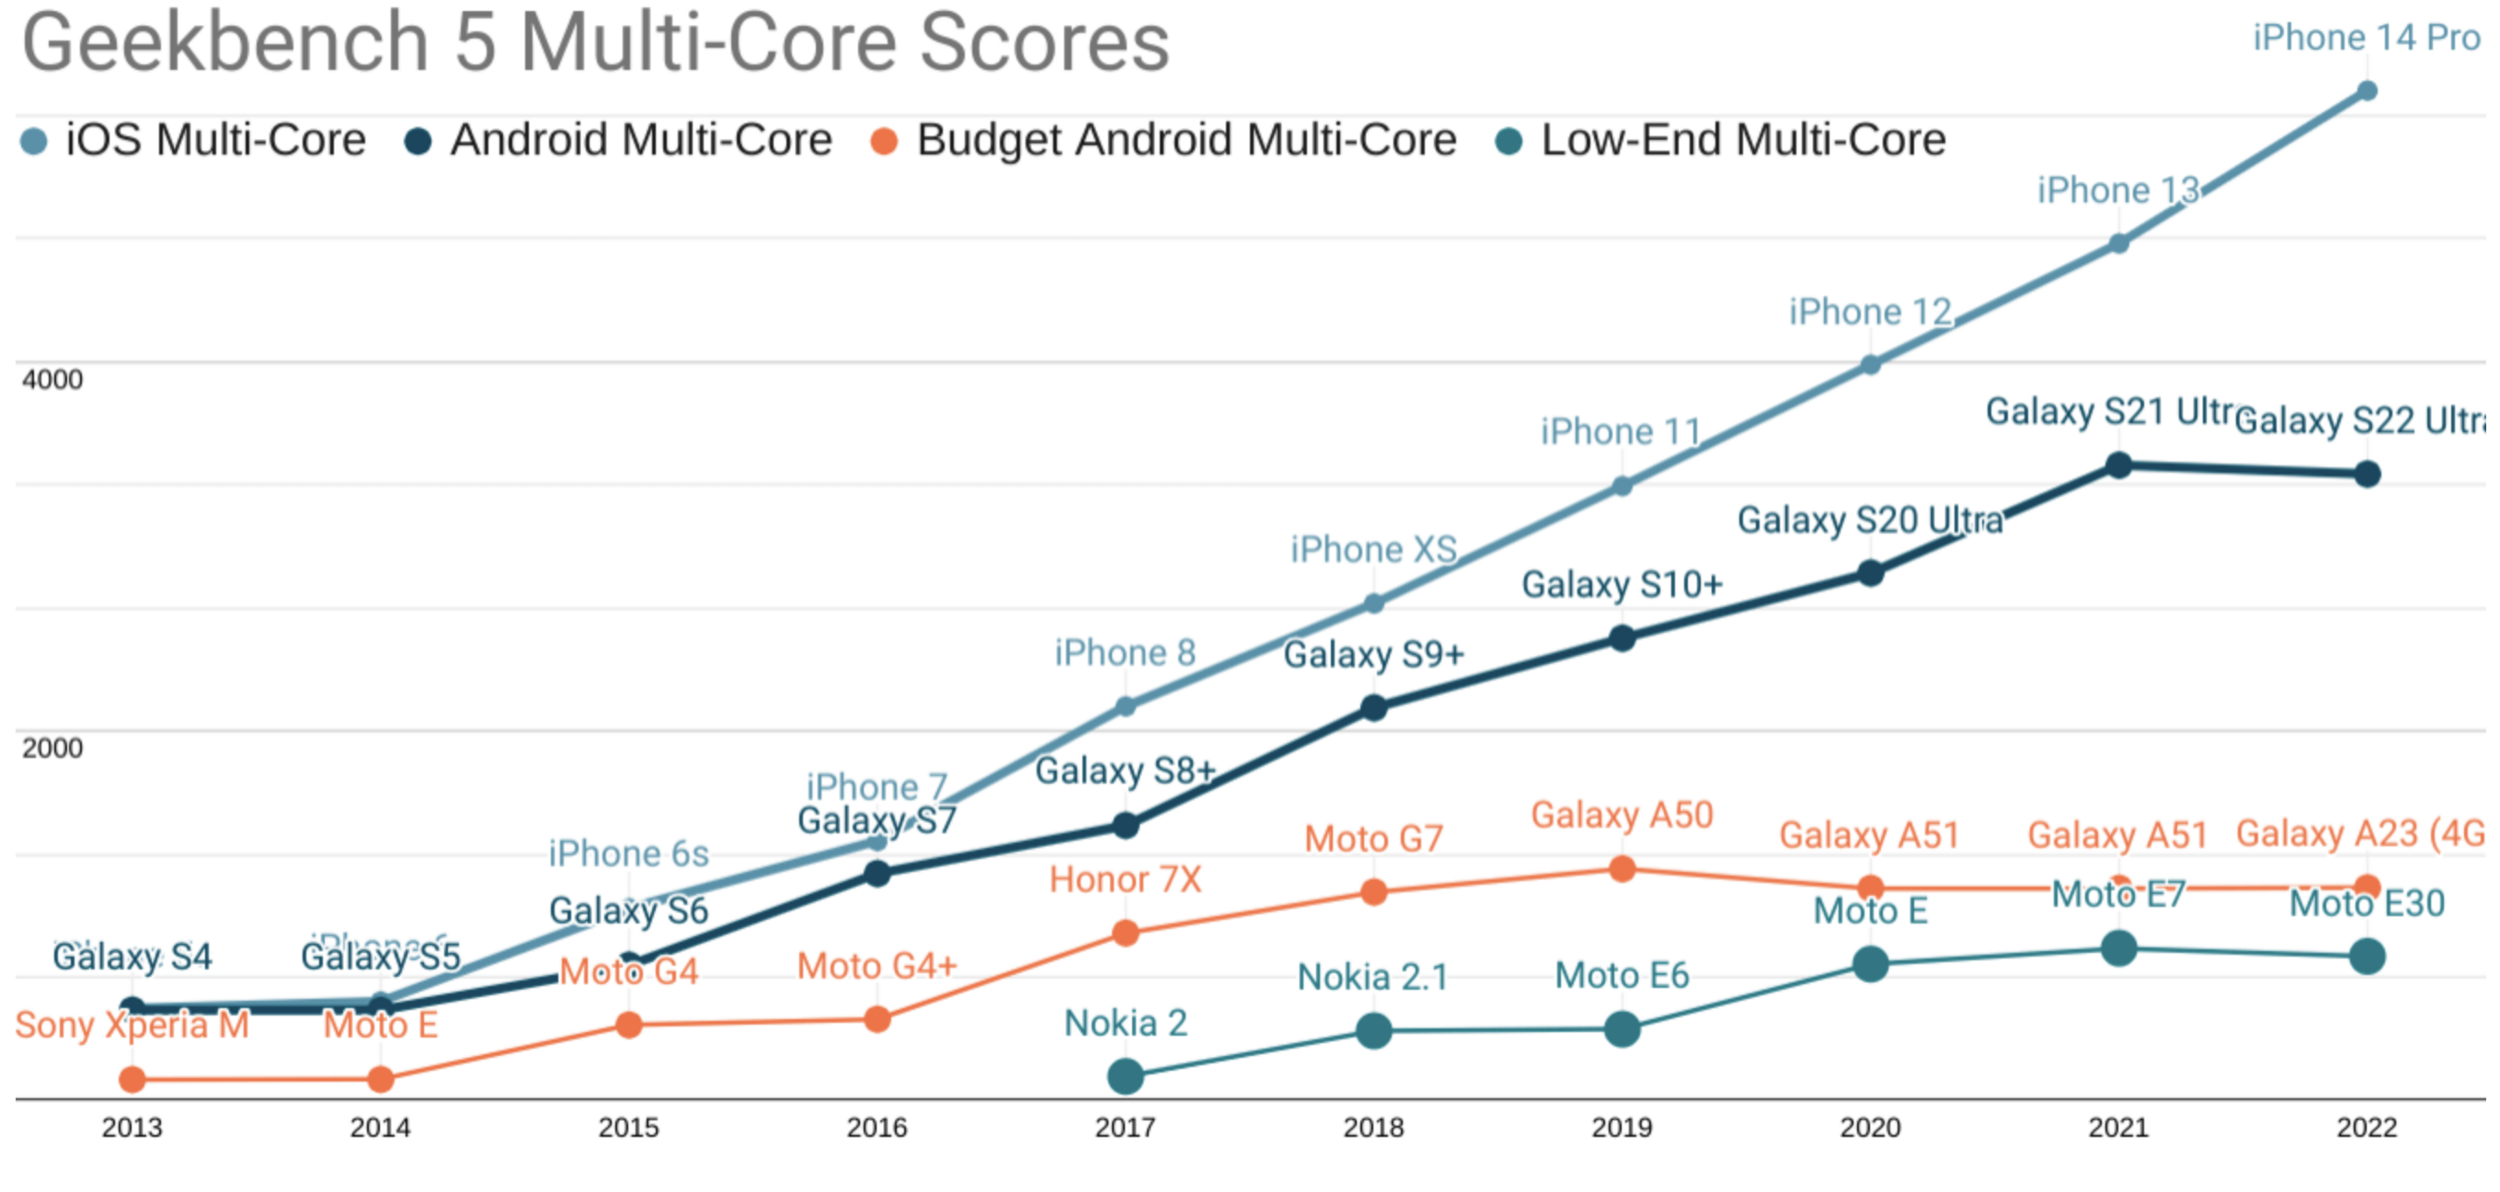
Geekbench 5 Multi-core
The Performance INequality Gap
# of devices
performance
50th percentile
Apple iPhone 11 (2019)
Samsung Galaxy S20 Ultra (2021)
The Performance INequality Gap
# of devices
performance
75th percentile
Motorola Moto E30 (2023)
Samsung Galaxy A23 (2023)
Apple iPhone 6 (2015)
Samsung Galaxy S6 (2015)
The Performance INequality Gap
# of devices
performance
25% of people receive
a poorer experience
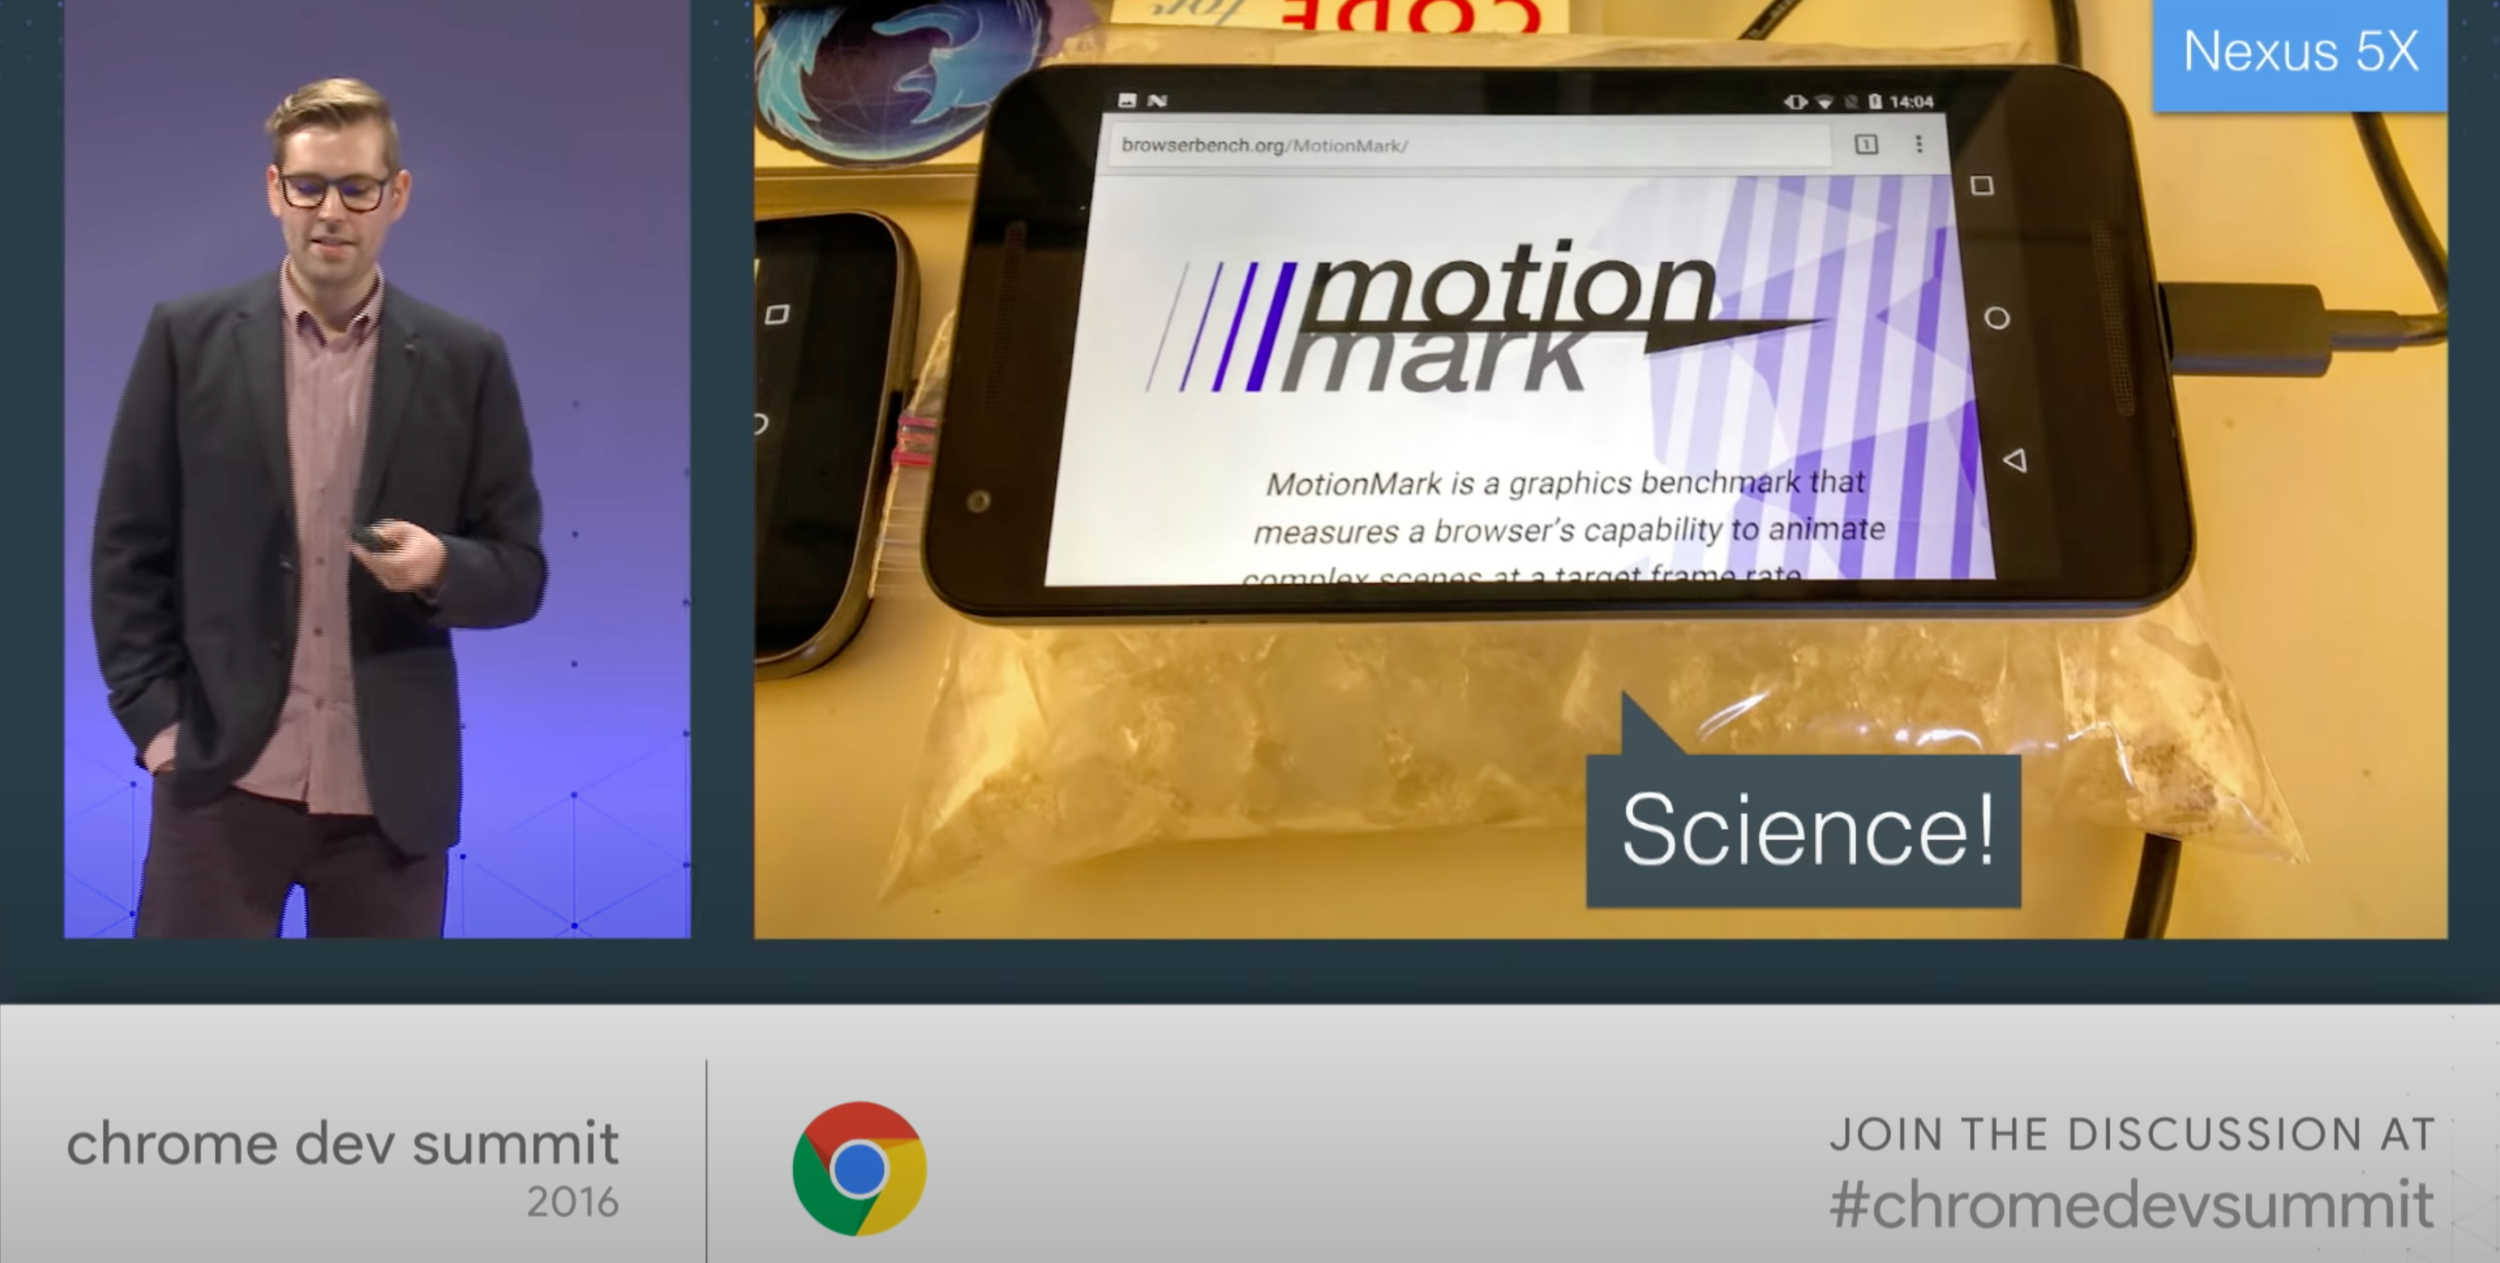
Performance is Situational
Alex Russel - Progressive Performance (Chrome Dev Summit 2016)
https://www.youtube.com/watch?v=4bZvq3nodf4
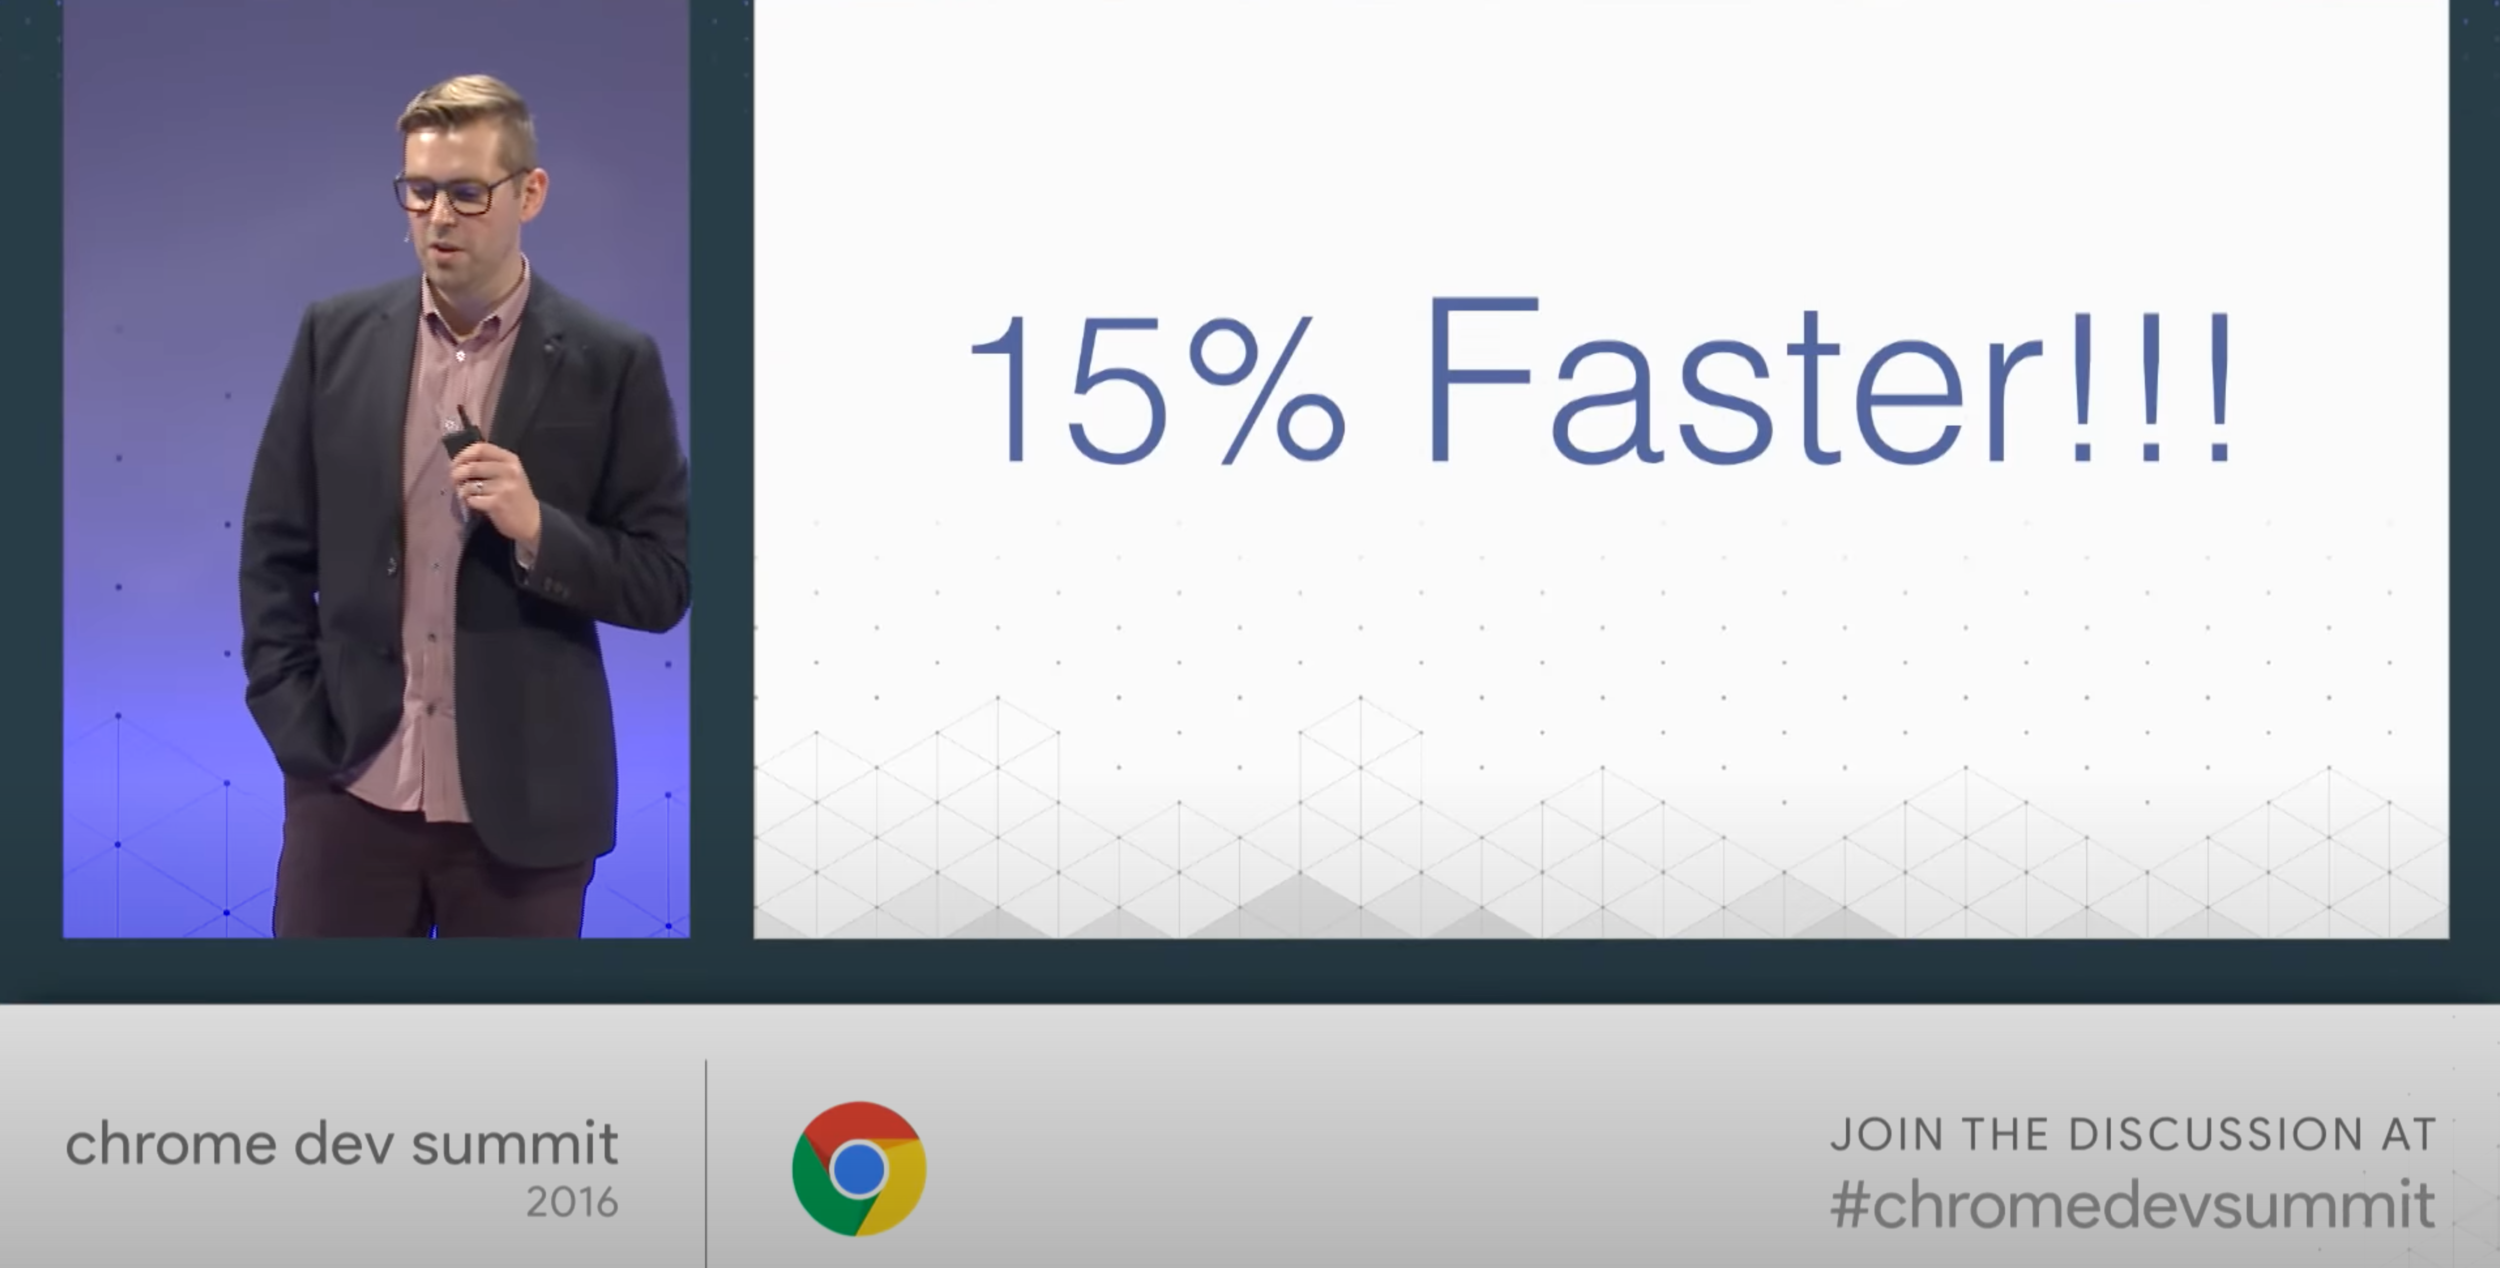
Network Budgets
https://www.speedtest.net/global-index/united-states
3G
4G
~1 second
~2.3 seconds
4 second budget
5G
less than 1 second
4g is widely available
https://engineering.linecorp.com/en/blog/the-baseline-for-web-development-in-2022
86.8%

Median Mobile Network Speed
46.26 Mb/s
Reno, NV
181.74 Mb/s
Glendale, AZ
390%
https://www.speedtest.net/global-index
Median Mobile Network Latency
https://www.speedtest.net/global-index
101 ms
Anchorage, AK
39 ms
Plano, TX
35%
Real User Monitoring (RUM)
Real User Monitoring (RUM)
Capturing performance metrics directly from devices in the real world to observe differences in functionality, reliability, and responsiveness.
Chrome User Experience (CRUX) Report
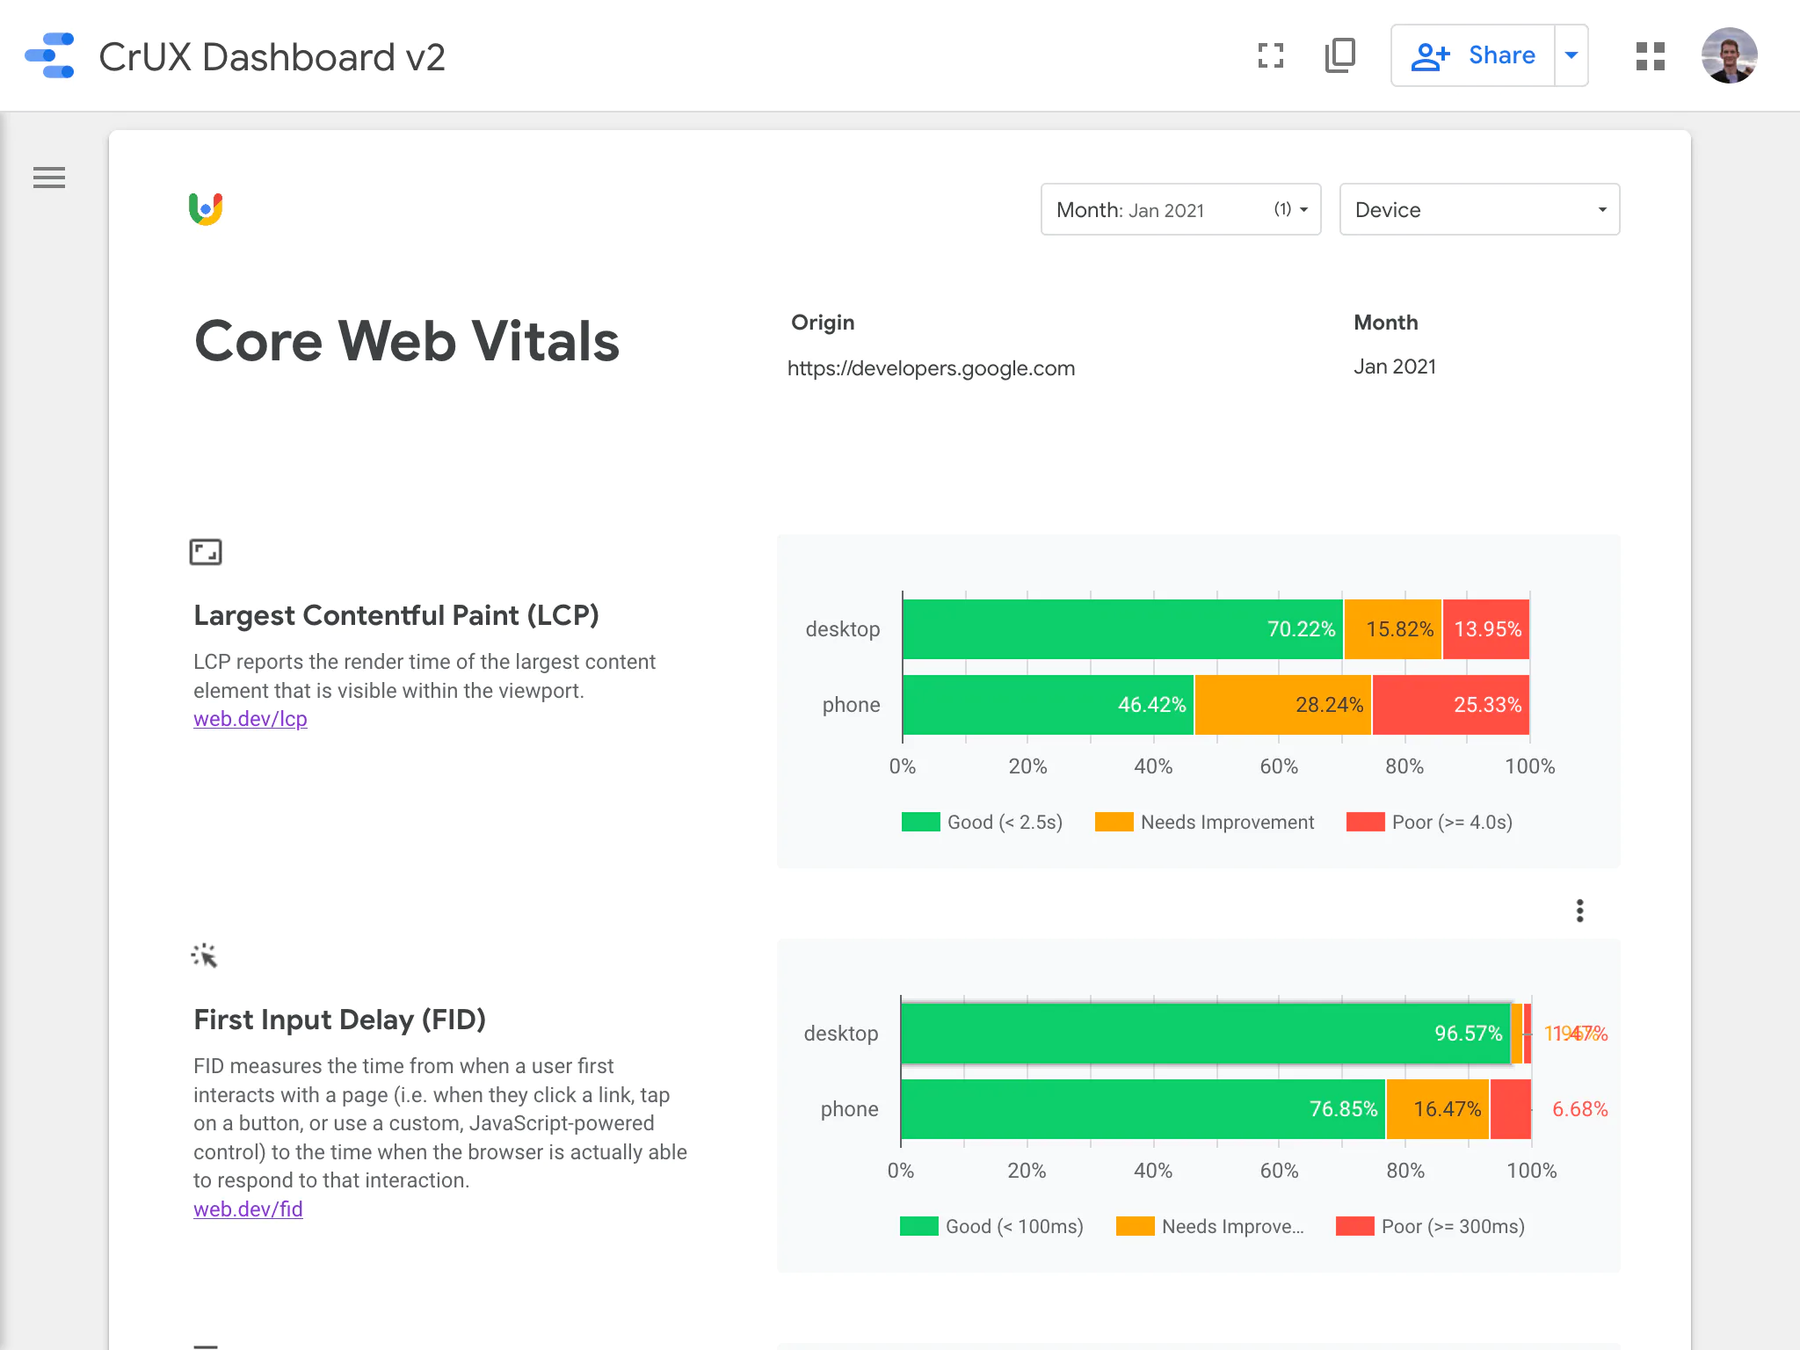
https://developers.google.com/web/tools/chrome-user-experience-report
👍 Free, publicly available data
👎 Frustrating setup process
👎 Delayed, monthly aggregation
👎 Google Chrome devices only
Chrome User Experience (CRUX) Report
Core Web Vitals Checker
https://calibreapp.com/tools/core-web-vitals-checker
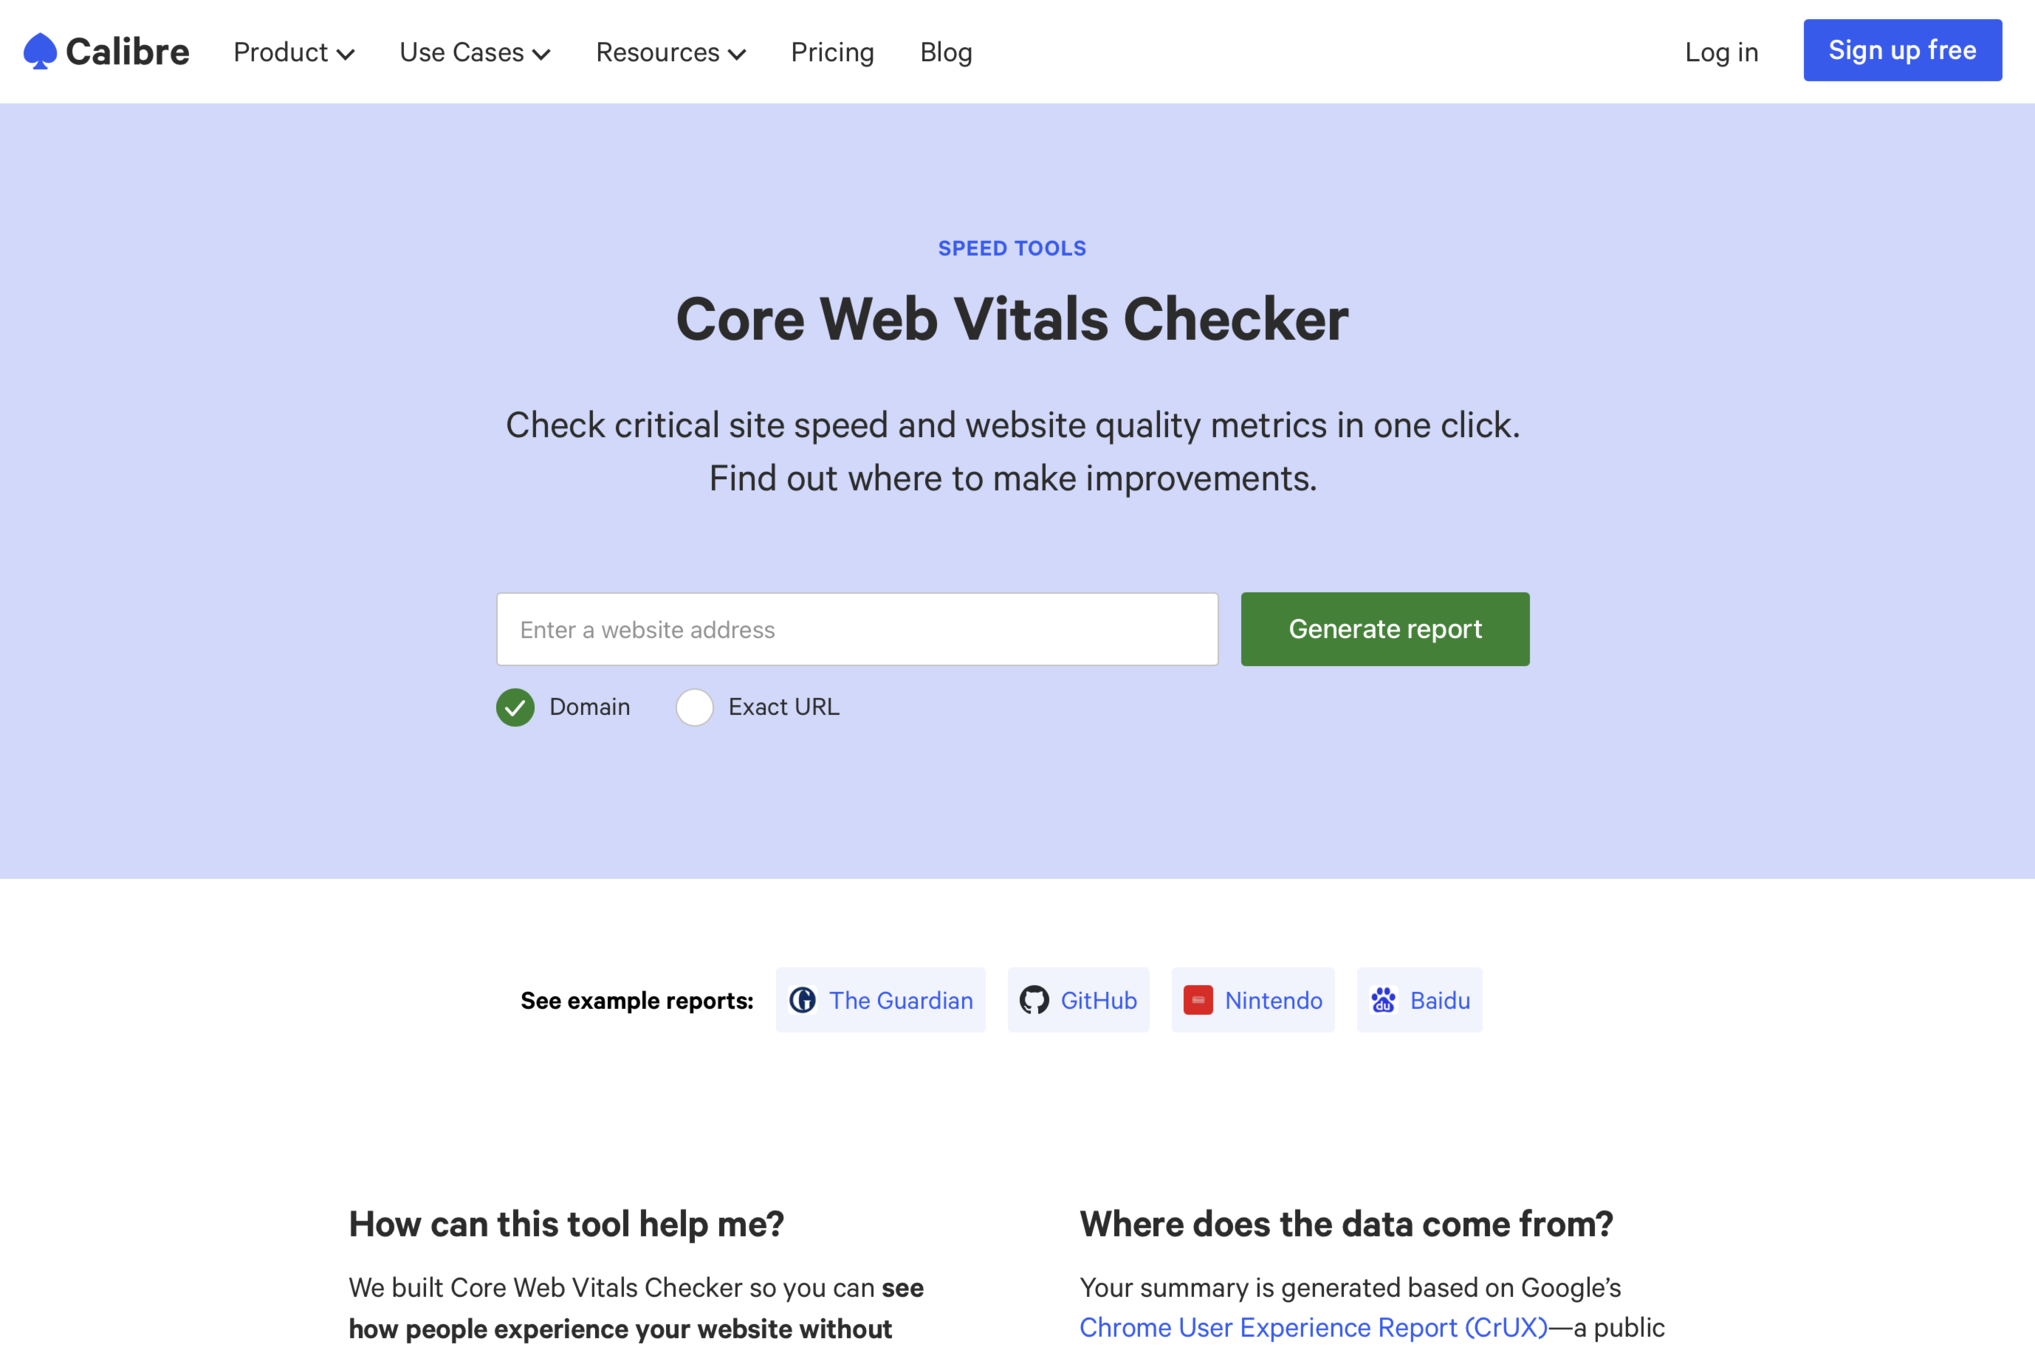
https://calibreapp.com/tools/core-web-vitals-checker
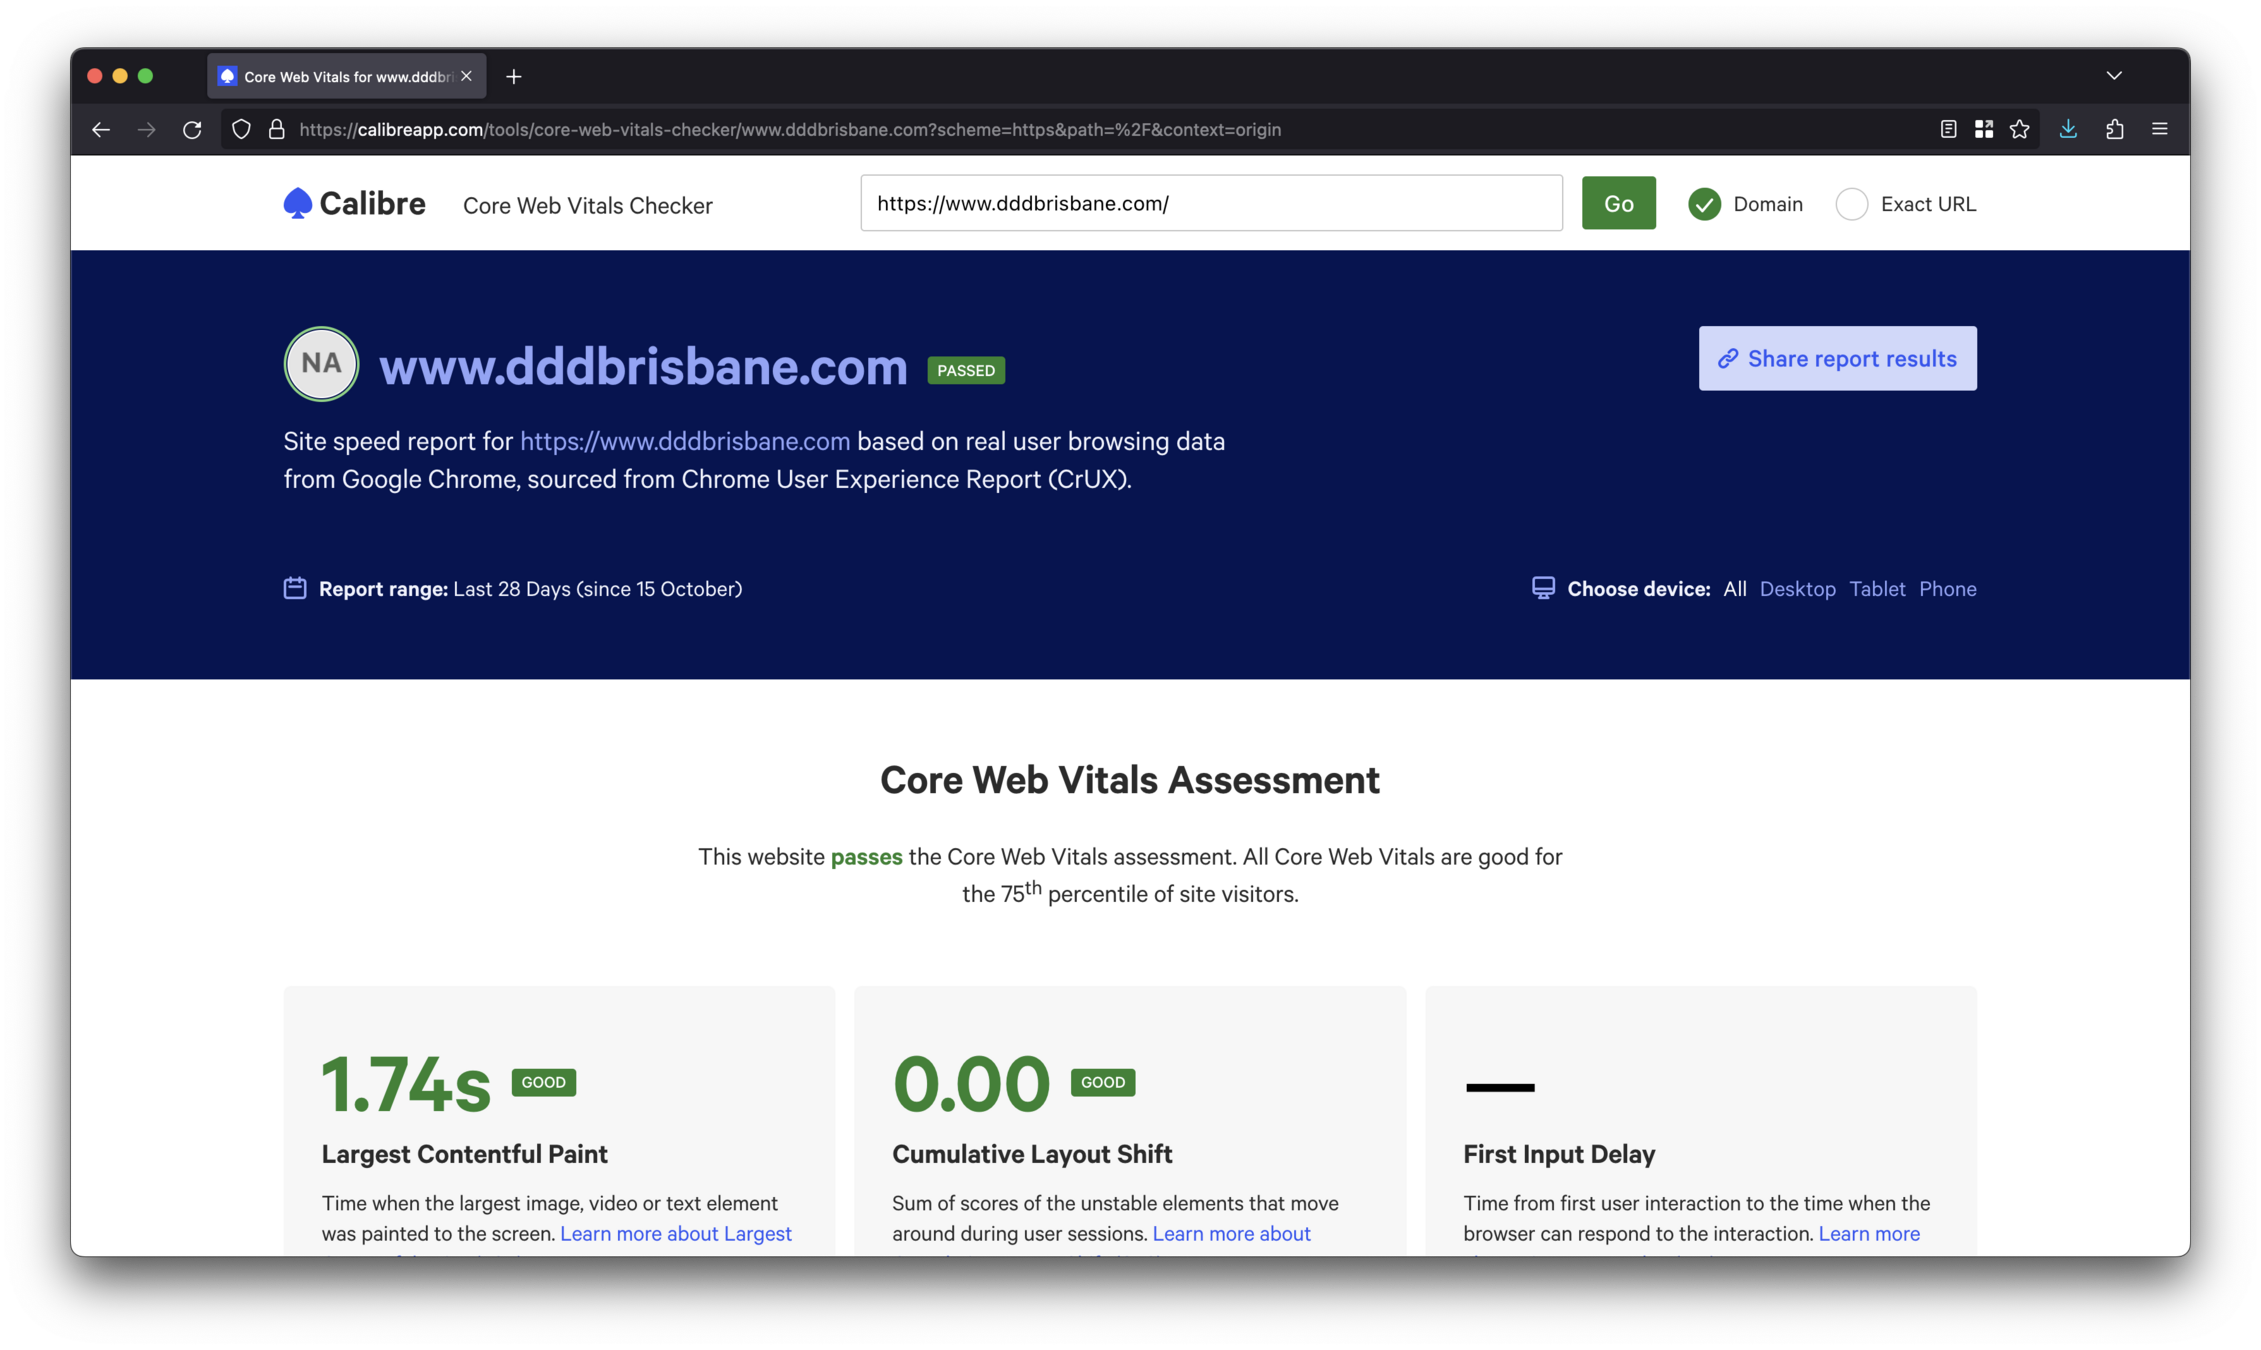
👍 On-demand access
👍 Zero configuration
👎 Same upsides and downsides as CrUX Report
Core Web Vitals Checker
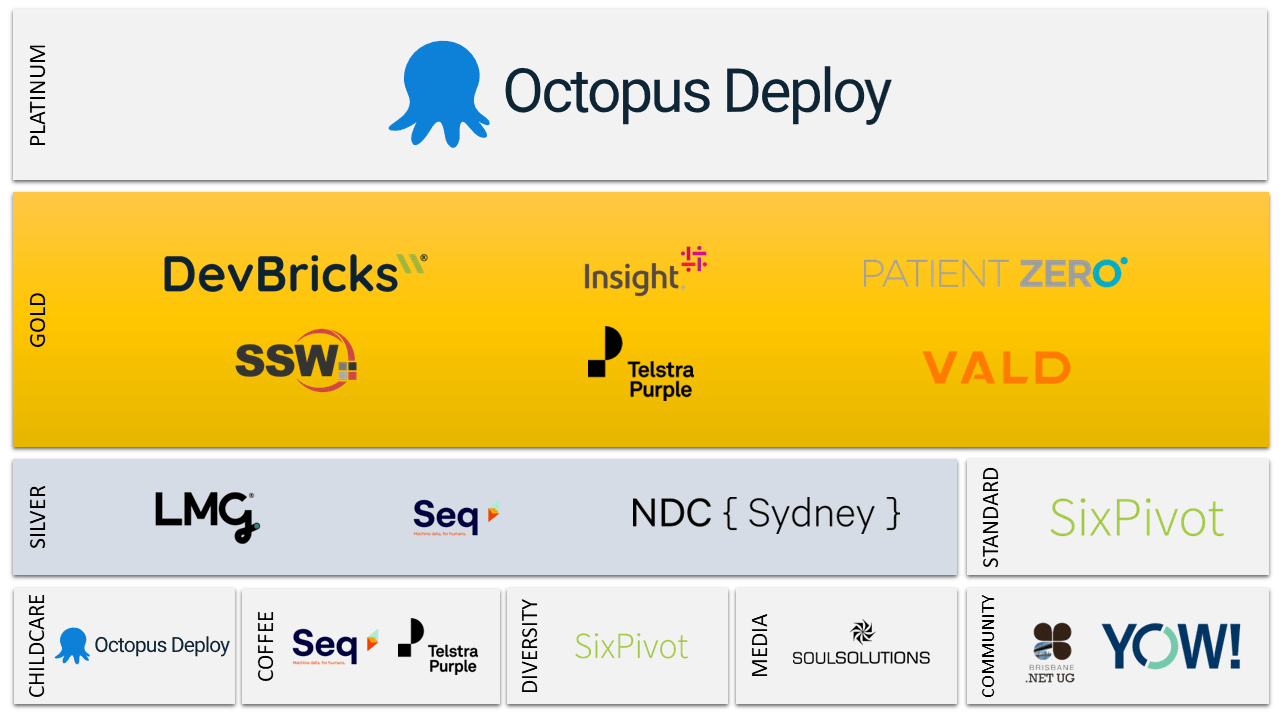

DDD Brisbane Sponsor Leaderboard
| Sponsor | TTFB | FCP | LCP ↑ | FID | INP | CLS |
|---|---|---|---|---|---|---|
| 🥇 Seq | 🟢 494ms | 🟢 856ms | 🟢 997ms | 🟢 10ms | 🟢 36ms | 🟢 0 |
| 🥈 LMG | 🟡 1.13s | 🟢 1.65s | 🟢 2.04s | 🟢 4ms | 🟢 46ms | 🟢 0 |
| 🥉 Patient Zero | 🟡 1.04s | 🟢 1.63s | 🟢 2.41s | ⚪ | ⚪ | 🟢 0 |
| SSW | 🟡 1.22s | 🟡 1.63s | 🟢 2.44s | 🟢 8ms | 🟢 70ms | 🟢 0.02 |
| YOW! Conferences | 🟡 986ms | 🟡 1.9s | 🟡 2.61s | 🟢 8ms | 🟢 50ms | 🟢 0 |
| Octopus | 🟡 1.18s | 🟡 2.56s | 🟡 2.61s | 🟢 5ms | 🟢 60ms | 🟢 0 |
| Telstra Purple | 🟡 1.29s | 🟡 2.55s | 🟡 2.68s | 🟢 6ms | 🟢 73ms | 🟢 0.03 |
| NDC Sydney | 🟡 1.97s | 🟡 2.4s | 🟡 2.99s | 🟢 13ms | 🟢 92ms | 🟢 0.02 |
| Vald | 🟢 918ms | 🟢 1.78s | 🟡 3.5s | 🟢 11ms | 🟢 105ms | 🔴 0.28 |
| Insight | 🟡 1.56s | 🔴 5.16s | 🔴 5.63s | 🟢 9ms | 🟢 140ms | 🟡 0.12 |
| DevBricks | ⚪ | ⚪ | ⚪ | ⚪ | ⚪ | ⚪ |
| SixPivot | ⚪ | ⚪ | ⚪ | ⚪ | ⚪ | ⚪ |
| Soul Solutions | ⚪ | ⚪ | ⚪ | ⚪ | ⚪ | ⚪ |
Goals
✅ User-Centric Performance
✅ Capture Metrics from End User Devices
⬛ Continuous Monitoring
| User Centric Performance | Capture Metrics from Real Users | Continuous Monitoring | |
|---|---|---|---|
| window.onload() | ⬛ | ⬛ | ⬛ |
| Google Lighthouse | ✅ | ⬛ | ⬛ |
| Calibre | ✅ | ⬛ | ⬛ |
| CrUX Report | ✅ | ✅ | ⬛ |
| Web Vitals Checker | ✅ | ✅ | ⬛ |
| ??? | ✅ | ✅ | ✅ |
Continuous Monitoring
Request Metrics
https://requestmetrics.com
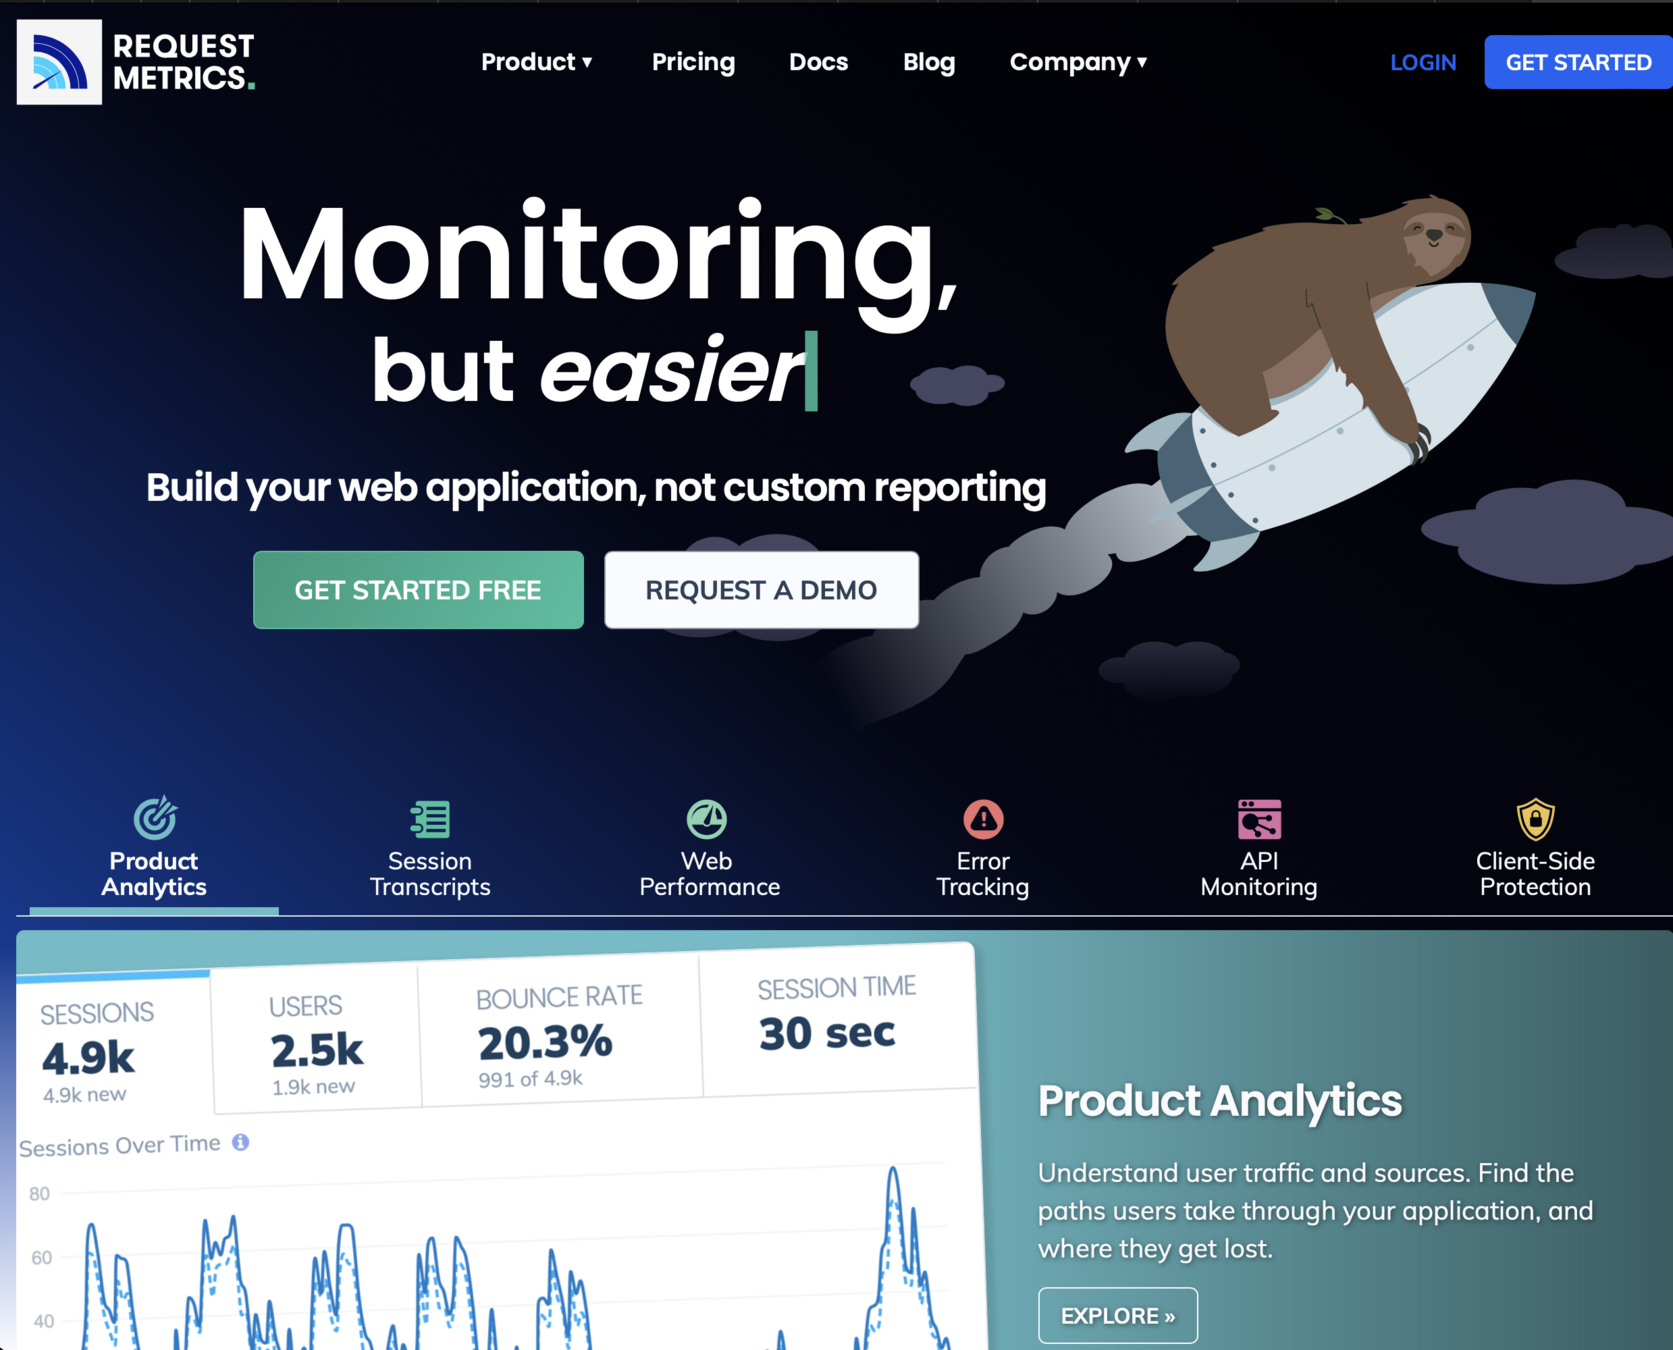

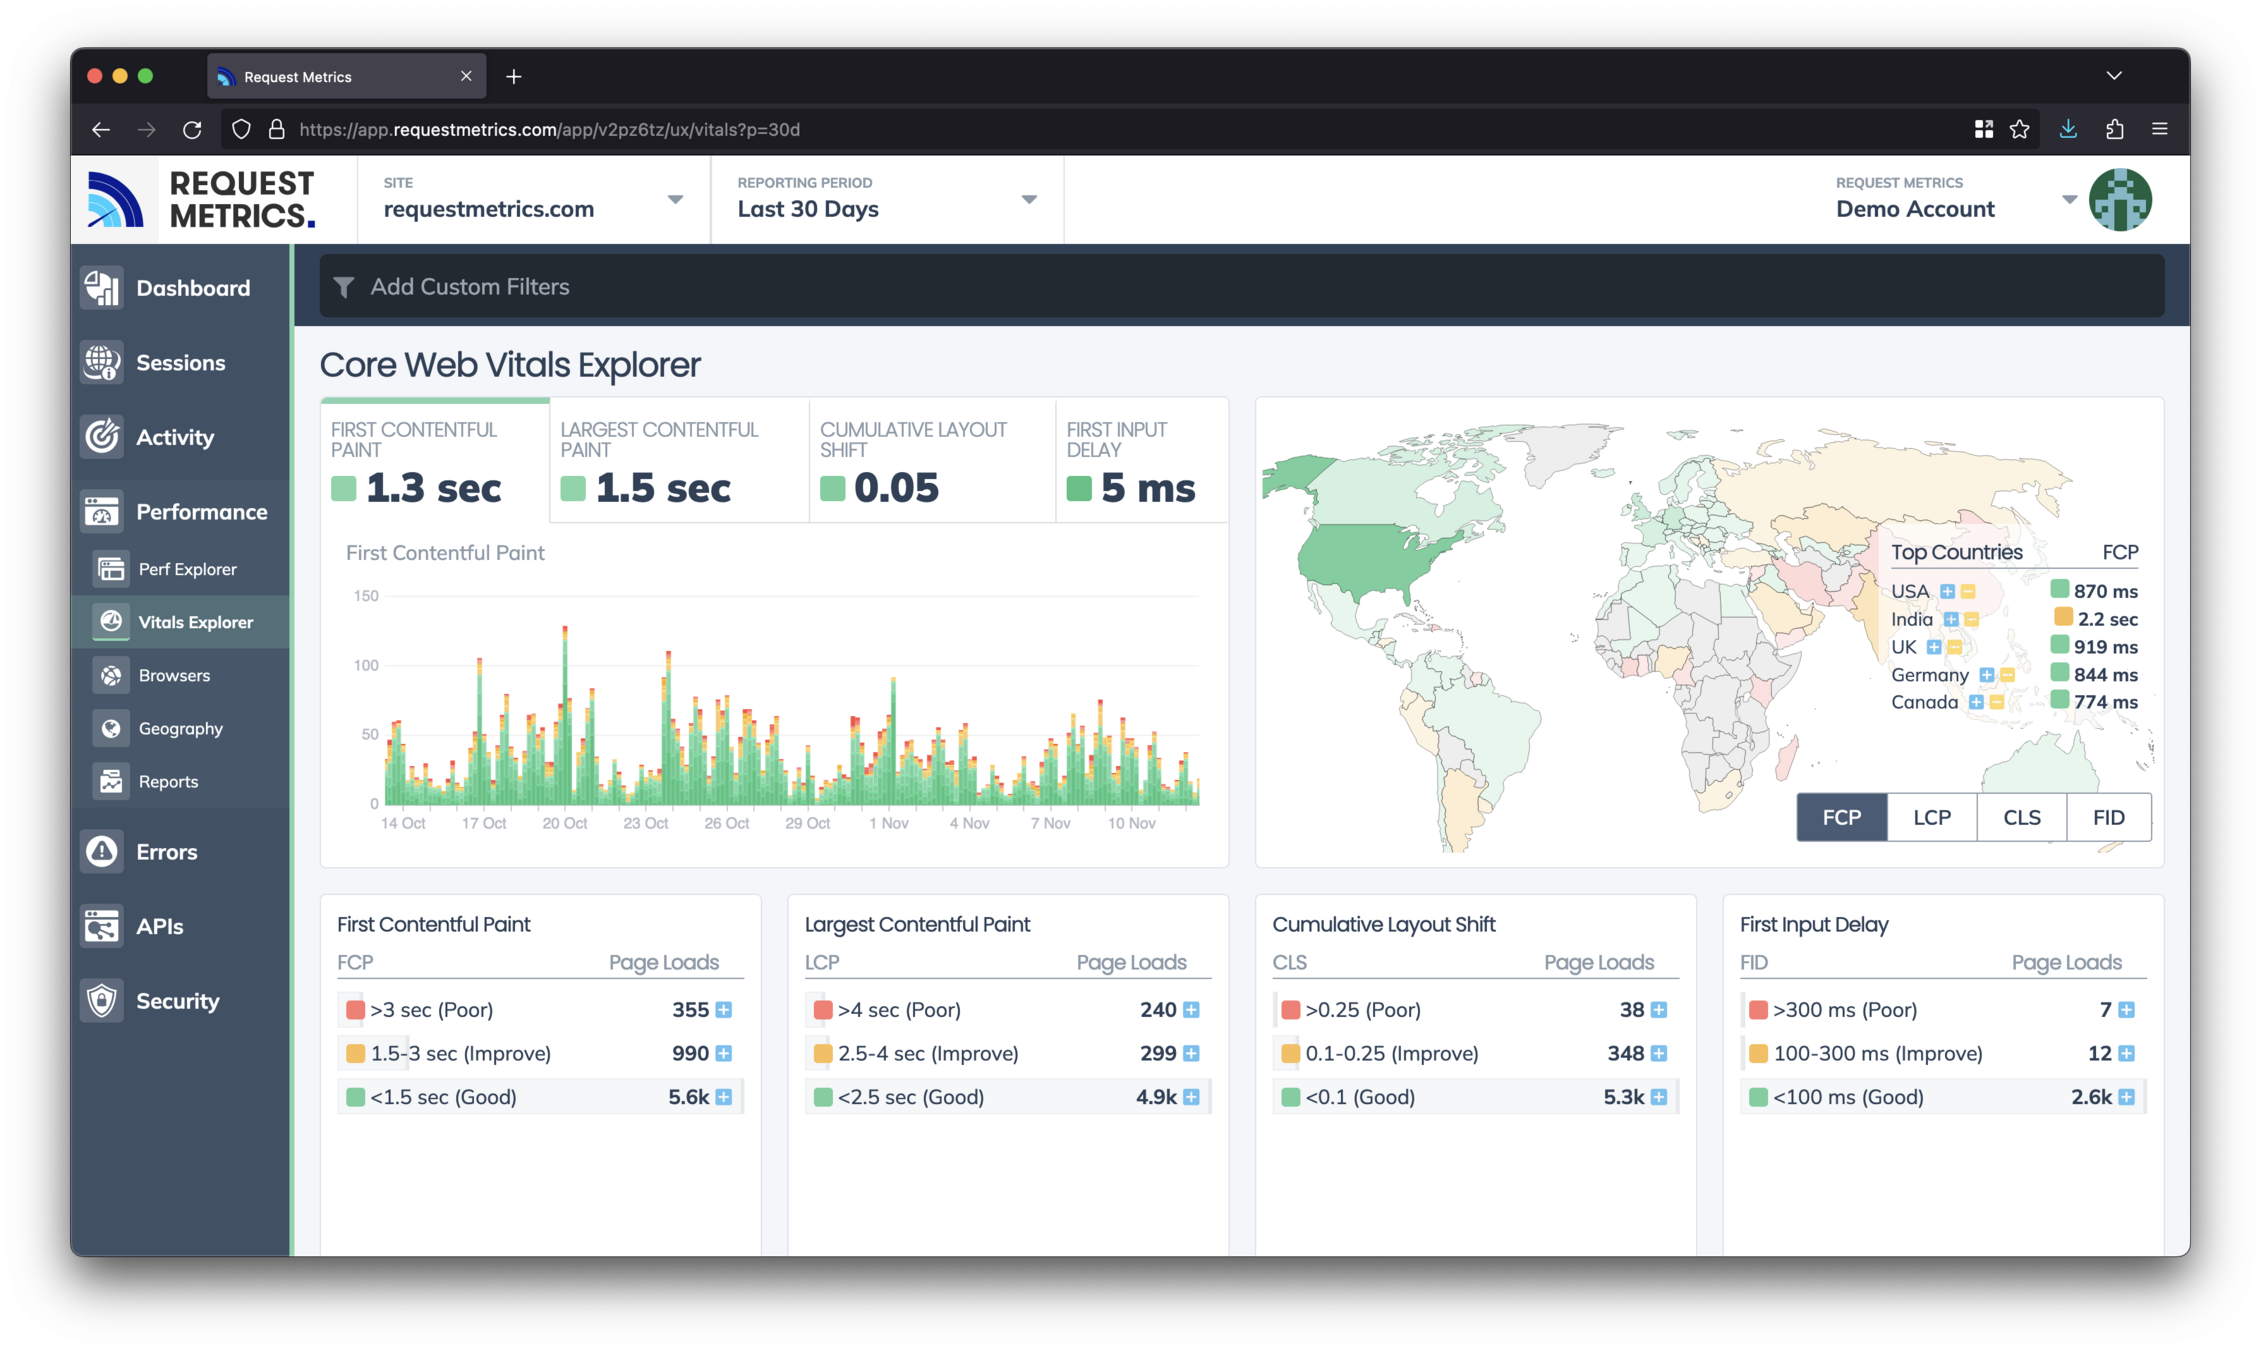
👍 Near real-time continuous monitoring
👍 Detailed reporting with zero sampling
👎 Can be expensive ($200/mo for 1 million sessions)
Request Metrics
Could we
Build it ourselves?
Prometheus + Grafana
Grafana

Prometheus

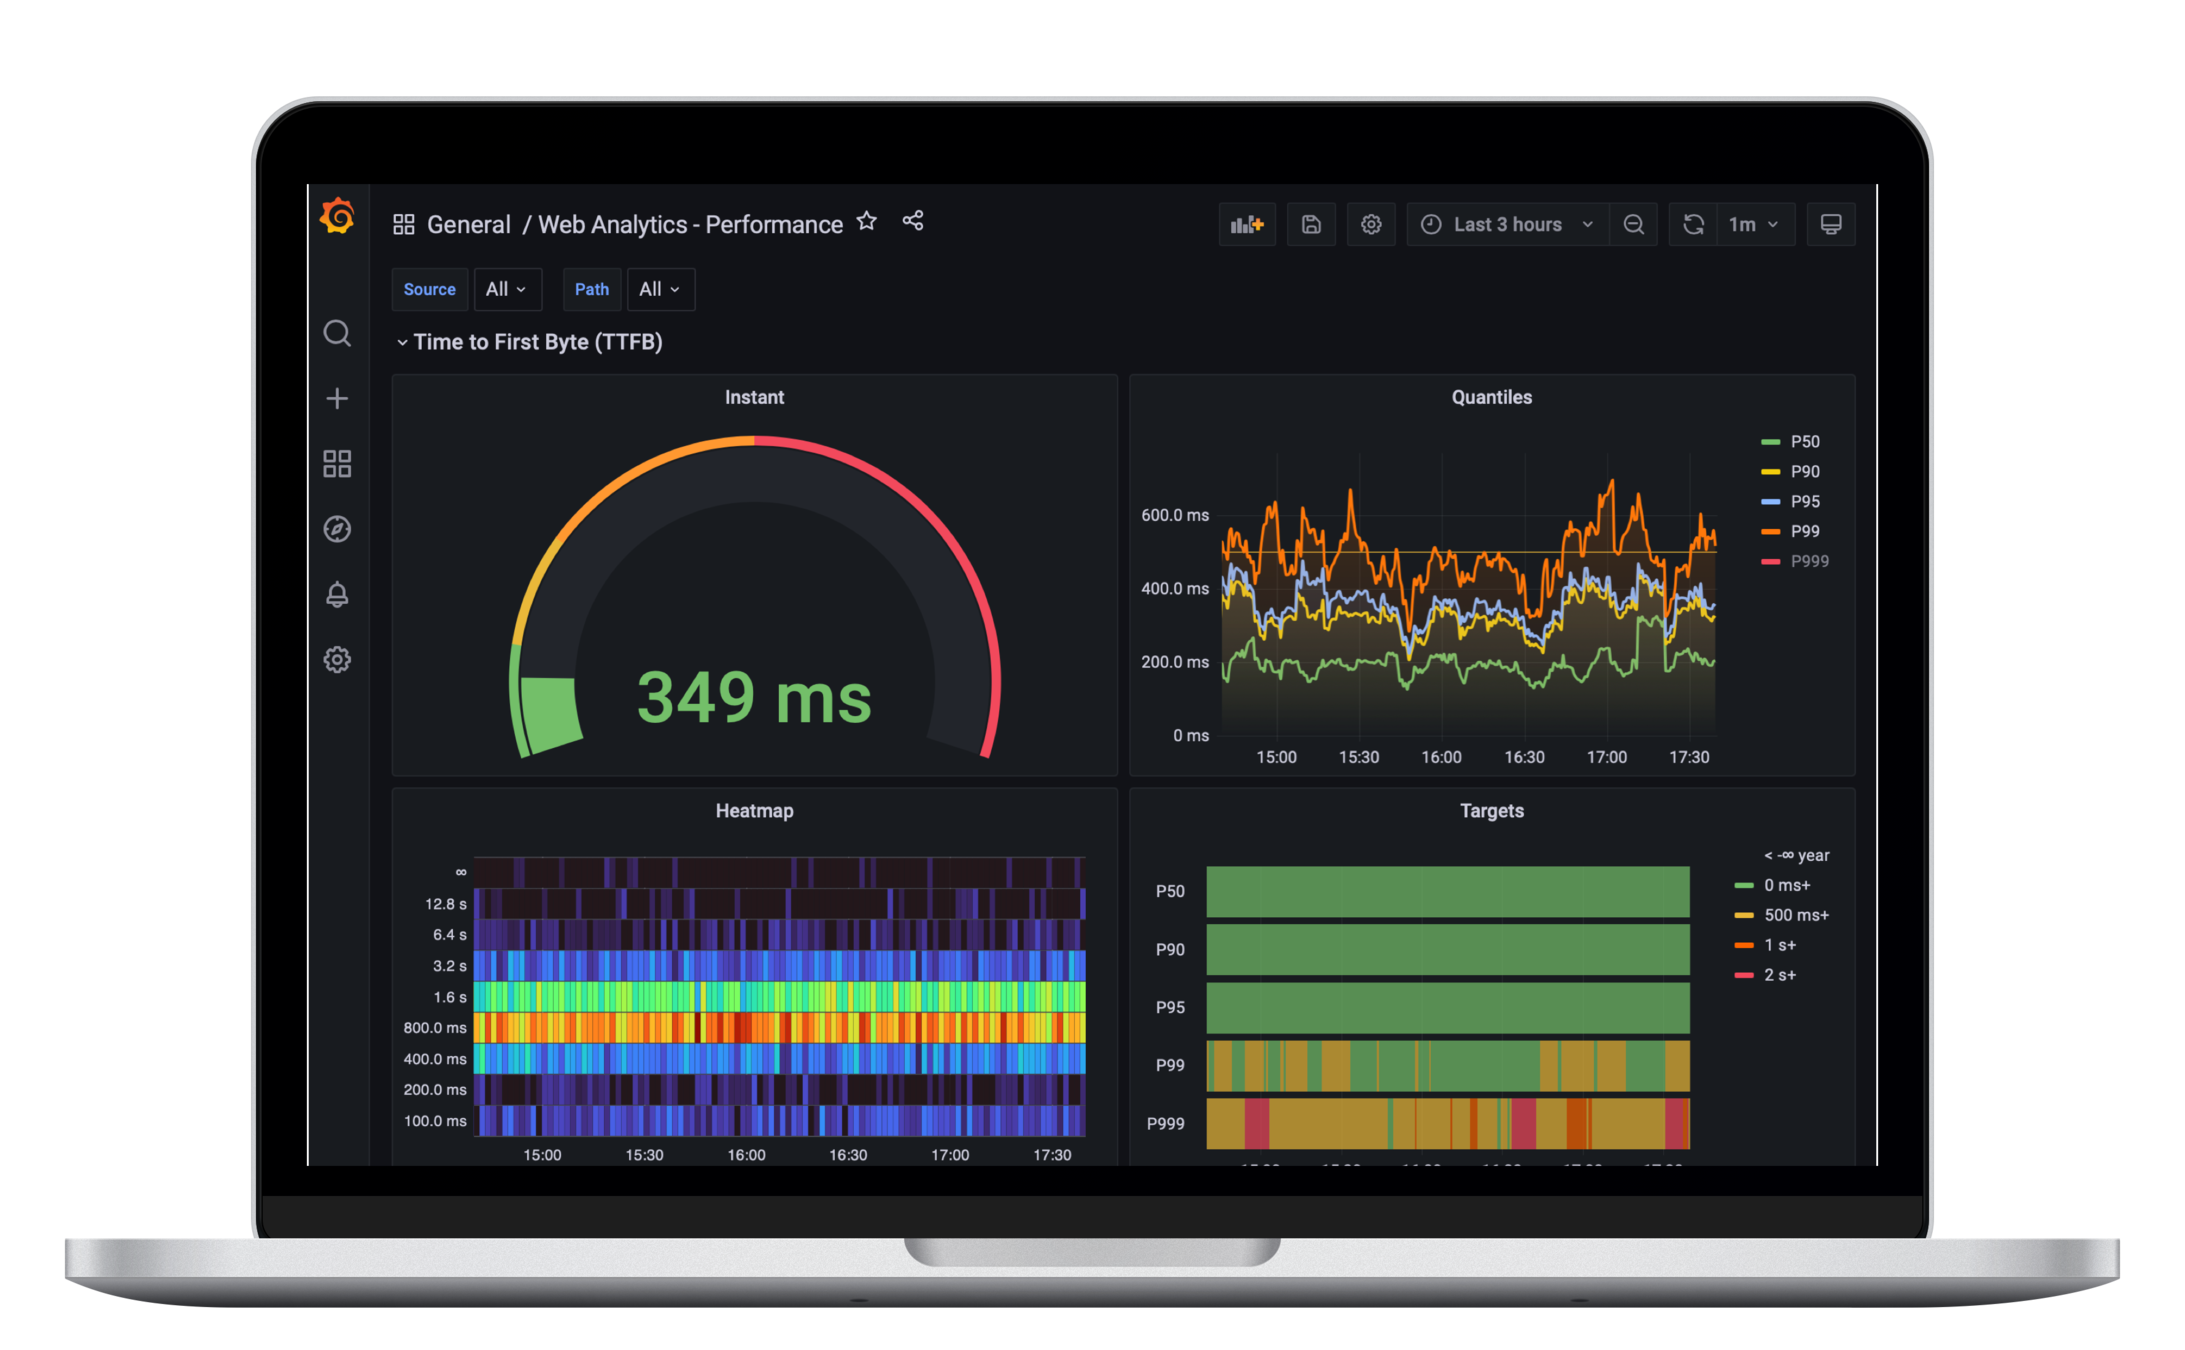
GET /metrics
POST /analytics
Analytics Service


web-vitals
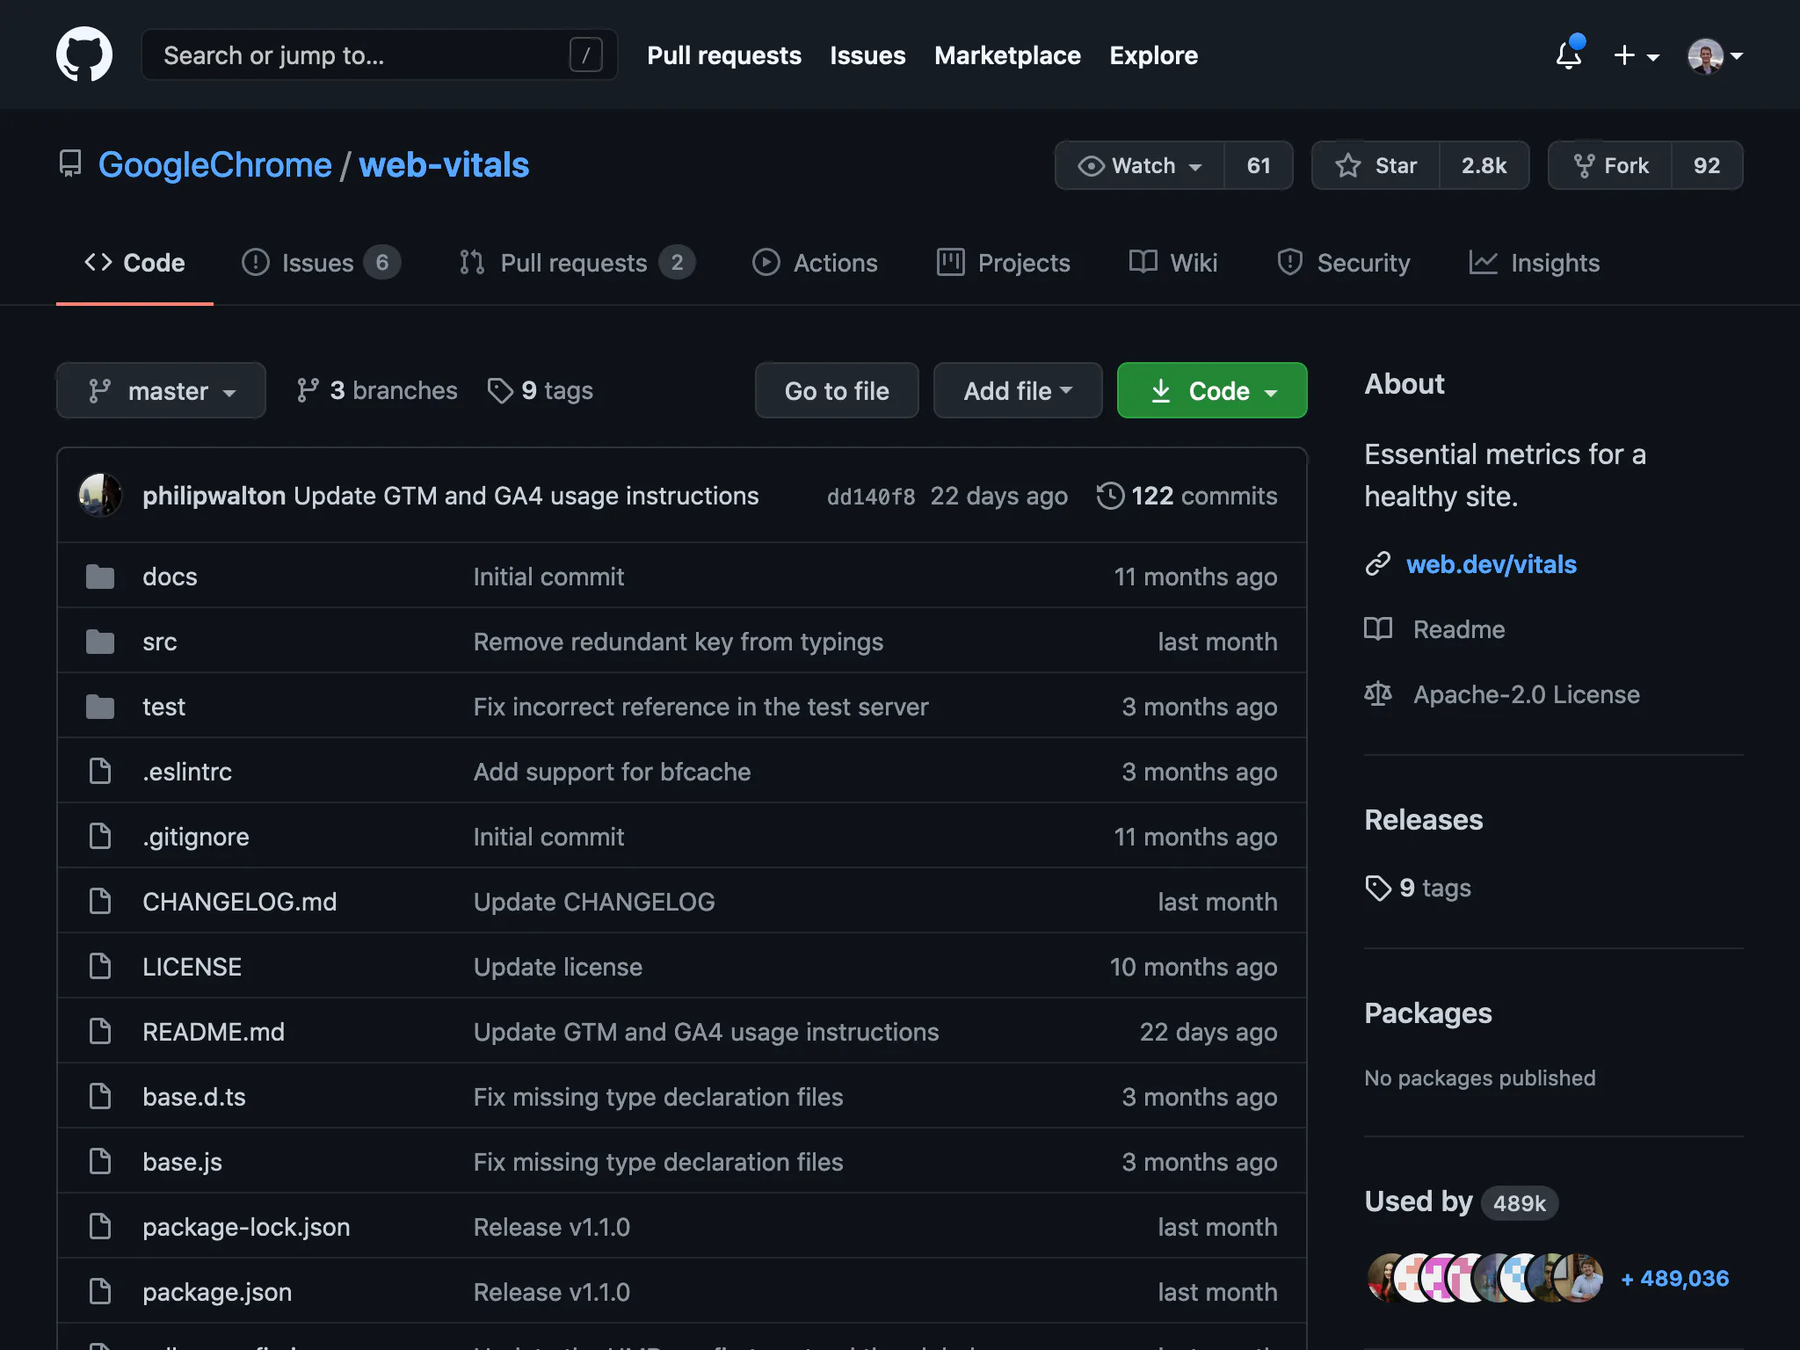
https://github.com/GoogleChrome/web-vitals
import webVitals from 'web-vitals';

webVitals.getTTFB(sendToAnalytics);
webVitals.getFCP(sendToAnalytics);
webVitals.getLCP(sendToAnalytics);
webVitals.getFID(sendToAnalytics);
webVitals.getINP(sendToAnalytics);
webVitals.getCLS(sendToAnalytics);

export const sendToAnalytics =
  data => navigator.sendBeacon('/analytics', JSON.stringify(data));
FrontEnd
import { Summary } from 'prom-client';

const ttfb = new Summary({ name: `ttfb`, labelNames: [`path`] });
const fcp =  new Summary({ name: `fcp`, labelNames: [`path`] });
const lcp =  new Summary({ name: `lcp`, labelNames: [`path`] });
const fid =  new Summary({ name: `fid`, labelNames: [`path`] });
const inp =  new Summary({ name: `inp`, labelNames: [`path`] });
const cls =  new Summary({ name: `cls`, labelNames: [`path`] });
BackEnd
express()
  .post(`/analytics`, (req, res) => {
    const { path, body: { metric, value } } = req;
    switch (metric) {
      case `TTFB`: ttfb.labels(path).observe(value); break;
      case `FCP`:  fcp.labels(path).observe(value);  break;
      case `LCP`:  lcp.labels(path).observe(value);  break;
      case `FID`:  fid.labels(path).observe(value);  break;
      case `INP`:  inp.labels(path).observe(value);  break;
      case `CLS`:  cls.labels(path).observe(value);  break;
    }
    res.status(200).send({});
  })
  .listen(8000);
Backend
Data Analytics
Amazon S3


Snowflake
POST /analytics
Analytics Service


👍 Near real-time continuous monitoring
👍 Free open source tooling
👎 Ongoing maintenance cost
👎 Almost certainly a bad idea
Build it yourself
Goals
✅ User-Centric Performance
✅ Capture Metrics from End User Devices
✅ Continuous Monitoring
Resources
Progressive Performance (Chrome Dev Summit 2016) - Alex Russel
The Mobile Web: MIA - Alex Russel
The Performance Inequality Gap, 2023 - Alex Russel
The Baseline for Web Performance in 2022 - Line Engineering Blog
Timing for bringing page experience to Google Search - Google Search Central Blog
Dark Silicon and the end of multicore scaling - IEEExplore
Speed Test Global Index - United States
Fast Load Times: Techniques for improving page load experience - web.dev
Site Speed Topography - CSS Wizardry
Measure What You Impact, Not What You Influence - CSS Wizardry
Metrics
Tools
https://developers.google.com/web/tools/lighthouse
https://calibreapp.com/features/pull-request-reviews
https://developers.google.com/web/tools/chrome-user-experience-report
https://calibreapp.com/tools/core-web-vitals-checker
https://github.com/GoogleChrome/web-vitals
https://macklin.me/7-useful-tools-for-monitoring-web-performance-user-experience
