Group E
Matplotlib is one of the most important packages for Data Visualization


- One of the first packages : first release in 2003
- originally developed by John D. Hunter
- contains several noticeable sub.packages :

Seaborn
GGplot


Pyplot
import matplotlib
import matplotlib.pyplot as plt
import seaborn as sns
import ggplot
from ggplot import diamonds


%matplotlib inline

import matplotlib
import matplotlib.pyplot as plt
import seaborn as sns
'Types of Plots :'

plt.hist()
plt.scatter()
plt.pie()
plt.bar()
...
Use the alias of pyplot : plt along with the type of plot you want

The Basic Commands in Matplotlib


plt.show()

-> 'Display the plot(s)'

plt.clf()

-> 'Clean the plot so that you can start fresh'
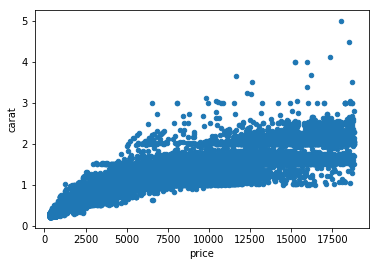
plt.scatter(
x = diamonds['price'],
y = diamonds['carat'])

plt.show()
plt.scatter(
x = diamonds.price,
y = diamonds.carat)
plt.show()Call variables from a dataset
1. Using brackets
2. Using dots

plt.scatter(
x=diamonds.price,
y=diamonds.carat)
ggplot(data=diamonds)
+ geom_point(aes(x=price, y=carat))

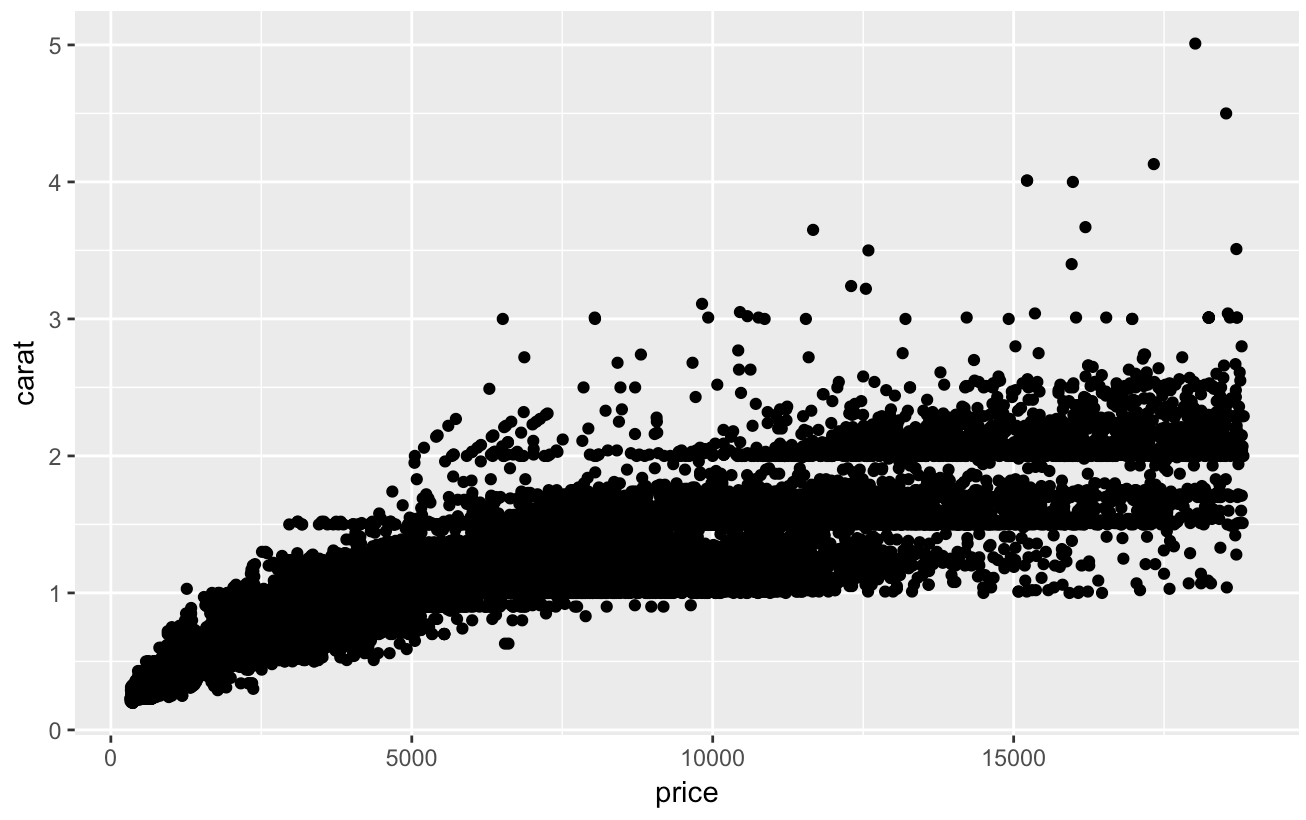


matplotlib.style.use('ggplot')- Customize matplotlib to your own taste


matplotlib.style.use('dark_background')import matplotlib.pyplot as plt
import pandas as pd
df=pd.read_csv("/Users/anchaljaiswal/Downloads/diamonds.csv")
plt.scatter(x=df.carat,y=df.price)
plt.show()Customization

We start with a simple scatter plot between Carat and Price of a diamond
Now let's add axis labels and chart title to improve readability
plt.scatter(x=df.carat,y=df.price)
plt.xlabel("Carat")
plt.ylabel("Price")
plt.title("Diamonds")
plt.show()
Customization

We can also change the color and shape of the points in the graph
plt.scatter(x=df.carat,y=df.price,marker='2')
plt.xlabel("Carat")
plt.ylabel("Price")
plt.title("Diamonds")
plt.show()
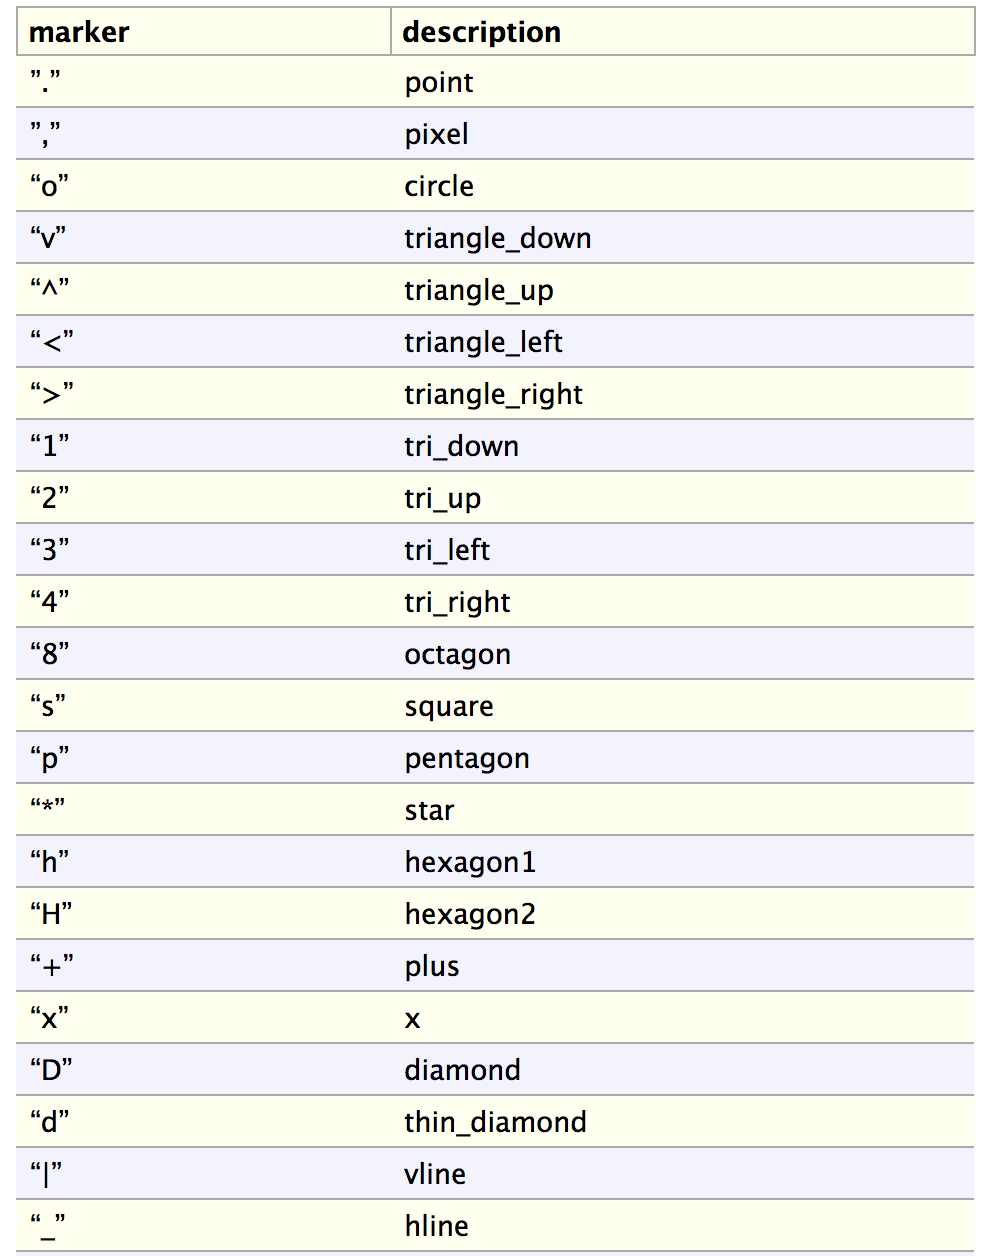
Customization

Changing the shape
Customization
plt.scatter(x=df.carat,y=df.price,c='g',
marker='2')
plt.xlabel("Carat")
plt.ylabel("Price")
plt.title("Diamonds")
plt.show()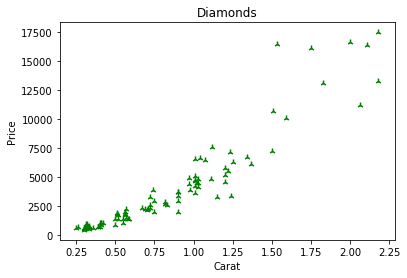
Changing the Color: Option1

plt.scatter(x=df.carat,y=df.price,c='#0000FF',
marker='2')
plt.xlabel("Carat")
plt.ylabel("Price")
plt.title("Diamonds")
plt.show()
Changing the Color: Option 2
Customization
plt.scatter (x=df.carat,y=df.price)
plt.xlabel ("Carat")
plt.ylabel ("Price")
plt.title ("Diamonds")
y_max=max(df.price)
x_max=df.carat[df.price==y_max]
plt.annotate ('Costliest Diamond', xy=(x_max,y_max), xytext=(3, 5),
    fontsize=15,arrowprops=dict(facecolor='black', shrink=0.05))
plt.show ()
We can use the annotate function to highlight a specific feature in the graph with an arrow

Customization
plt.scatter (x=df.carat,y=df.price)
plt.xlabel ("Carat")
plt.ylabel ("Price")
plt.title ("Diamonds")
plt.text(1.18, 2500, r'ln(y) = $b_0 + \sum_{j=1}^p b_j*x_j$', fontsize=18)
plt.show()
Matplotlib allows us to embed a mathematical formula with the plot

Customization
plt.scatter(df.carat,df.price,)
plt.xlabel("Carat")
plt.ylabel("Price")
plt.xticks(np.arange(min(df.carat)+0.1, max(df.carat)+0.3, 0.5))
plt.yticks(np.arange(500, max(df.price)+2000, 3000))
plt.title("Diamonds")
plt.show()
Get or set the x-limits and y-limits of the current tick locations and labels.

Customization
plt.scatter(df.carat,df.price,)
plt.xlabel("Carat")
plt.ylabel("Price")
plt.title("Diamonds")
plt.tight_layout()
plt.show()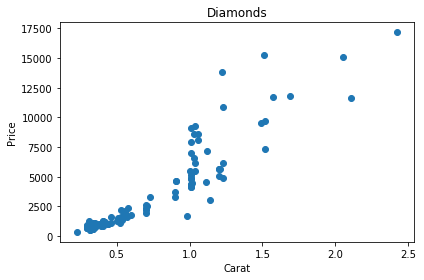
Tight layout automatically adjusts the parameters, so that the plot fits the figure area
Customization
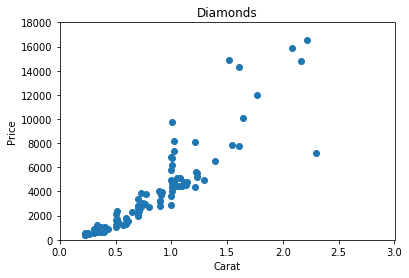
plt.scatter(df.carat,df.price,)
plt.xlabel("Carat")
plt.ylabel("Price")
plt.xlim(0,3)
plt.ylim(0,18000)
plt.title("Diamonds")
plt.show()
Xlim and Ylim automatically sets limits in y and x parameters.
Customization
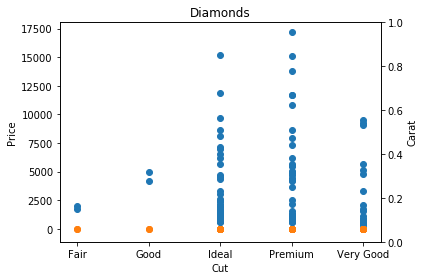
plt.scatter(df.cut, df.price)
plt.scatter(df.cut, df.carat)
plt.ylabel("Price")
plt.xlabel("Cut")
plt.twinx()
plt.ylabel("Carat")
plt.title("Diamonds")
plt.show()
Create a twin Axes sharing the x-axis
Customization
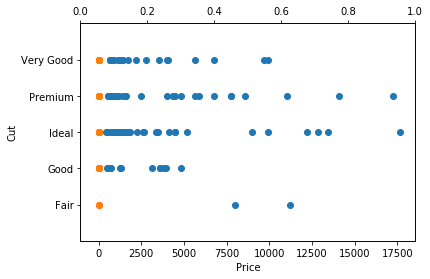
plt.scatter(df.price, df.cut)
plt.scatter(df.carat, df.cut)
plt.ylabel("Cut")
plt.xlabel("Price")
plt.ylim(0,18000)
plt.twiny()
plt.ylabel("Cut")
plt.ylim(-1,5)
plt.show()
Create a twin Axes sharing the y-axis
Customization
plt.subplot(2,1,1);
plt.scatter(df.price, df.cut)
plt.scatter(df.carat, df.cut)
plt.ylabel("Cut")
plt.xlabel("Price")
plt.ylim(0,18000)
plt.twiny()
plt.ylabel("Cut")
plt.ylim(-1,5)

plt.subplot(2,1,2);
plt.scatter(df.cut, df.price)
plt.scatter(df.cut, df.carat)
plt.ylabel("Price")
plt.xlabel("Cut")
plt.twinx()
plt.ylabel("Carat")


plt.tight_layout()
plt.show()
Customization
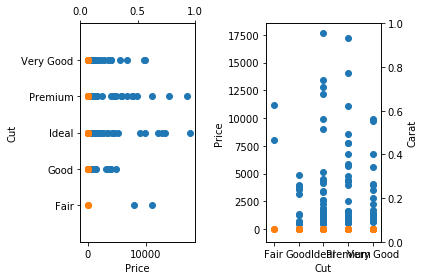
plt.subplot(1,2,1);
plt.scatter(df.price, df.cut)
plt.scatter(df.carat, df.cut)
plt.ylabel("Cut")
plt.xlabel("Price")
plt.ylim(0,18000)
plt.twiny()
plt.ylabel("Cut")
plt.ylim(-1,5)

plt.subplot(1,2,2);
plt.scatter(df.cut, df.price)
plt.scatter(df.cut, df.carat)
plt.ylabel("Price")
plt.xlabel("Cut")
plt.twinx()
plt.ylabel("Carat")


plt.tight_layout()
plt.show()
In the previous subplot (2,1,1) and (2,1,2) while in this one (1,2,1) and (1,2,2)
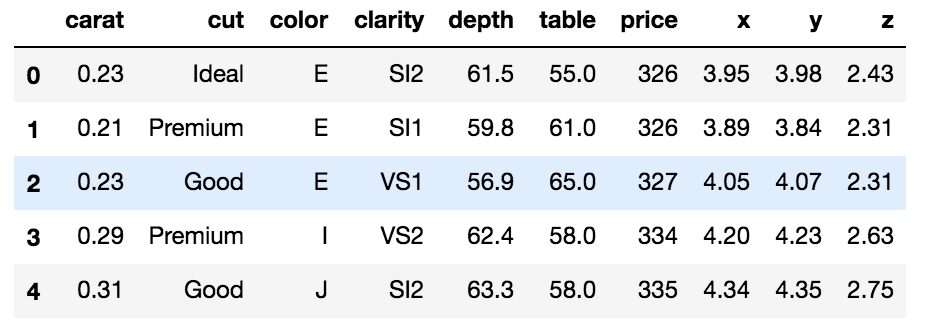
diamonds.head()

import seaborn as sns

sns.stripplot(x='cut', y='price', data=diamonds)
plt.show()


Univariate plots - Stripplot

diamonds.head()

import seaborn as sns

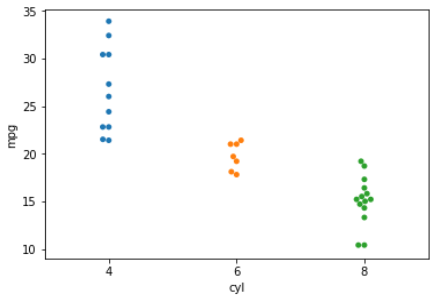
sns.swarmplot(x='cyl', y='mpg', data=mtcars)
plt.show()
Spreads out points to prevent overplotting
note: very slow
Swarmplot

import seaborn as sns

sns.boxplot(x='cut', y='price', data=diamonds)
plt.show()

sns.violinplot(x='cut', y='price', data=diamonds)
plt.show()
Violinplot, alternative to boxplot that also shows frequency distribution
Univariate plots


Standard boxplot

import seaborn as sns

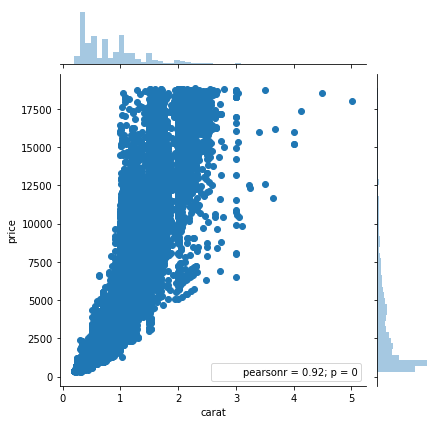
sns.jointplot(x='carat', y='price', data=diamonds)
plt.show()
plots continuous x and y variables against each other with correlation and histograms on both sides
Jointplot

import seaborn as sns

sns.pairplot(data=diamonds)
plt.show()
Plots each variable in the dataset against each other to quickly get an overview of the data
Pairplot


import seaborn as sns

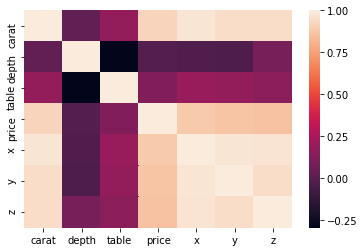
diamonds2 = diamonds.drop(diamonds.columns[[1, 2, 3]], axis=1)
covars = diamonds2.corr()

sns.heatmap(covars)
plt.show()
First calculate covariances, the heatmap will display them visually
Heatmap

import seaborn as sns

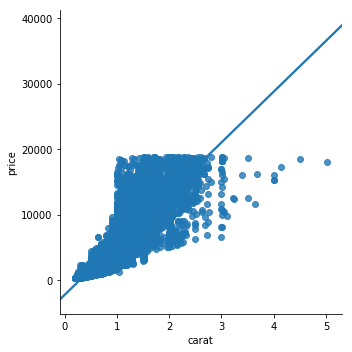
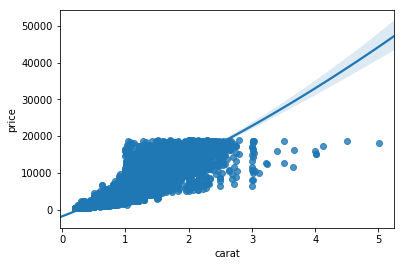
sns.regplot(x='carat', y='price', data=diamonds)
plt.show()
Simple way to plot linear model over a scatterplot
Statistical plots
Regplot (1/2)

import seaborn as sns

sns.regplot(x='carat', y='price', data=diamonds, order=2)
plt.show()
Add 'order' argument to fit different level polynomials over the data
Statistical plots
Regplot (2/2)

import seaborn as sns

sns.lmplot(x='carat', y='price', data=diamonds, hue='cut', scatter_kws={'alpha':0.1})
plt.show()
- Hue divides the data in different groups based on a factor variable
- scatter_kws={'alpha':0.1} sets the alpha of the scatter plot part of the lmplot()
Statistical plots
Lmplot
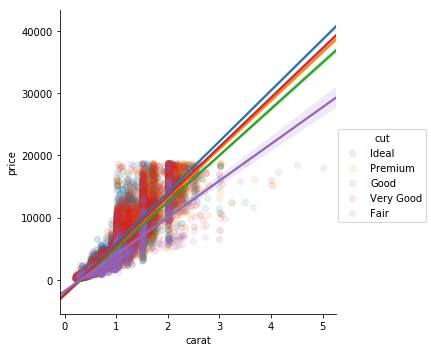
Combination of sns.regplot() and facet grid. Allows you to set extra arguments like 'hue'

import seaborn as sns

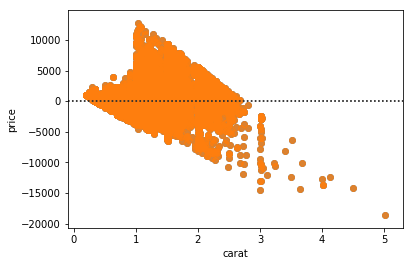
sns.residplot(x='carat', y='price', data=diamonds)
plt.show()
Statistical plots
Residplot
Allows you to plot residuals of the relationship between different continuous variables
