Mycobacterium tuberculosis transmission cluster inference with Nanopore sequencing
Dataset
- Mtb WGS from culture
- Madagascar (118), South Africa (83), Birmingham (46)
- Matched Illumina and Nanopore (and 35 PacBio CCS)
- 150 after QC (7 PacBio)
Calibration of Nanopore variant filters
Aim: produce precision on par with Illumina
Calibration of Nanopore variant filters
Illumina SNPs called with COMPASS
Nanopore SNPs called with bcftools
Evaluate precision and recall with varifier for 7 PacBio samples
Different bcftools filters applied
Precision = fraction of calls that are correct
Recall = fraction of expected calls made correctly
Calibration of Nanopore variant filters
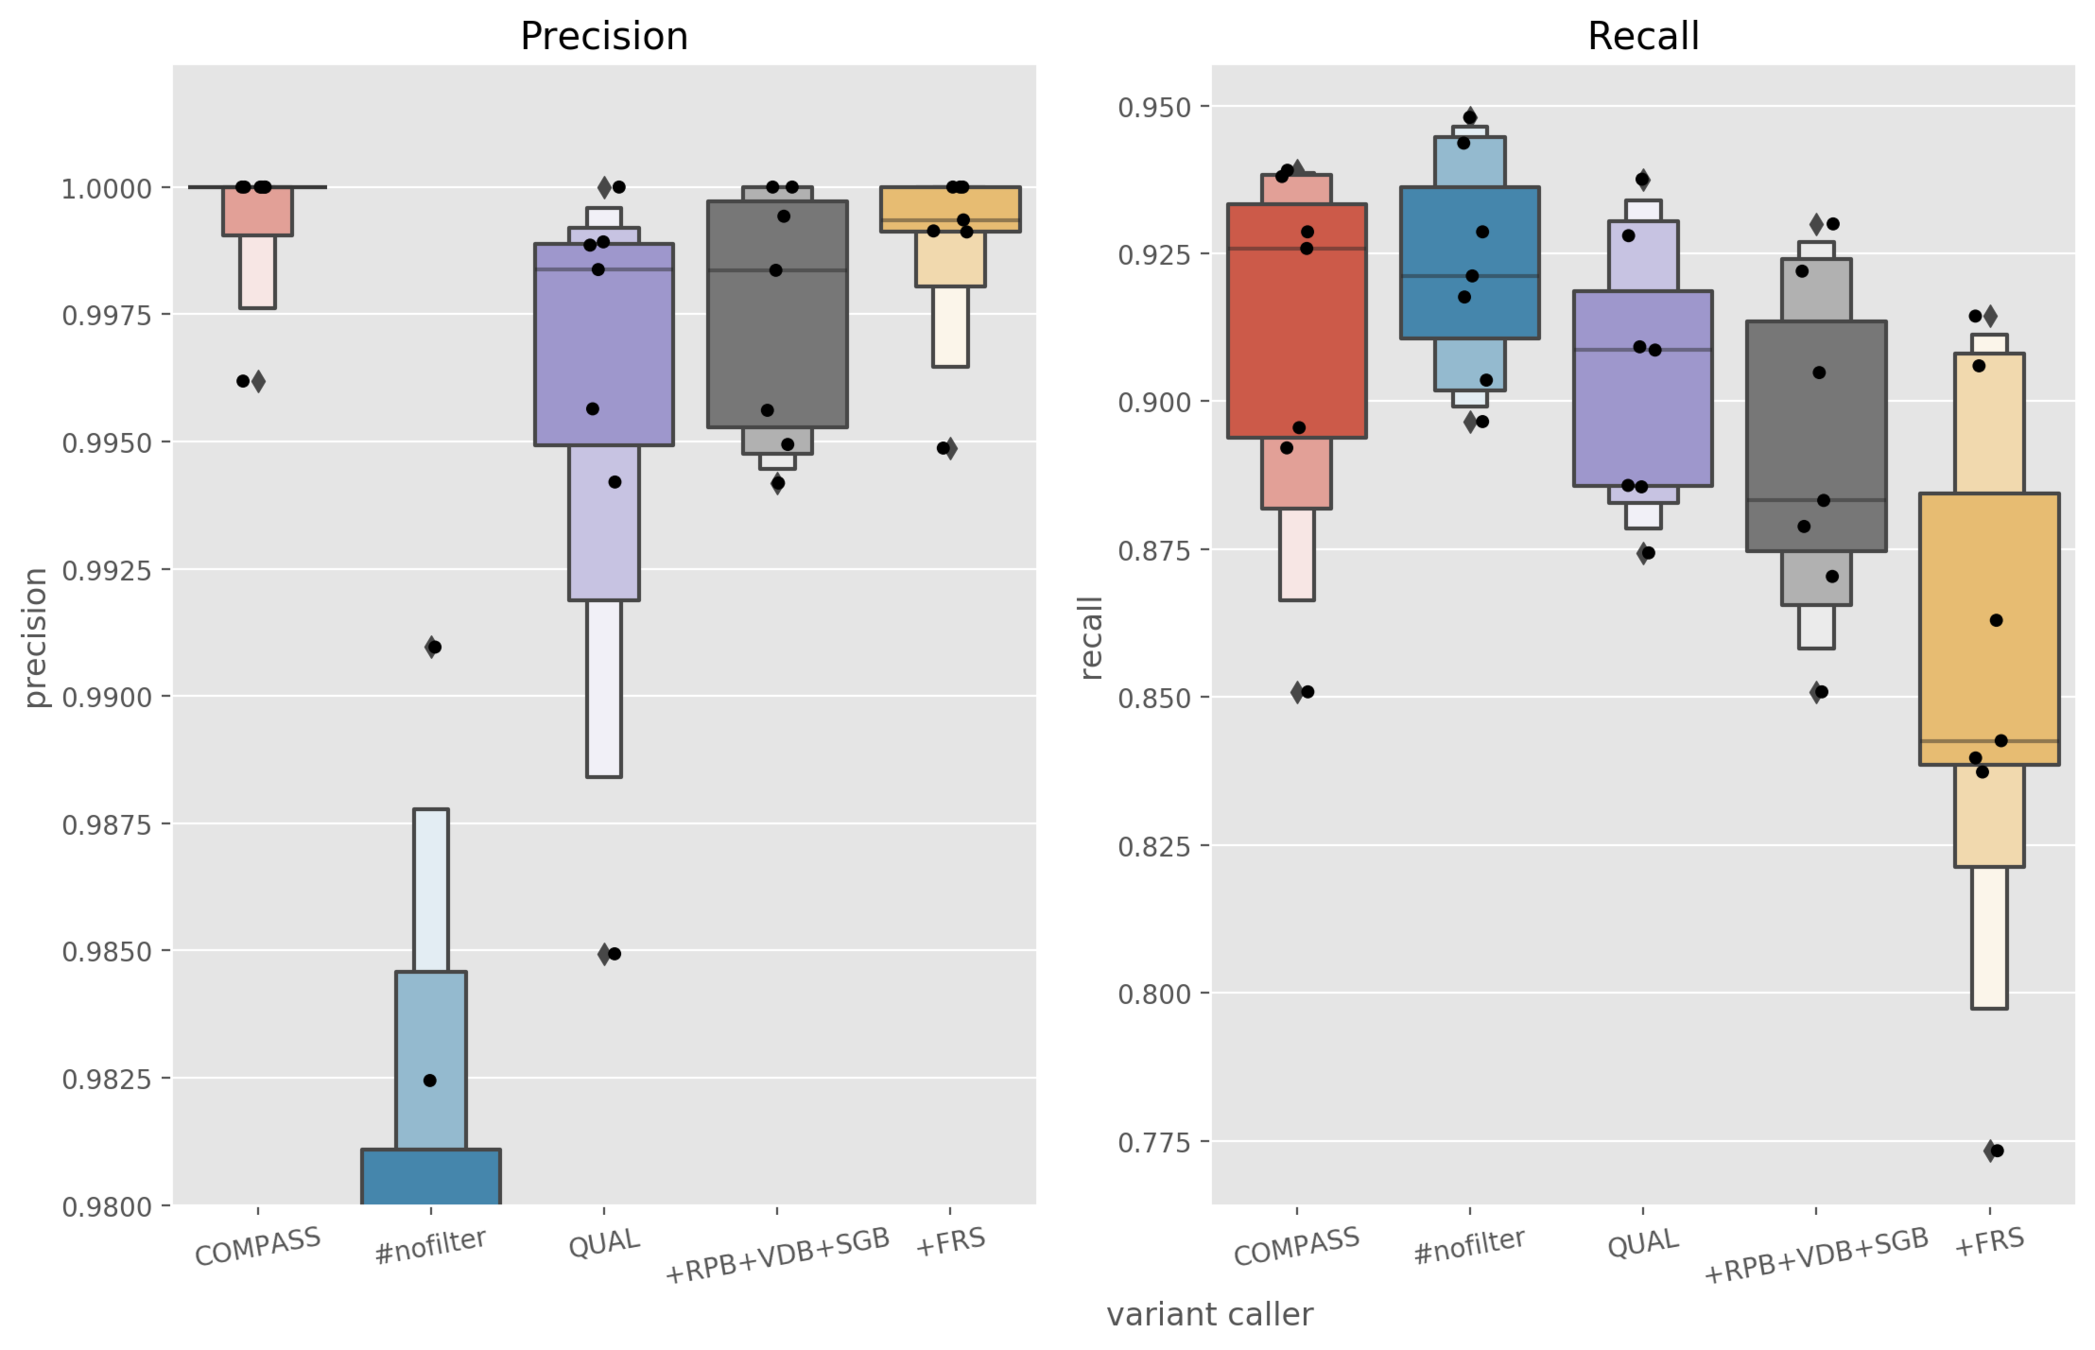
FP counts: 0, 0, 0, 1(0), 1(0), 1(0), 4(3)
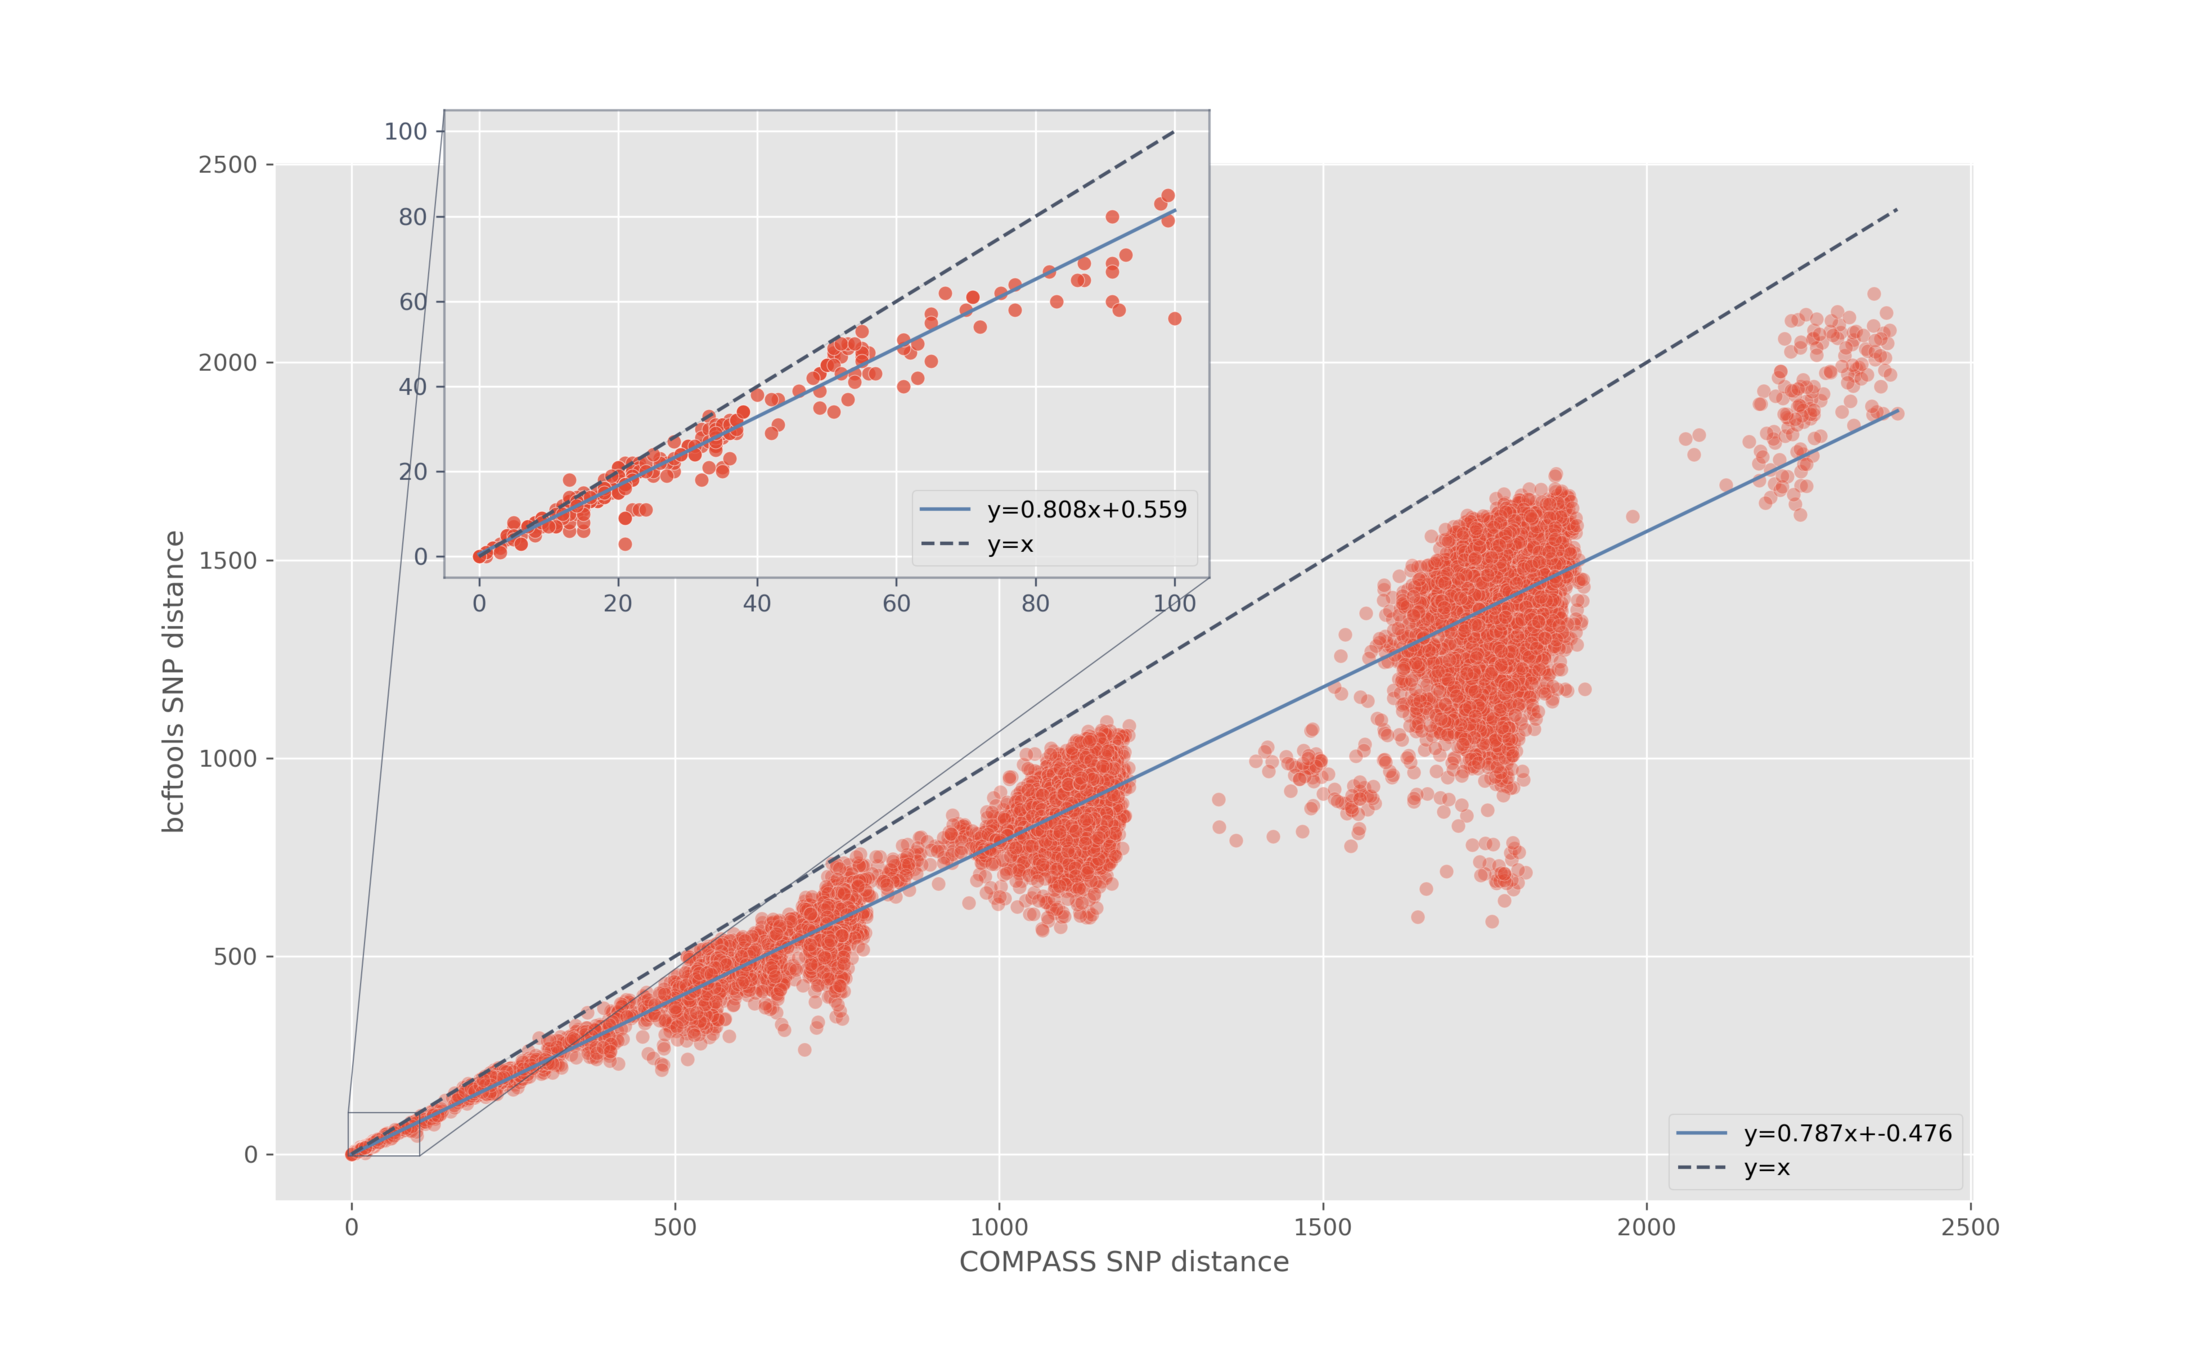
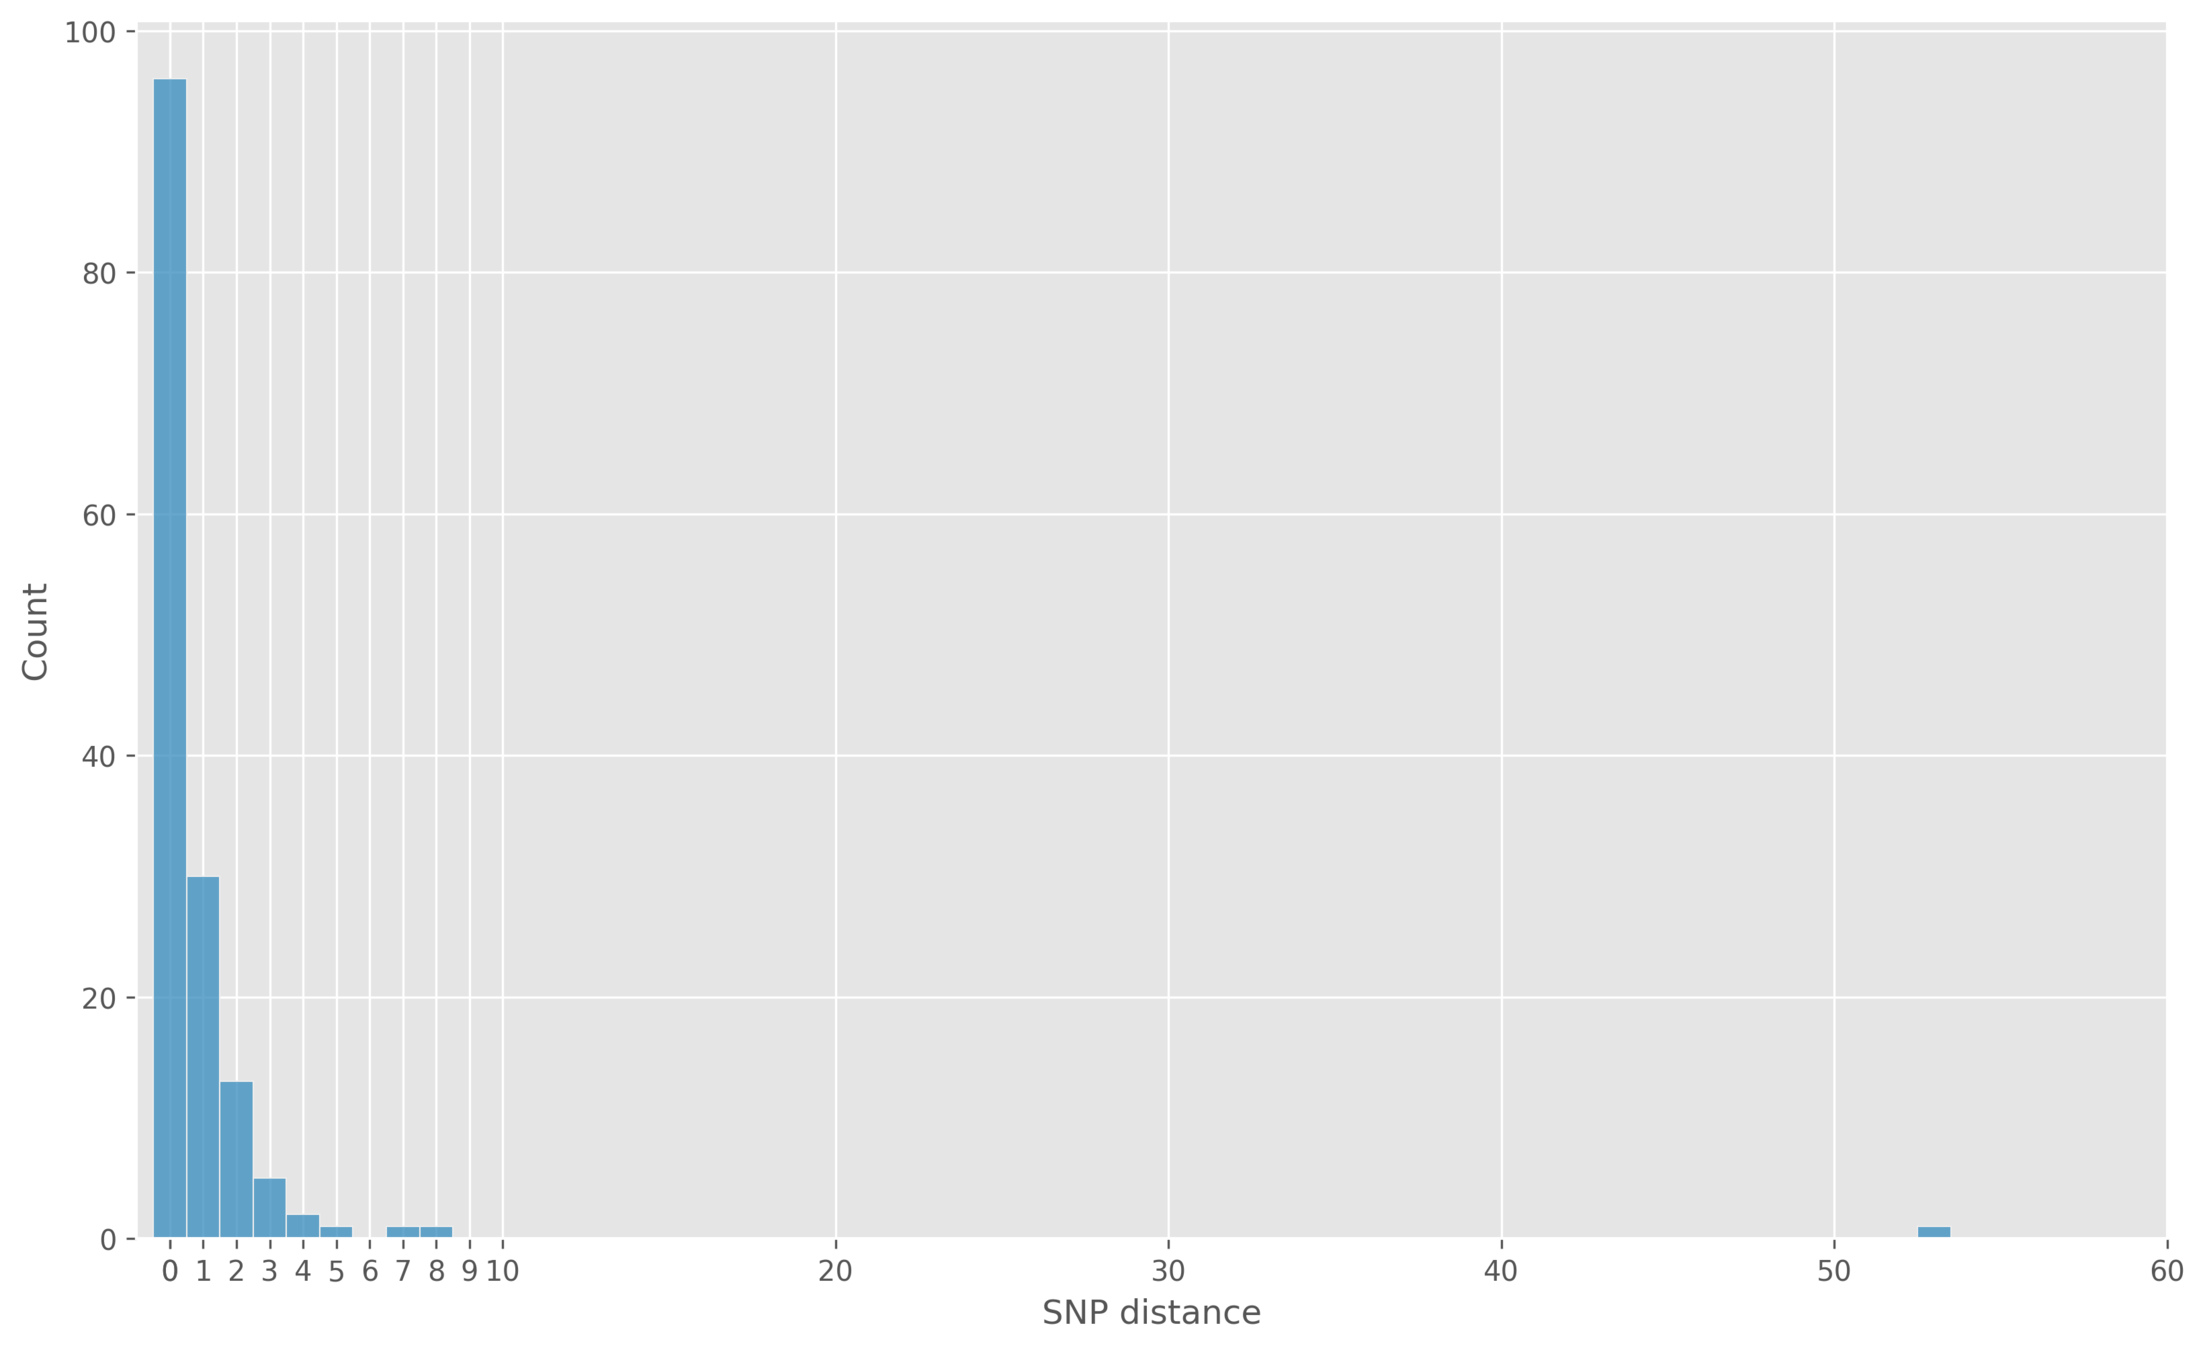
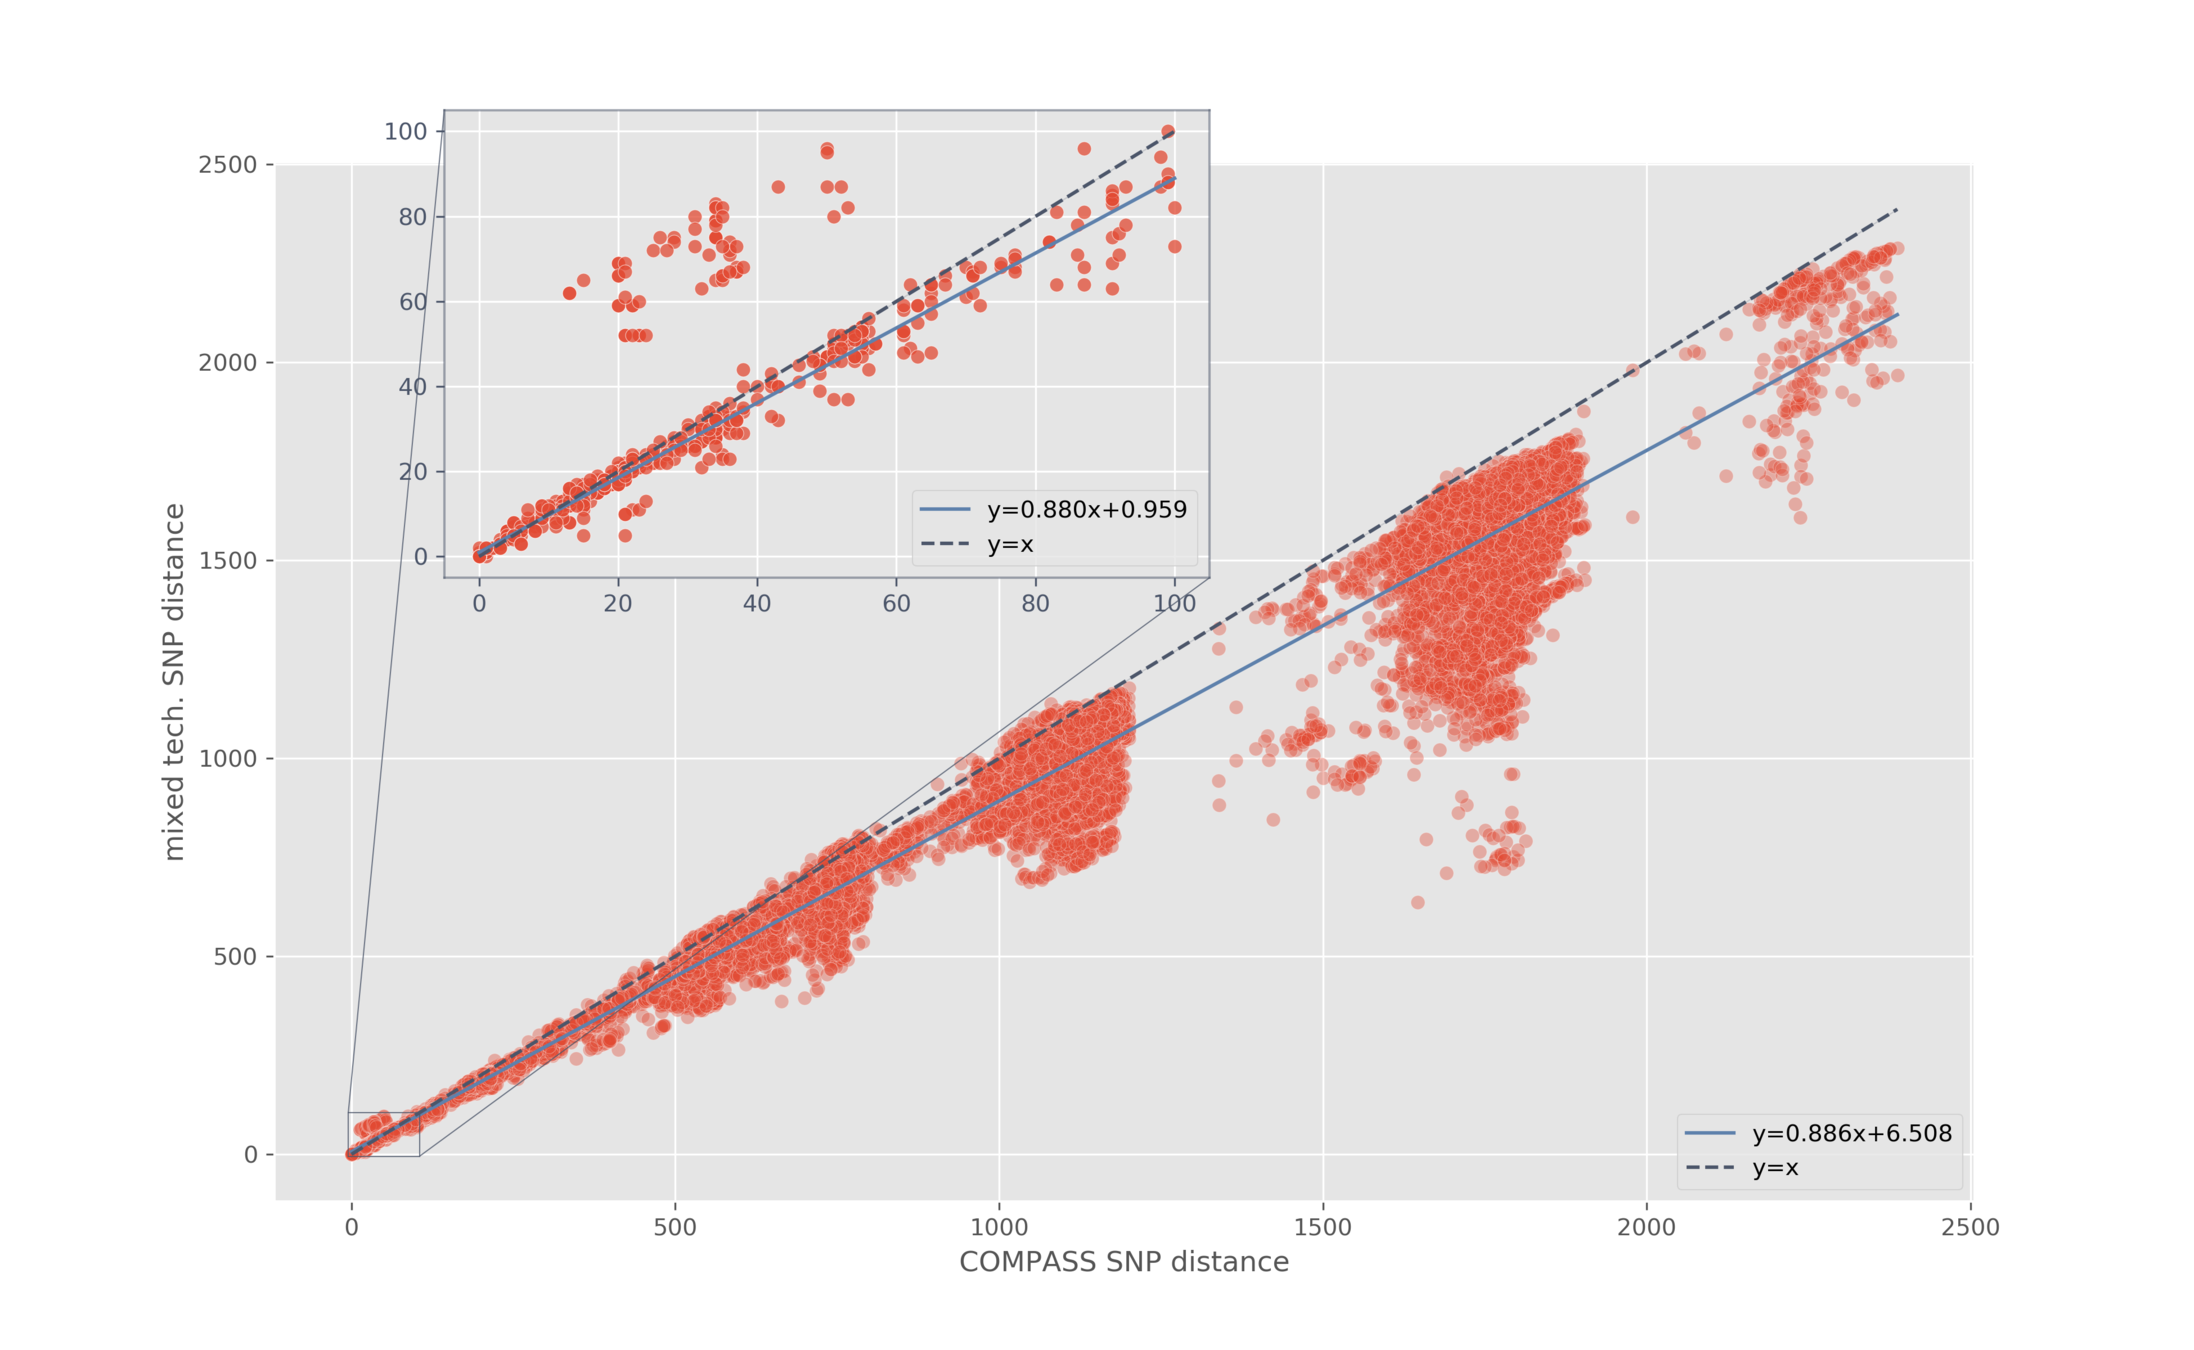
Pairwise SNP distance
- Generate consensus sequences
- Ignore filtered, masked, missing, and null calls
- Pairwise distance matrix (one for each modality)
Aim: do we see a linear relationship?
Pairwise SNP distance
SNP threshold clustering
Aim: produce Nanopore clusters consistent with Illumina
- Thresholds: 0, 2, 5, and 12 (11 ONT)
- Connect two samples if SNP distance ≤ threshold
- Assess clustering based on 3 metrics
SNP threshold clustering
C_I =
A sample's Illumina cluster
C_N =
A sample's Nanopore cluster
Recall (SACR):
\frac{|C_I \cap C_N|}{|C_I|}
Precision (SACP):
\frac{|C_I \cap C_N|}{|C_N|}
SNP threshold clustering
Excess Clustering Rate (XCR):
\frac{|S_I - S_N|}{|S_I|}
S_I =
Set of Illumina singletons
S_N =
Set of Nanopore singletons
SNP threshold clustering
Nanopore doesn't miss any clustered samples
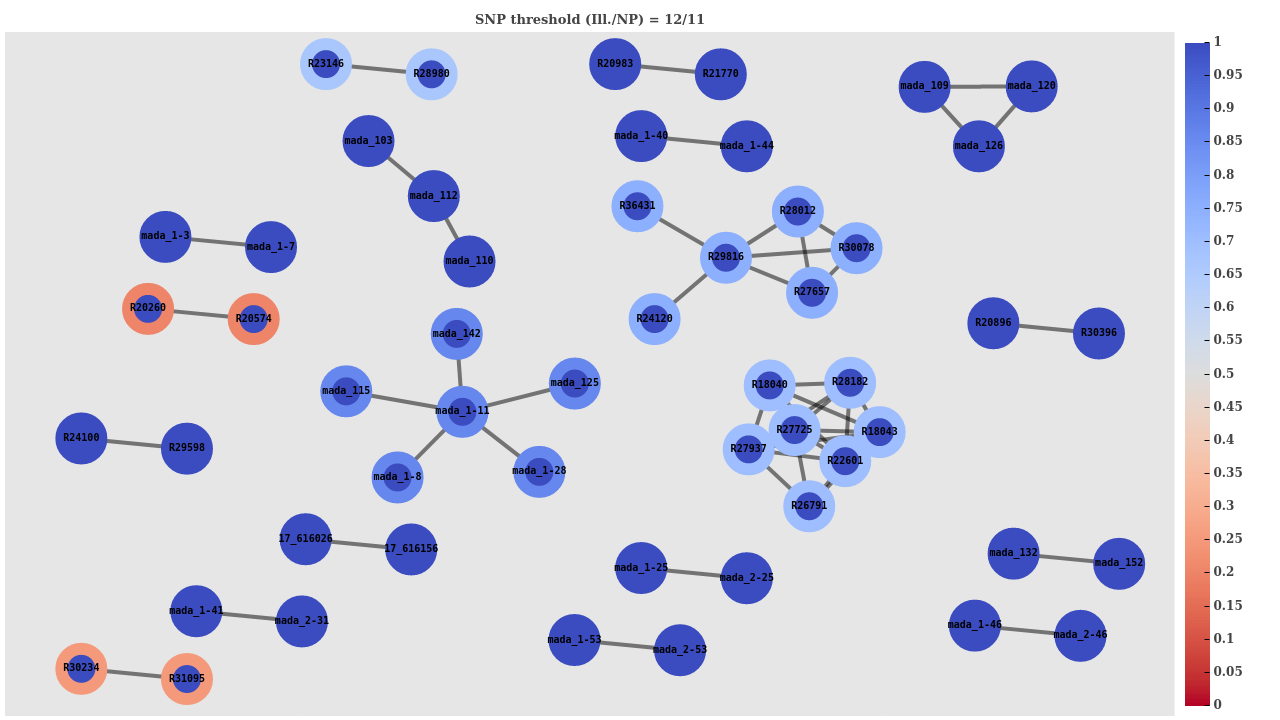
SACR: 1.0

SACP: 0.845

XCR: 0.031 (3/97)
SNP threshold clustering
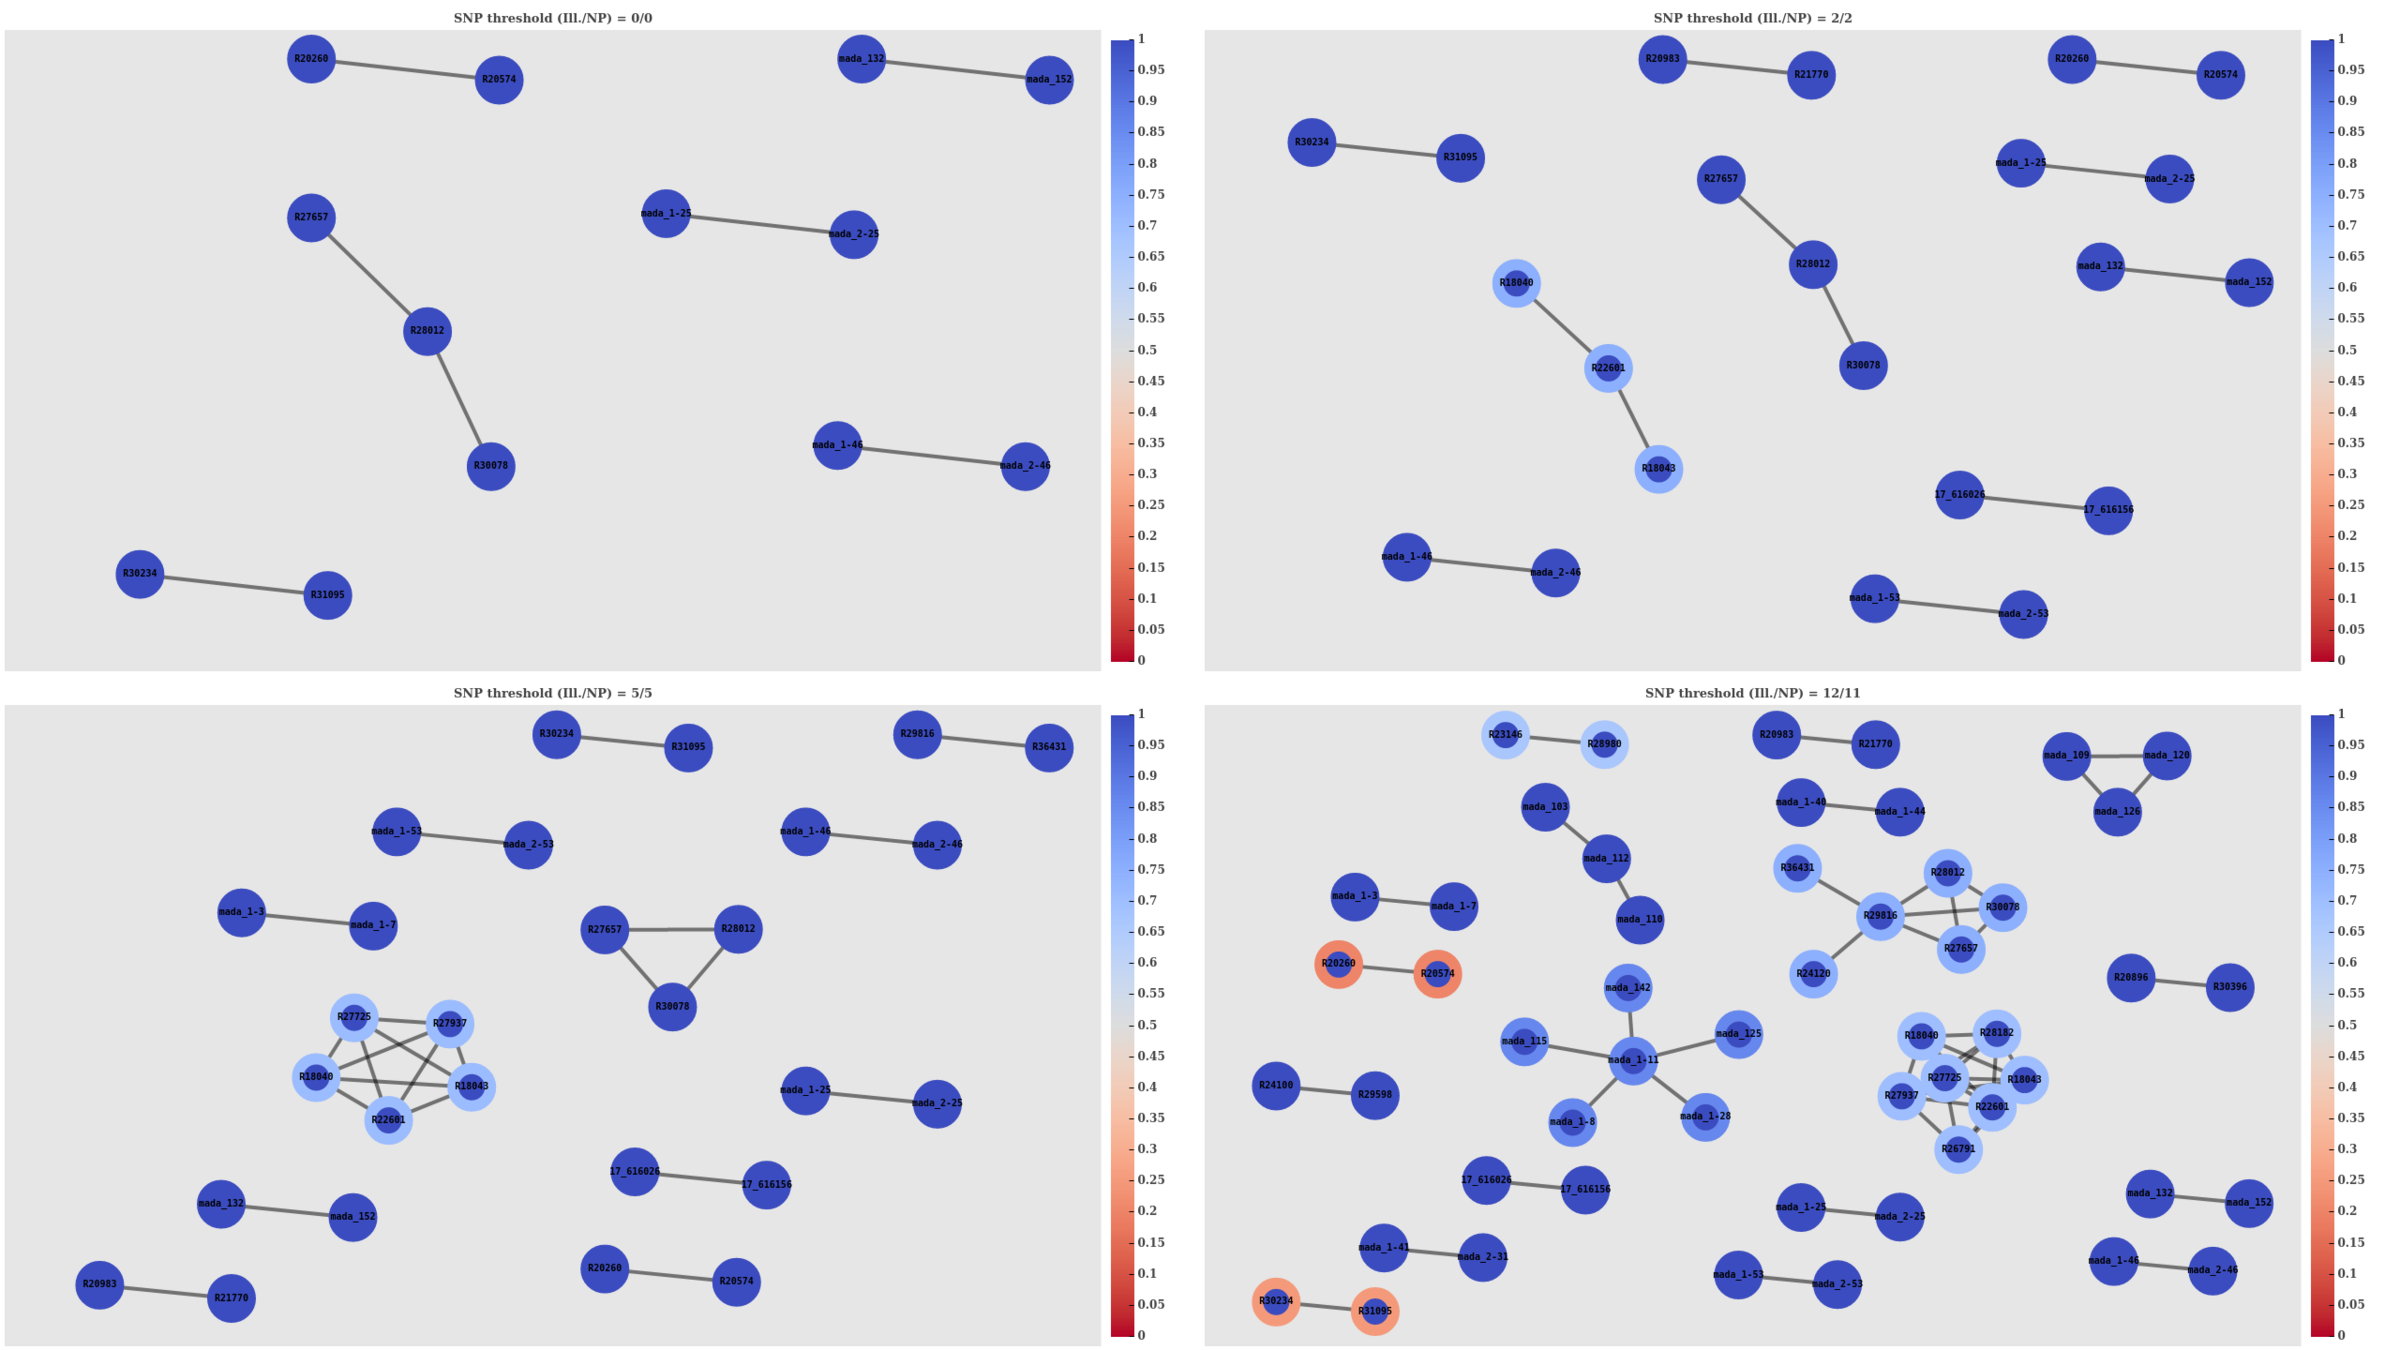
SACR: 1.0

SACP: 1.0

XCR: 0.015 (2/137)
SACR: 1.0

SACP: 0.966

XCR: 0.008 (1/128)
SACR: 1.0

SACP: 0.949

XCR: 0.057 (7/122)
SACR: 1.0

SACP: 0.845

XCR: 0.031 (3/97)
Nanopore doesn't miss any clustered samples
Mixing technologies
Aim: can you cluster Illumina and Nanopore data?
Mixing technologies
Self-distance
Mixing technologies
Pairwise SNP distance
Mixing technologies
Simulate various mixture ratios
Nanopore-to-Illumina ratios: 0.01, 0.05, 0.1, 0.25, 0.5, 0.75, 0.9
Mixed SNP thresholds same as Illumina
For each ratio/threshold combo, do the following 1000 times:
- Randomly assign samples to a tech. in given ratio
- Calculate SACR, SACP, and XCR for given threshold
Simulate various mixture ratios
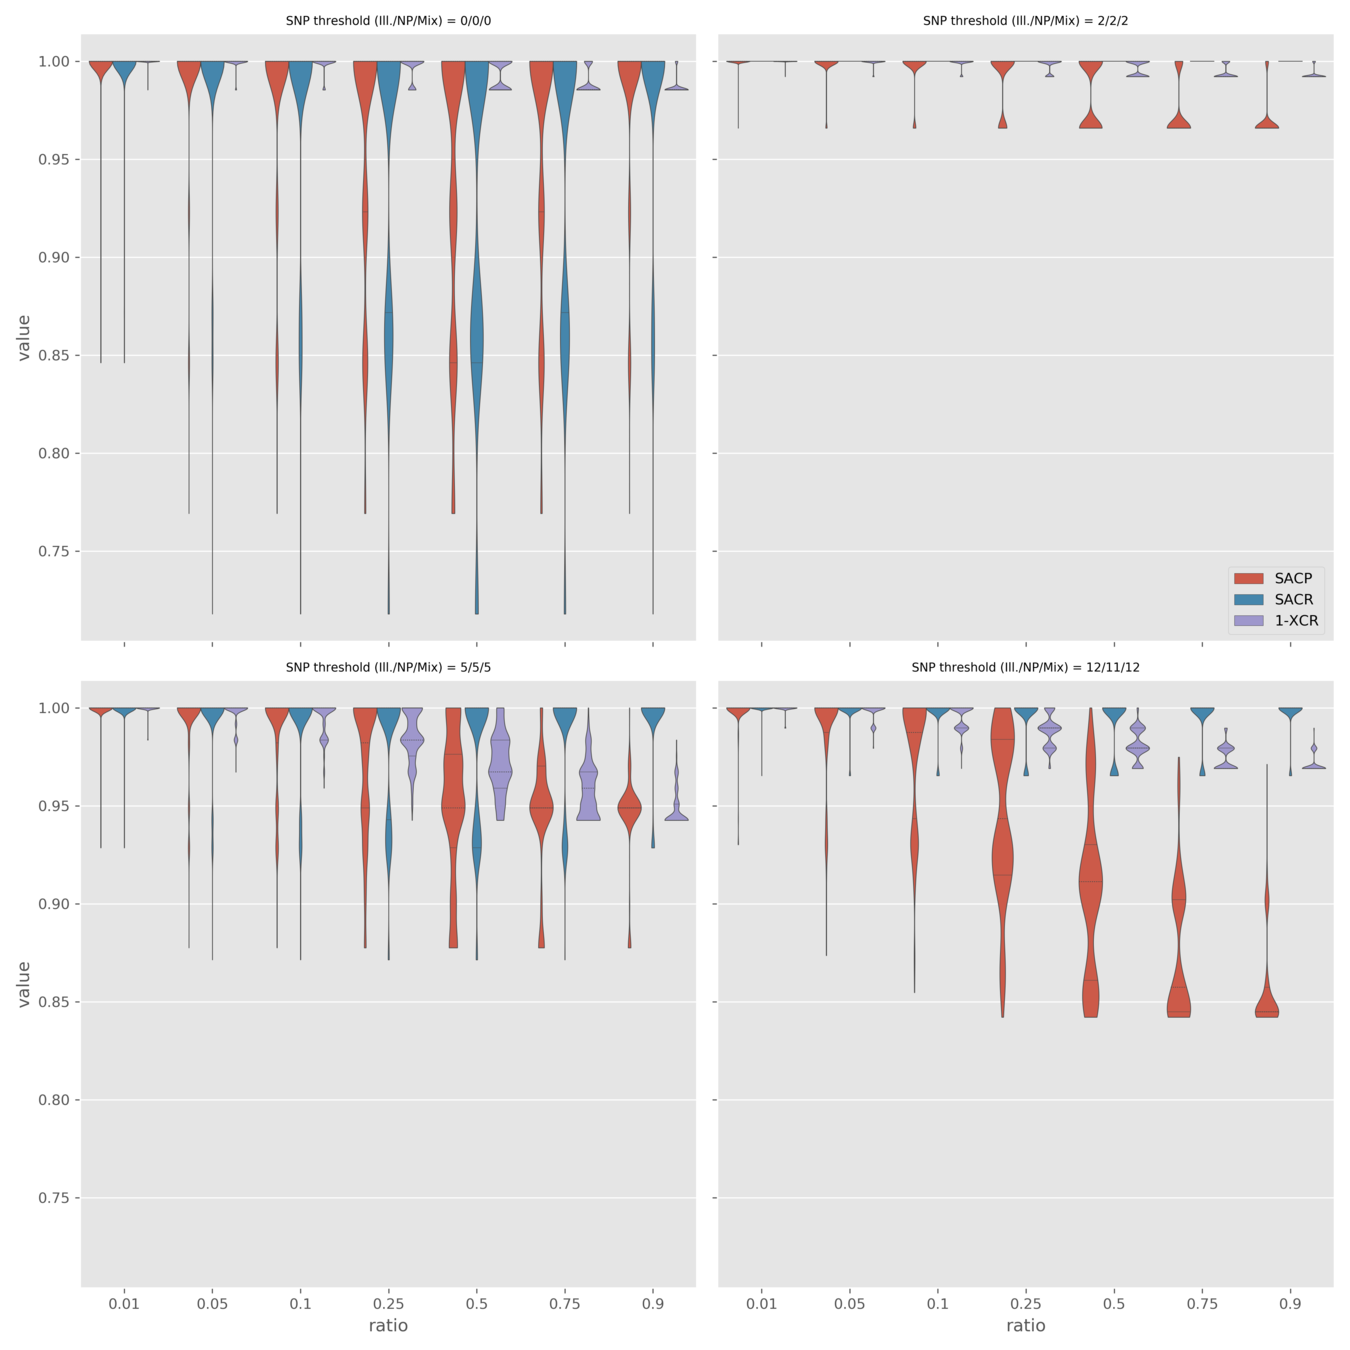
Simulate various mixture ratios
- SACR (median) 1.0 for all simulations
- Increasing Nanopore ratio moves median towards Nanopore-only SACP and XCR
- In the "worst" case, mixed tech. produces the same results as Nanopore-only
Summary
- Nanopore SNP precision on par with Illumina
- Nanopore SNP recall ~8% lower than Illumina
- No clustered samples are missed by Nanopore
- Mixing technologies is possible