Data Visualization
What, Why & How?
Gilles Tanson, Mustafa Kaptan
Visualization
What?
Visualization
to vis·u·al·ize:
to form a mental vision,
image, or picture
(of something not visible
or present to sight, or of
an abstraction)
to make visible to the
mind or imagination

Visualization - Why?
- Large amounts of data everywhere
- Social networks
- Climate simulations
- Medical scanners
- Present data in an understandable way
- Trends
- Outliers
Anscombe's Quartet
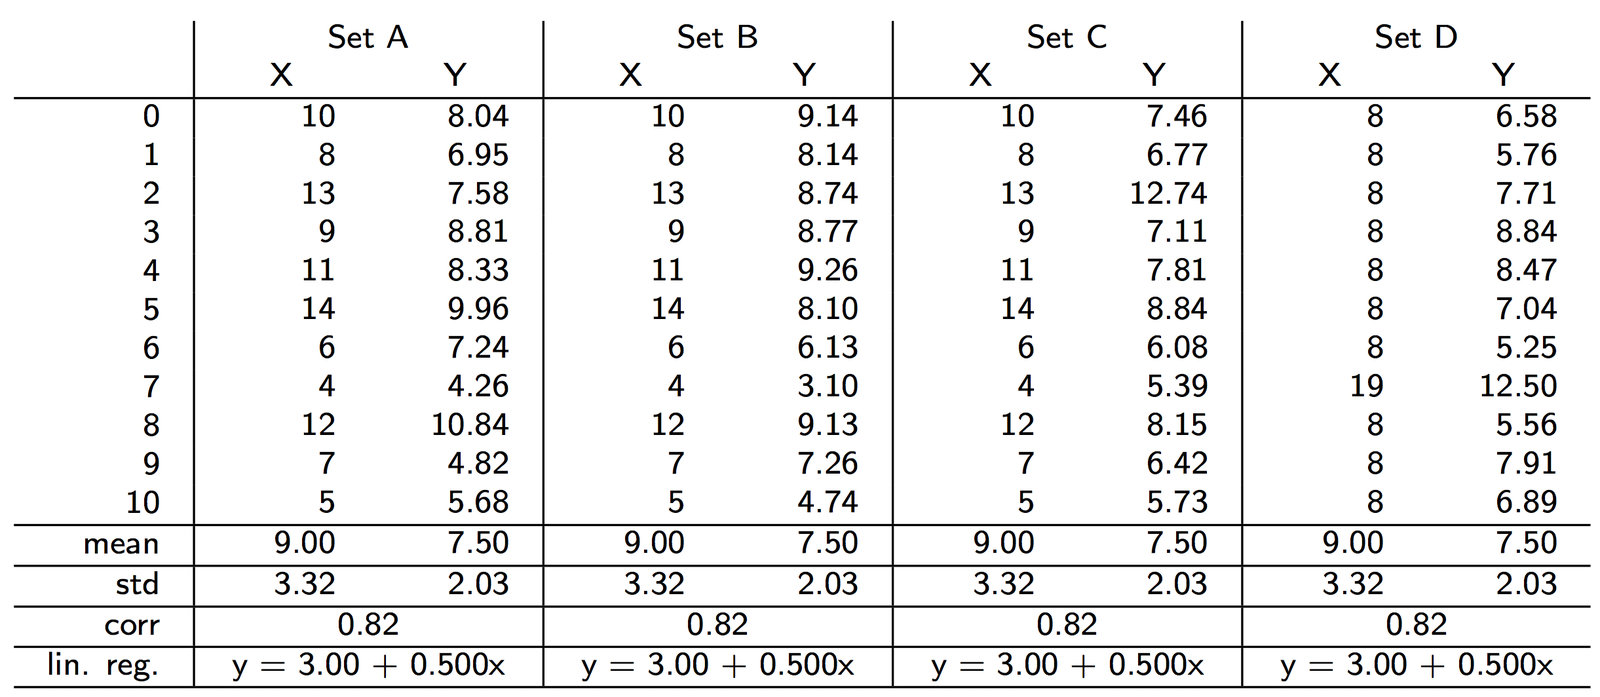
Anscombe's Quartet
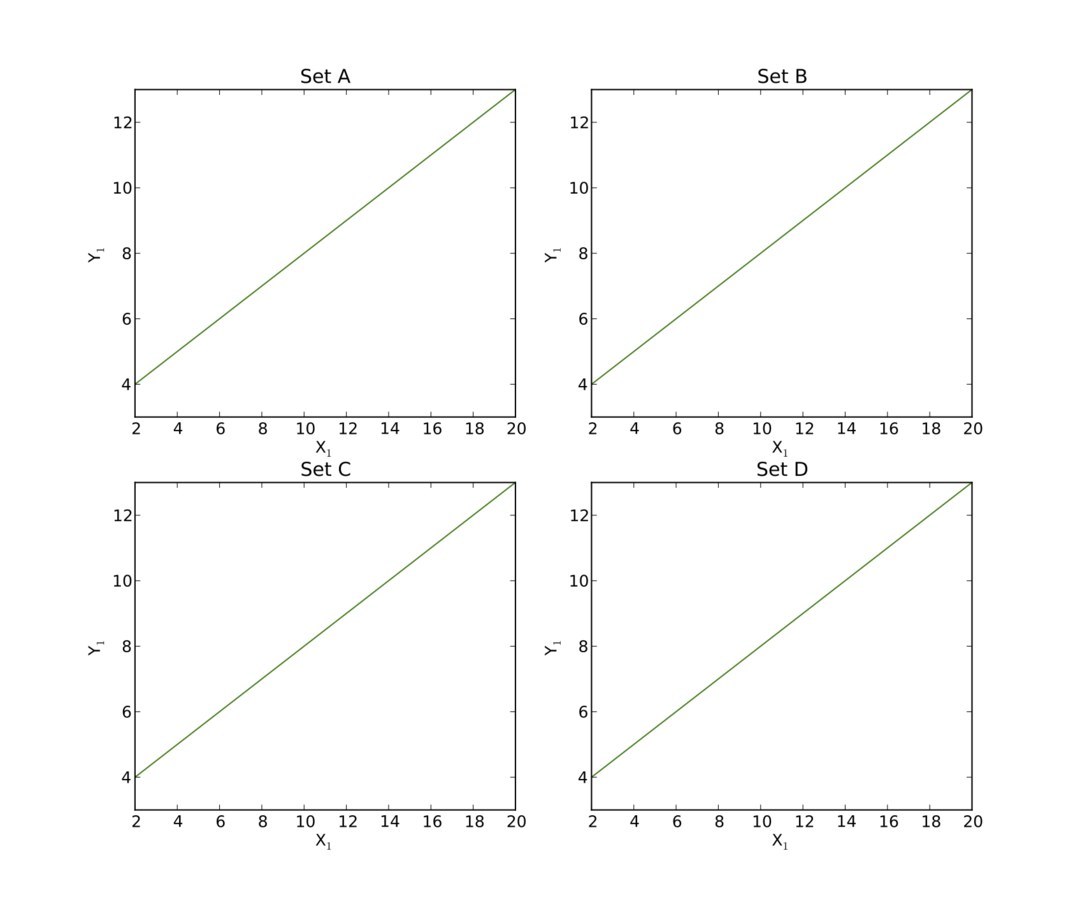
Anscombe's Quartet
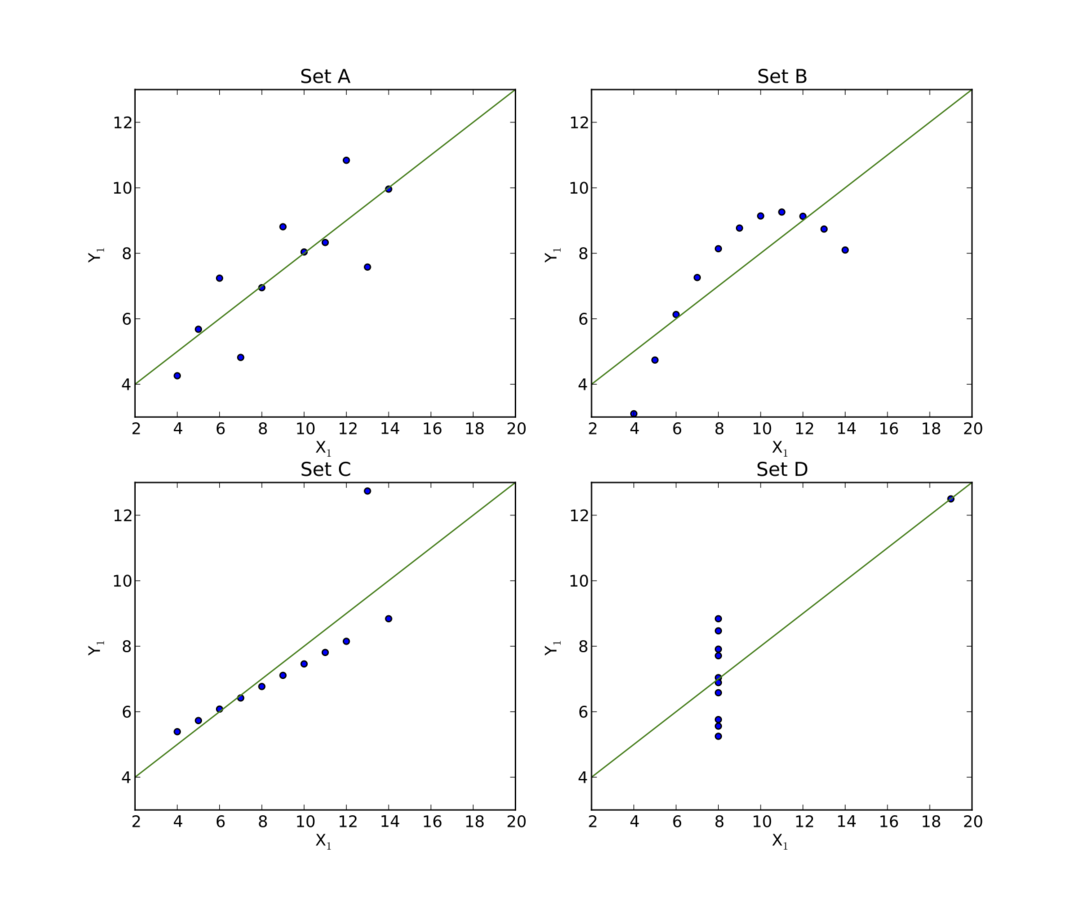
Examples
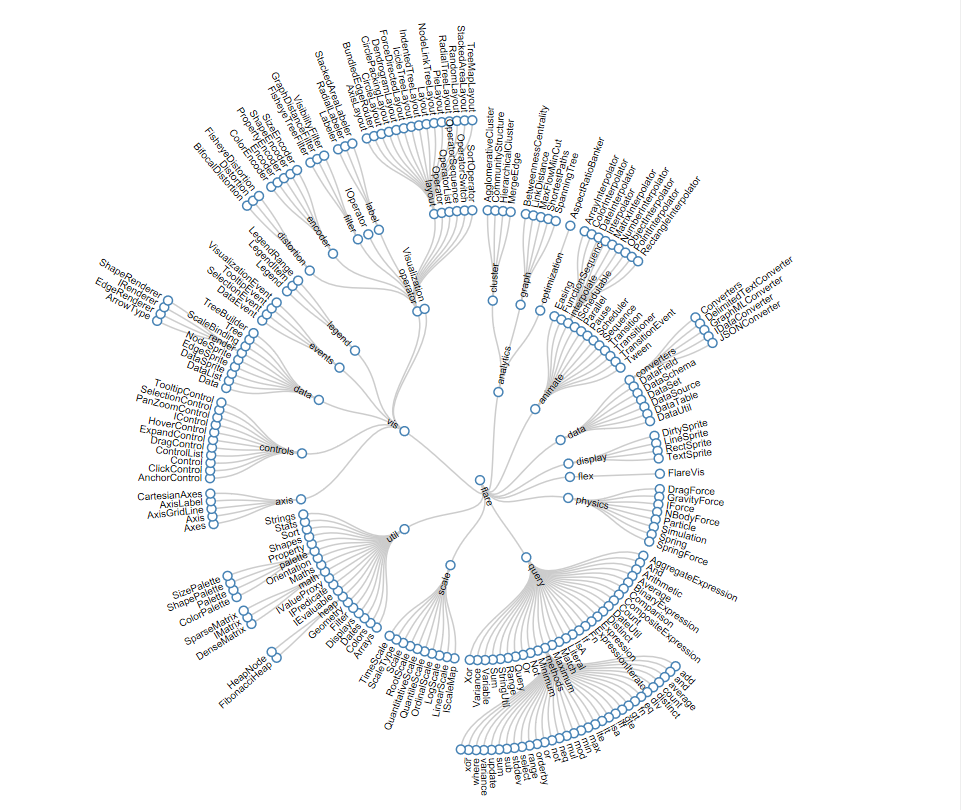
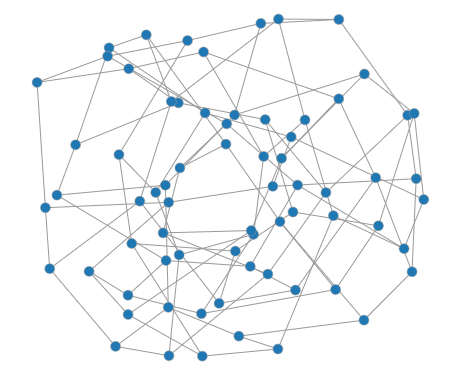
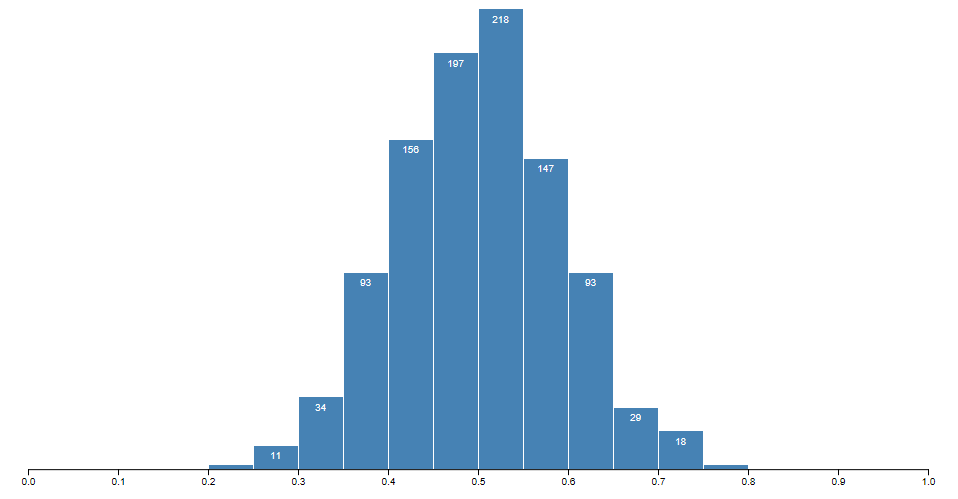

Visualization
How?
How ?
- Map data to a visual representation, consists of:
- Graphical primitives:
- Points
- Lines
- Areas
- Surfaces
- Visual Channels:
- Position
- Color
- Shape
- Size
- Slope
SVG - What?
- Scalable Vector Graphics
- Defines vector-based graphics in XML
- Embed into HTML (HTML5)
<html>
<body>

<svg width="100" height="100">
    <circle cx="50" cy="50" r="25"
            stroke="red" stroke-width="4"
            fill="yellow" />
</svg>

</body>
</html>
SVG - Basic Elements
- <rect>
- <circle>
- <ellipse>
- <line>
- <polyline>
- <polygon>
- <path>
- <text>
SVG - Renderıng
- Retained mode
- Client calls do not cause rendering
- Instead update an internal model
- list of objects
- Maintained within the library's data space
- Library optimizes rendering
- Overhead
SVG - Why?
- Scalable & resolution-independent
- Human readable
- Easily minified and GZipped
- Good browser support
- Photoshop like capabilities
- Styleable & interactive
- Is a W3C standard
- Integrates with DOM
- Accessible
DOM
- Document Object Model
- W3C (World Wide Web Consortium) standard
-
Can be accessed with JavaScript

Canvas
- Is part of HTML5
- Allows dynamic, scriptable rendering of 2D shapes and bitmap images
- Can display graphs, photo compositions, animations or real-time video processing/rendering
- Interactions (e.g CreateJS)
- Real-Time-Physics (e.g. PhysicsJS, Matter.js, Newton, etc.)
- Uses Immediate Mode to render objects
Canvas - Examples
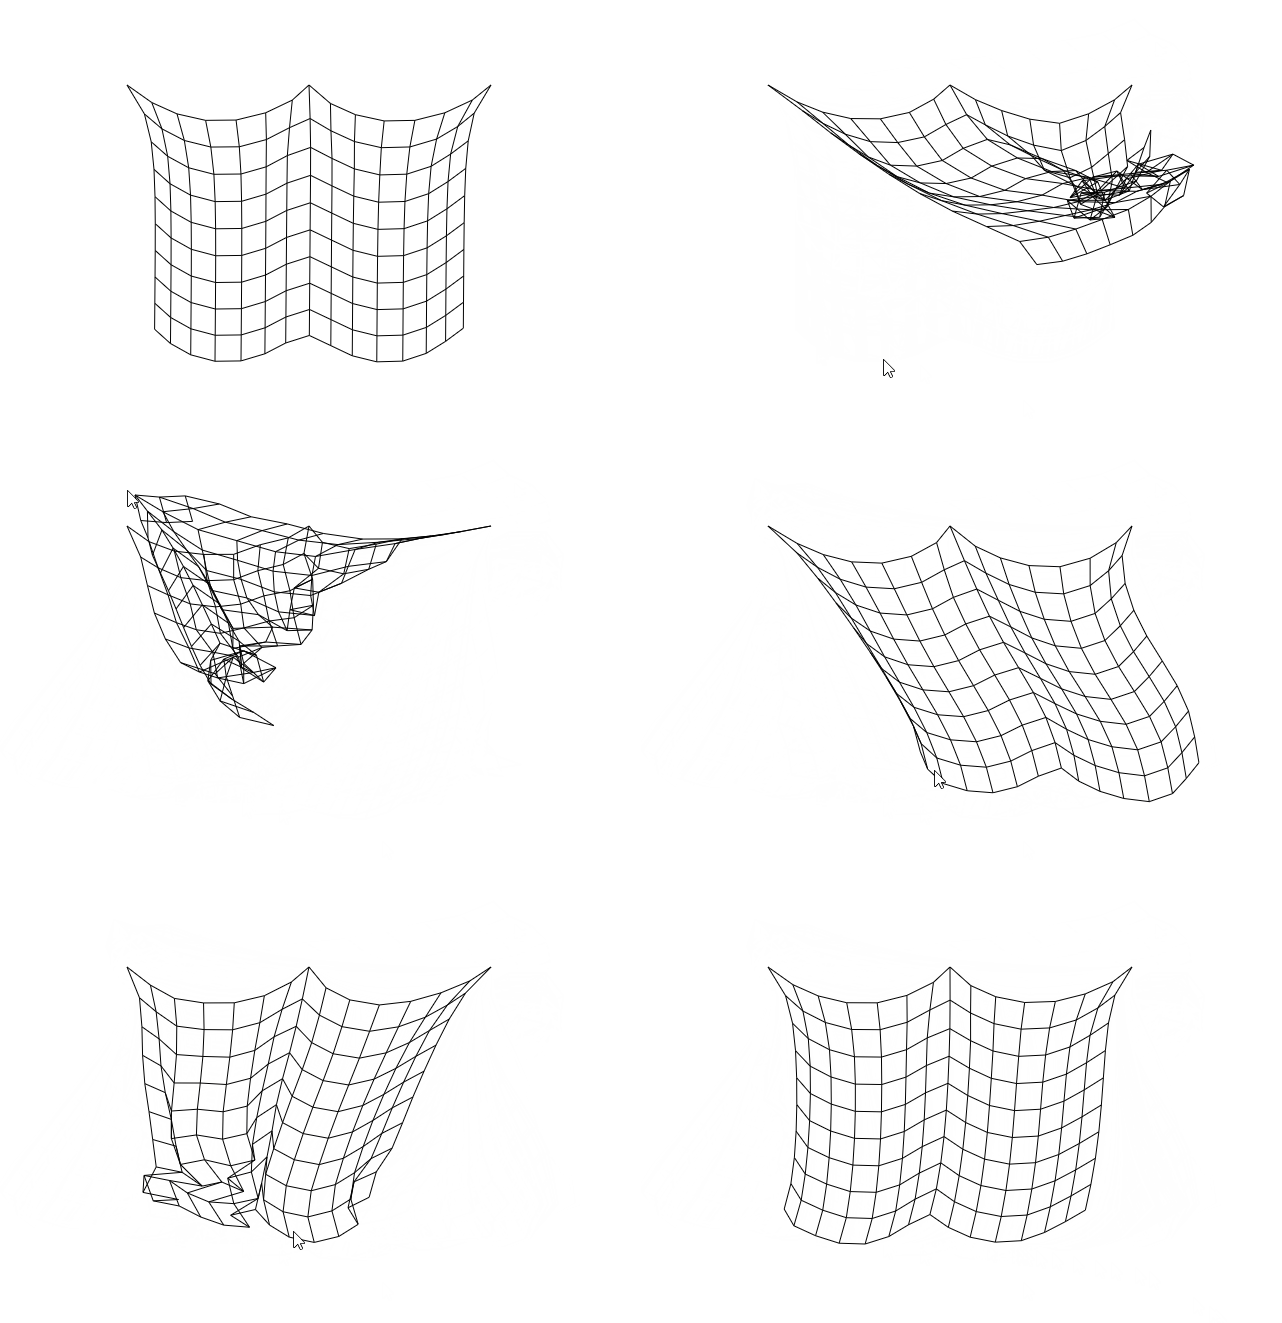

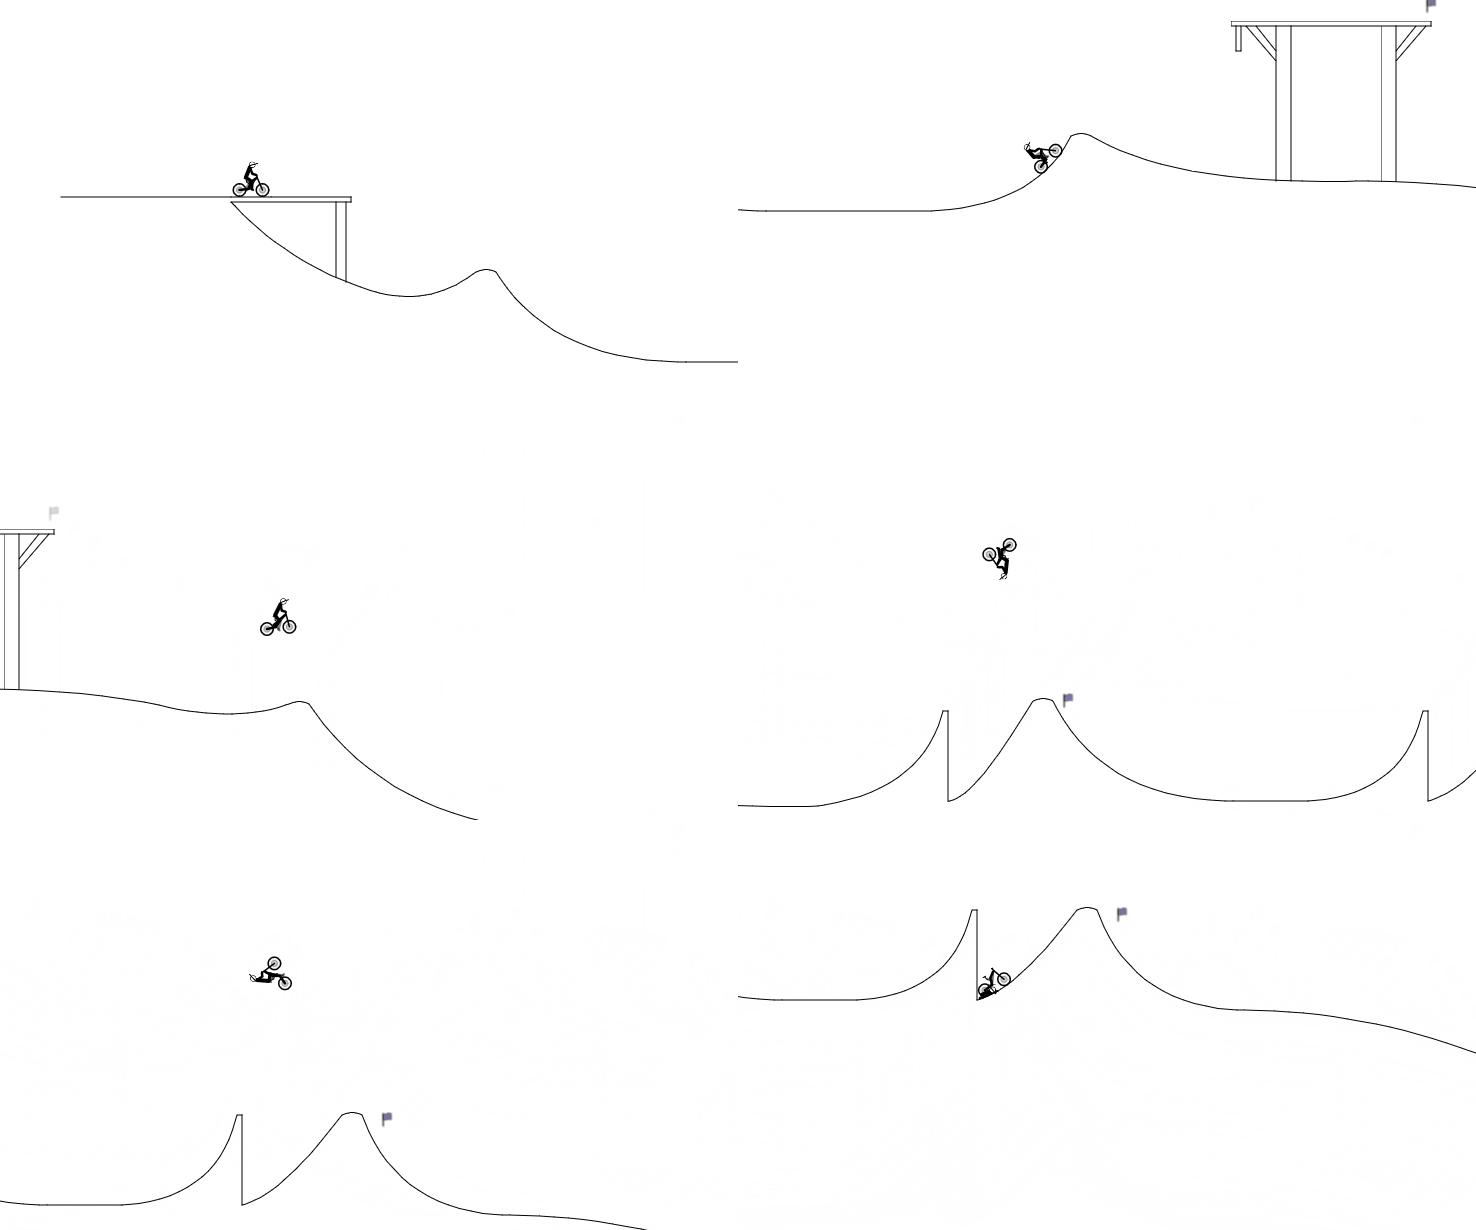
Source: https://code.tutsplus.com/articles/21-ridiculously-impressive-html5-canvas-experiments--net-14210
Canvas - Examples

Canvas - Code
<canvas id="myCanvas" width="800px" height="800px"></canvas>
<script type="text/javascript" src="script.js"></script>
var canvas = document.getElementById("myCanvas");
var context = canvas.getContext("2d");
context.fillStyle = green;
context.fillRect(10, 10, 100, 100);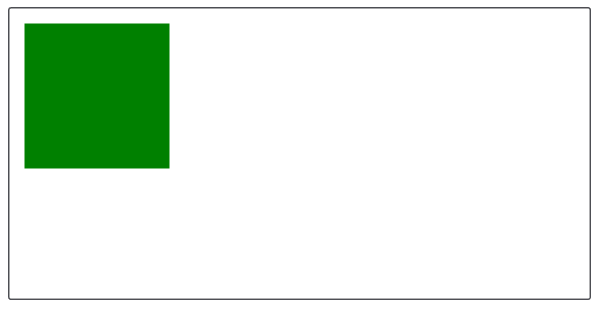
canvas {
  border: 1px solid black;
}
Canvas - Basic Elements
- Shapes
- context.arc(cX, cY, r, 0, 2 * Math.PI, false)
- context.fillRect()+
- Translation
- context.translate(x, y)
- Lines
- context.moveTo(x, y)
- context.lineTo(x, y)
- Draw Calls on Canvas
- context.stroke()
- context.fill()
Use cases
- Visualization of information: click on a node to view its contents (http://wineexplorer.brancottestate.com/, http://mcwhopper.com/)
Give a nice visual touch to the website (http://northapp.co/)
Promotion of a product (http://iamastronaut.ru/)
Mysterious visualizations (http://danielpow.com/)
All of these examples use the power of visualization to draw attention to their product. (or just for fun)
Comparison: SVG vs Canvas
Pros:
-
CSS can control appearance
-
Can be drawn with Programs like Adobe Illustrator
-
Drawings can be interpreted (XML)
-
Possesses DOM
-
Keeps image quality
- Resolution independent
Cons:
- Not meant for pixel manipulation
- Large file size (XML document)
Comparison: SVG vs Canvas
Pros:
- Works with JavaScript: more efficient
-
2 or 3 dimensional (bitimage)
-
Manipulation of single pixels
Cons:
- Has no DOM
- Drawings cannot be interpreted (only a bunch of pixels)
- Resolution dependent
Visualization
d3.JS Library
D3.js
- Data-Driven Documents
- Mike Bostock
- latest version (4.2.5) - (21.09.2016)
- Bind data to DOM
- Apply transformations


D3.js + SVG
d3.select("body")
  .append("svg")
  .attr("width", 100)
  .attr("height", 100)
  .append("circle")
  .attr("cx", 50)
  .attr("cy", 50)
  .attr("r", 25)
  .style("fill", "yellow");
d3.js - selectıon
d3.select(selector)  // Selects the first element
// Returns "selection" -> subclass of array
// Empty selection if no match
// Selector can be a selector string
var anchor = d3.select("a");

// Selector can be a reference (this, document.body)
d3.selectAll("p").on("click", function() {
  d3.select(this).style("color", "red");
});

d3.selectAll(selector)  // Selects all elements

// Selector can be a string
var paragraph = d3.selectAll("p");

// Or a reference (this.childNodes, document.links)
d3.selectAll(document.links).style("color", "red");
d3.js - Selection
var paragraphs = document.getElementsByTagName("p");

for (var i = 0; i < paragraphs.length; i++) {
  var paragraph = paragraphs.item(i);
  paragraph.style.setProperty("color", "red", null);
}
W3C:
D3.js
d3.selectAll("p").style("color", "red");D3.js - Method chaınıng
var body = d3.select("body");
body.style("color", "black");
body.style("background-color", "red");
d3.select("body")
.style("color", "black")
.style("background-color", "red");D3.js - Example
- What do we want?
- Scatterplot
- What do we have?
- Data array
[{"x": 1.0, "y": 1.1},
 {"x": 2.0, "y": 2.5},
 {"x": 3.0, "y": 3.6},
…]
d3.js - example
d3.scatterplot(data)  // Deprecated

d3.awesomeScatterplot(data)  // Awesome
Nope.
d3.js - example
svg.selectAll("circle")
  .data(data)
  .enter().append("circle")
    .attr("cx", function(d) { return d.x; })
    .attr("cy", function(d) { return d.y; })
    .attr("r", 10);
Q: But we don't have any circles yet, how did we selectAll ?

d3.js - example
Instead of telling D3 how to do something, tell D3 what you want.
- Mike Bostock

D3.js - Data joın
- Circle elements to correspond to data
- One circle per datum
- Tell D3: "circle" corresponds to data
- Data join
D3.js - Data joın
- Data + Existing elements -> UPDATE
- Unbound data -> ENTER
- Unbound elements -> EXIT
Text
enter
exıt
update
data
elements
d3.js - example
svg.selectAll("circle")  // New empty selection

   .data(data)  // Join data -> enter, update, exit
   // Empty selection -> Update, Exit are empty
   // Enter contains a placeholder for each new datum

   .enter()  // Enter selection
   .append("circle") // Append circles for each datum

   .attr("cx", function(d) { return d.x; })
   .attr("cy", function(d) { return d.y; })
   .attr("r", 10);
Hard coded HTML
<div class="chart">
  <div style="width: 40px;">4</div>
  <div style="width: 50px;">5</div>
  <div style="width: 70px;">7</div>
  <div style="width: 80px;">8</div>
  <div style="width: 60px;">6</div>
  <div style="width: 30px;">3</div>
</div>
var data = [4, 5, 7, 8, 6, 3];
d3.select(".chart") // Empty selection
.selectAll("div") // Empty selection
.data(data) // Join data, get enter
.enter().append("div") // Select enter, append div
.style("width", function(d)
{ return d * 10 + "px"; })
.text(function(d) { return d; });D3.js

Project - Issues
- Communication between the groups
- To develop one app for 3 platforms is a difficult task
-
Integration of Features difficult because every group has a different approach
-
Server problems
-
Being up to date in every group
- Which framework should we use (start issues)
Project - Issues
Project - Issues

Lessons learned
- Better Communication with other groups
- More meetings in person!
- Hackathons
-
Rather have fast decisions than the "best" decisions
-
Every group needed to have a contact person
-
Why we switch to webpack?
- “Makes it possible to require() text files like our css files as strings”
Sources
- By Birger Eriksson - Own work, CC BY-SA 3.0, https://commons.wikimedia.org/w/index.php?curid=18034500
- http://www.w3schools.com/graphics/svg_intro.asp
- https://d3js.org/
- bost.ocks.org/mike/
- http://codepen.io/antonietta/pen/BjGWYx
- https://code.tutsplus.com/tutorials/an-introduction-to-the-raphael-js-library--net-7186
- https://onepagelove.com/tag/html5-canvas
Thanks!
questions?
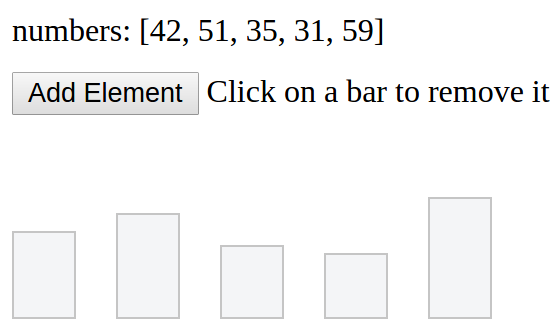
d3.js - update & exıt
- http://niceone.org/examples/d3-selections/
var numbers = [15, 8, 42, 4];

// Updates the visualization
function update() {

  // Update selection: Resize and position existing
  // DOM elements with data bound to them.
  var selection = d3.select("#chart")
    .selectAll(".bar").data(numbers)
    .style("height", function(d){
      return d;
    })
    .style("margin-top", function(d){
      return 100 - d;
    });

  // Enter selection: Create new DOM elements for added
  // data items, resize and position them and attach a
  // mouse click handler.
  selection.enter()
    .append("div").attr("class", "bar")
    .style("height", function(d){
      return d;
    })
    .style("margin-top", function(d){
      return 100 - d;
    })
    .on("click", function(e, i){
      numbers.splice(i, 1);
      update();
    });

  // Exit selection: Remove elements without data from the DOM
  selection.exit().remove();

  // Update text field for display of current data set
  d3.select("#data-field").text("numbers: [" + numbers.join(", ") + "]")

};

update();


// Add a new datum to the set
d3.select("#add-btn").on("click", function(e){

    numbers.push(Math.round(Math.random() * 100));

    update();
});
SVG BROWser support

Raphael.js
- Raphaël object manages drawings in the canvas
- Can draw vector graphics (SVG)
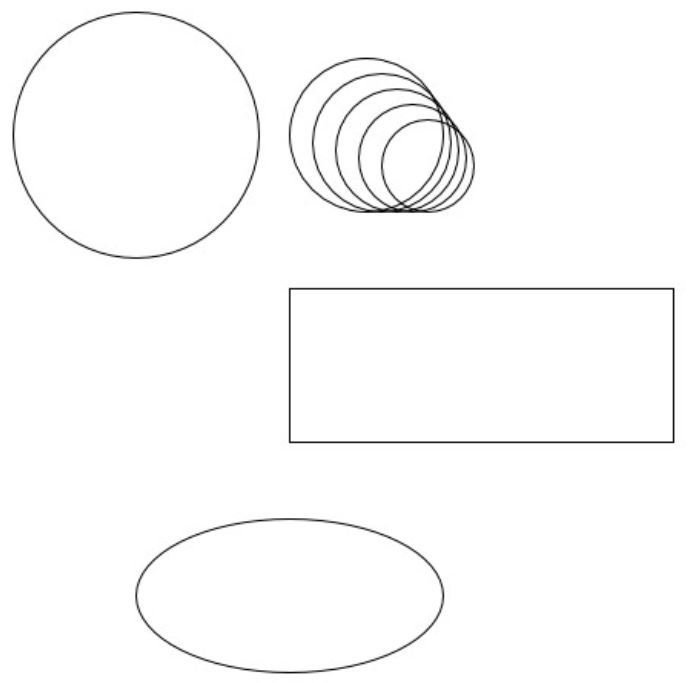
var paper = new Raphael(document.getElementById('canvas_container'),
            500, 500);
var circle = paper.circle(100, 100, 80);
for(var i = 0; i < 5; i+=1) {
    var multiplier = i*5;
    paper.circle(250 + (2*multiplier), 100 + multiplier,
    50 - multiplier)
}
var rectangle = paper.rect(200, 200, 250, 100);
var ellipse = paper.ellipse(200, 400, 100, 50);