Application Programming Interfaces

Outline
Review
APIs and RESTful APIs
Spotify
{review}

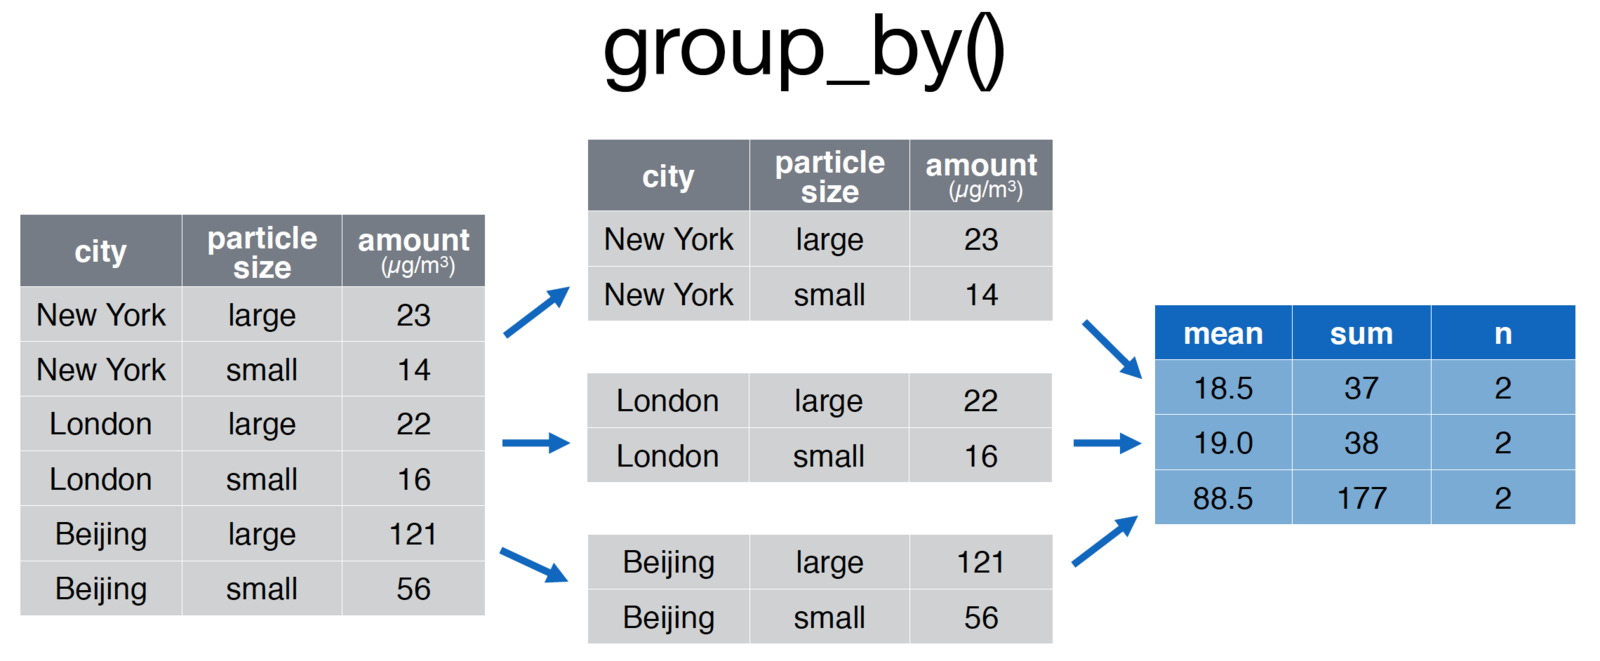
credit: Nathan Stephens, Rstudio
# Group the pollution data.frame by city for comparison
pollution <- group_by(pollution, city) %>%
               summarise(
                mean = mean(amount, na.rm = TRUE),
                sum = sum(amount, na.rm = TRUE),
                n = n()
            )
Joins
{exercise 1}
{APIs}
API
Application Programming Interface
Protocols, tools for building software
Exposes components in specified formats

Google Maps API

Google Maps API: in R!
# install.packages('ggmap')
library(ggmap)
qmap('Seattle')
RESTful APIs
Representational State Transfer APIs
Exposes data components
Transfer data with HTTP (typically)
Facilitates web-queries of content

How it works
Navigate to a URL
Return information (JavaScript Object Notation)
https://api.spotify.com/v1/search?q=adele&type=artist{
artists: {
href: "https://api.spotify.com/v1/searc...",
items: [{
external_urls: {
spotify: "https://open.spotify...."
},
followers: {
href: null,
total: 4093432
},
}
}Using RESTful APIs in R
Determine URL
Read in result with fromJson
# Base URL of API
base <- 'https://api.spotify.com/v1/search?'

# Parameters
search <- 'q=adele'
type <- '&type=artist'

# Query string
query_url <- paste0(base, search, type)
# Read in data
library(jsonlite)
data <- fromJSON(query_url)
{exercise 2}
Flattening
# Let's do something silly
people <- data.frame(names = c('Spencer', 'Jessica', 'Keagan'))
favorites <- data.frame(
                food = c('Pizza', 'Pasta', 'salad'),
                music = c('Bluegrass', 'Indie', 'Electronic')
            )

people$favorites <- favorites
# Columns of our people data.frame
names(people)
[1] "names"     "favorites"

# Flatten it!
flattened <- flatten(people)
names(flattened)
[1] "names"    "favorites.food"  "favorites.music"