D3.js: Part II
{review}
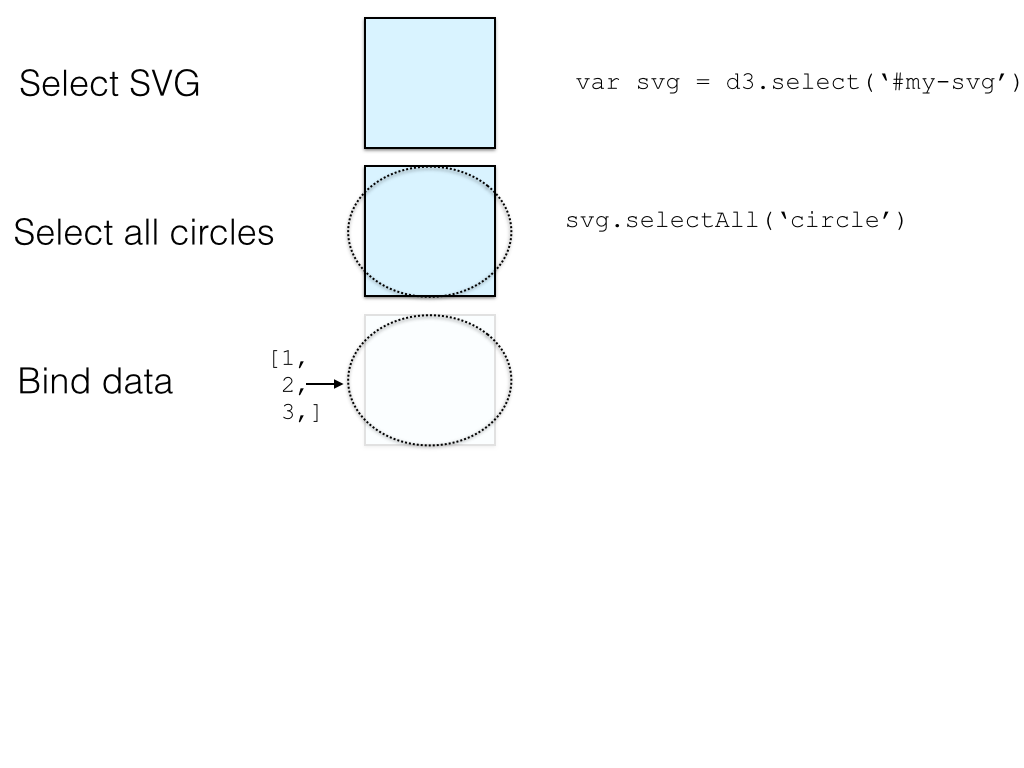
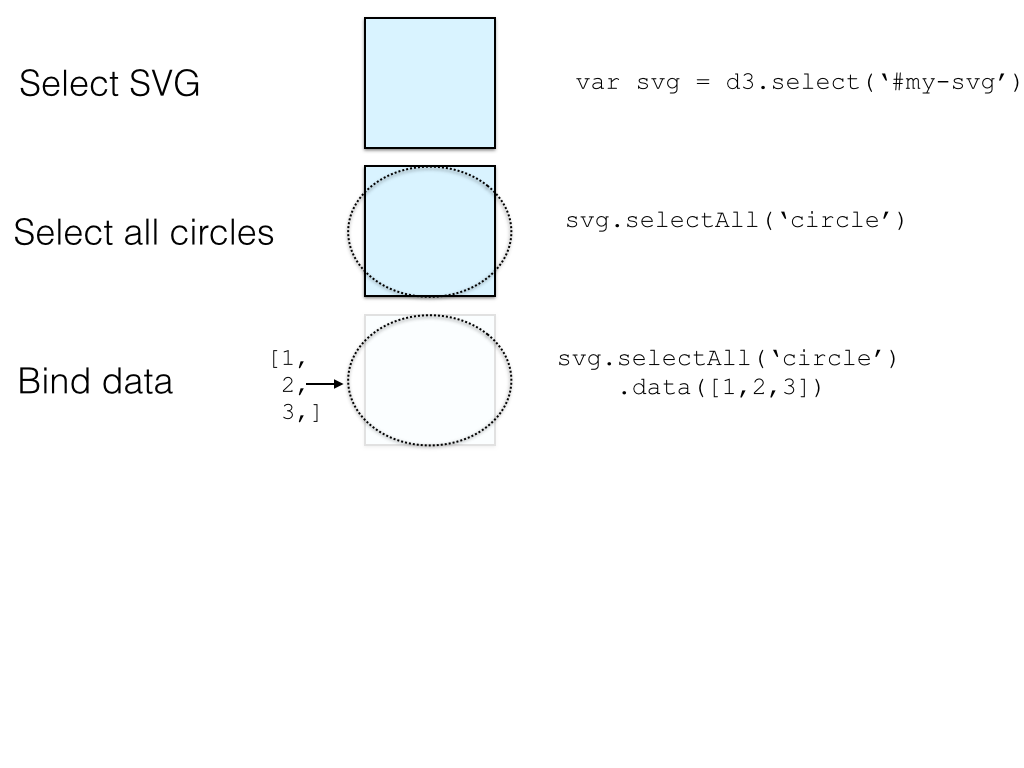
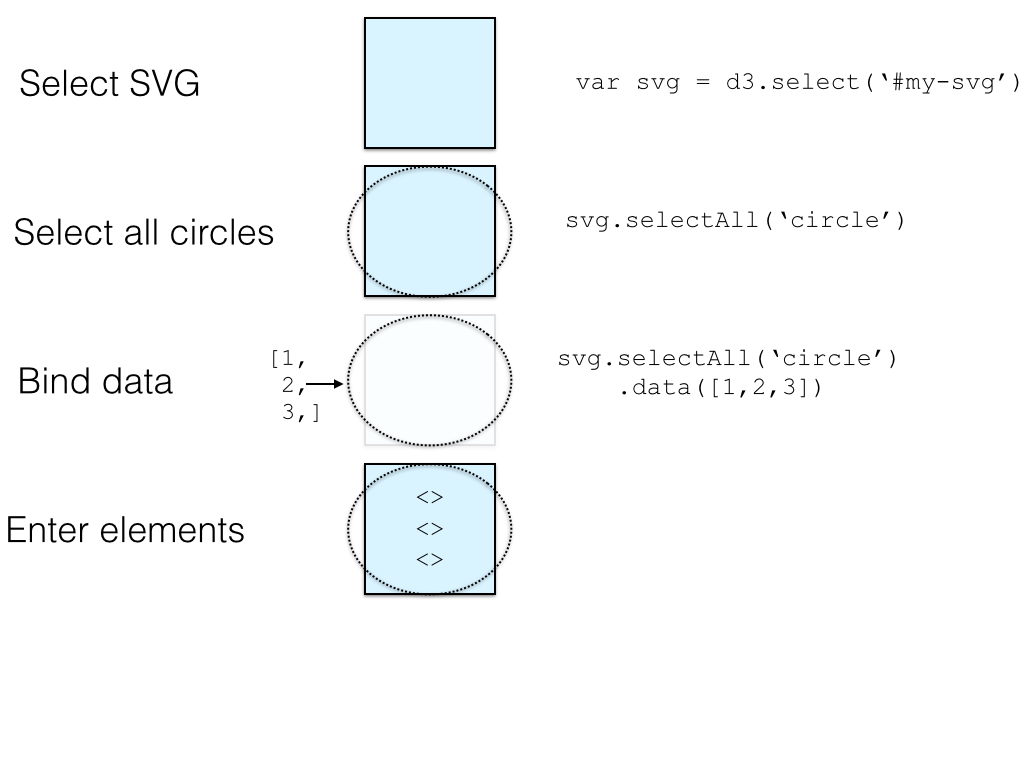
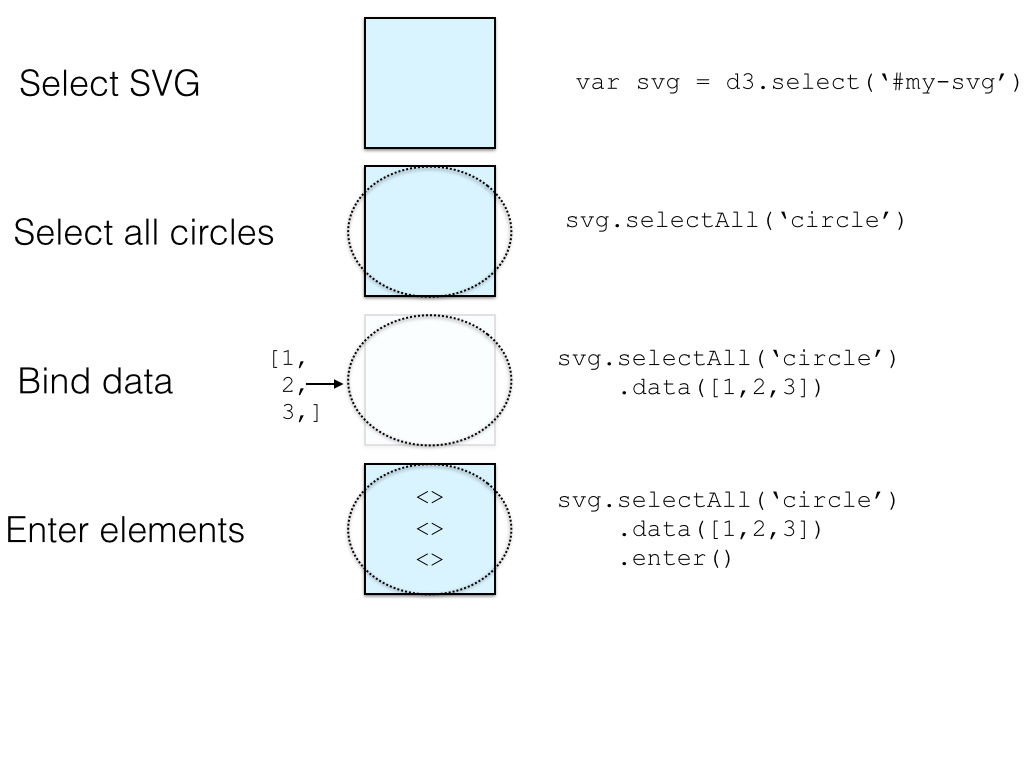
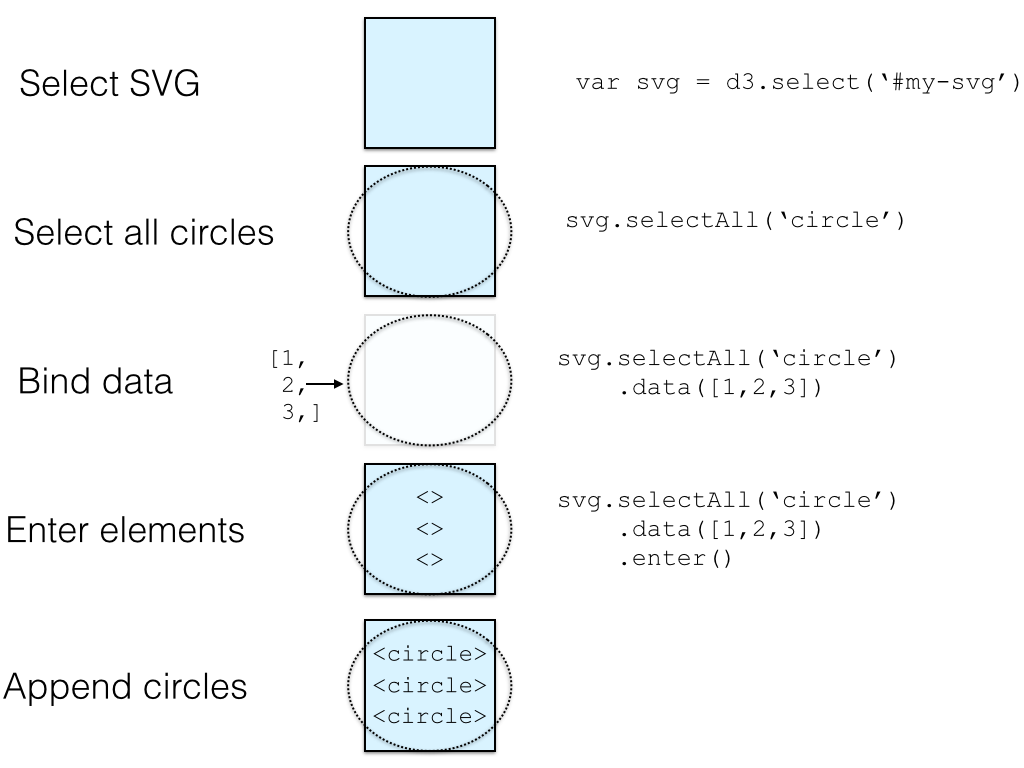
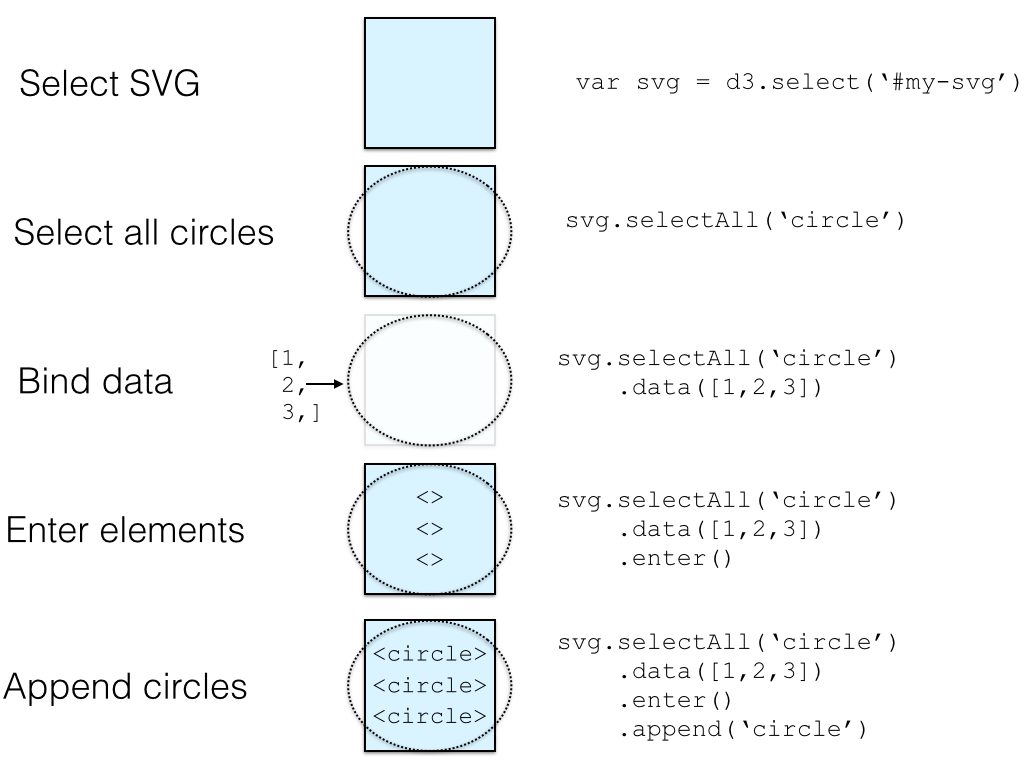
Generalizing
var draw = function(data) {
    // Bind data you pass in
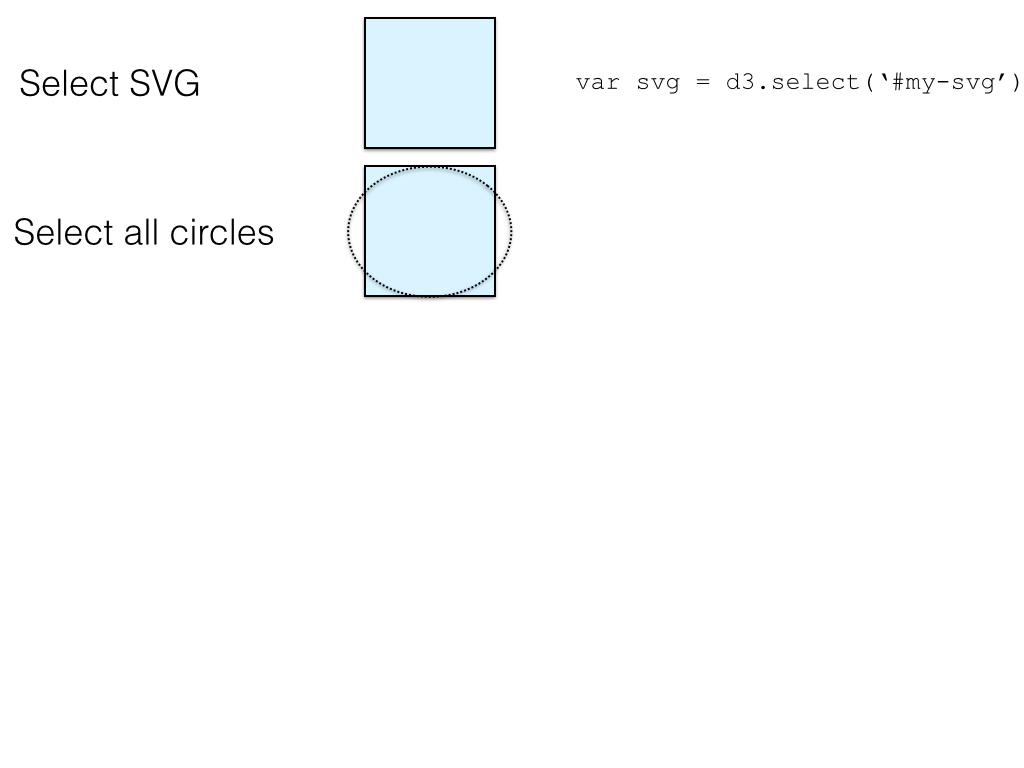
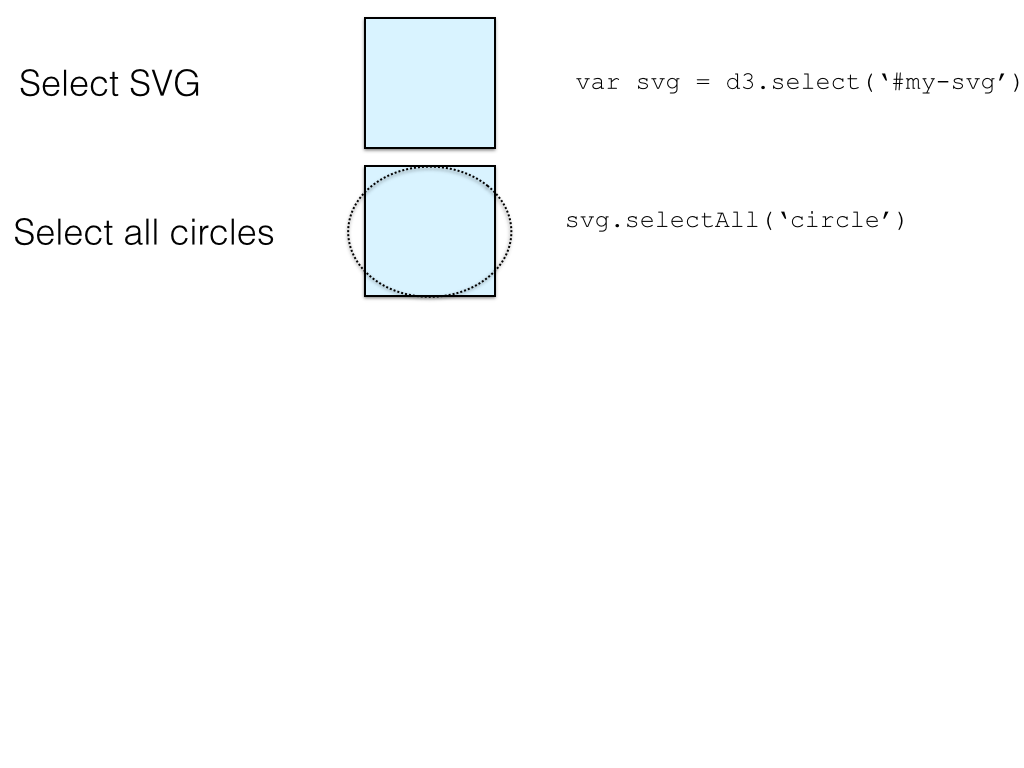
    var circles = svg.selectAll('circle').data(data)

    // Enter new elements
    circles.enter().append('circle').call(circleFunc)

    // Exit elements that may have left
    circles.exit().remove()

    // Transition all circles to new position
    svg.selectAll('circle').transition()
        .duration(1500).call(circleFunc)
}
Scales
Map from an input domain to an output range
Axes are visual representations of scales
Functions that translate from a data space to a visual space
Defining a scale
Define the domain of the scale (data space)
var myScale = d3.scale.linear()Define the range of the scale (visual space)
xScale.range([0, width])Define a variable as a scale function
xScale.domain([dataMin, dataMax])Pass in a data value to return a value in visual space
xScale(data[0]) // returns desired pixel translation{towards chart applications}
Chart applications
Charts that interact with other charts
Charts that handle different datasets
Charts that react to different sizes
Ability to assign events to charts
MVC style approach
Abstract charts from data
Abstract charts from interactions
Design a system for event handling
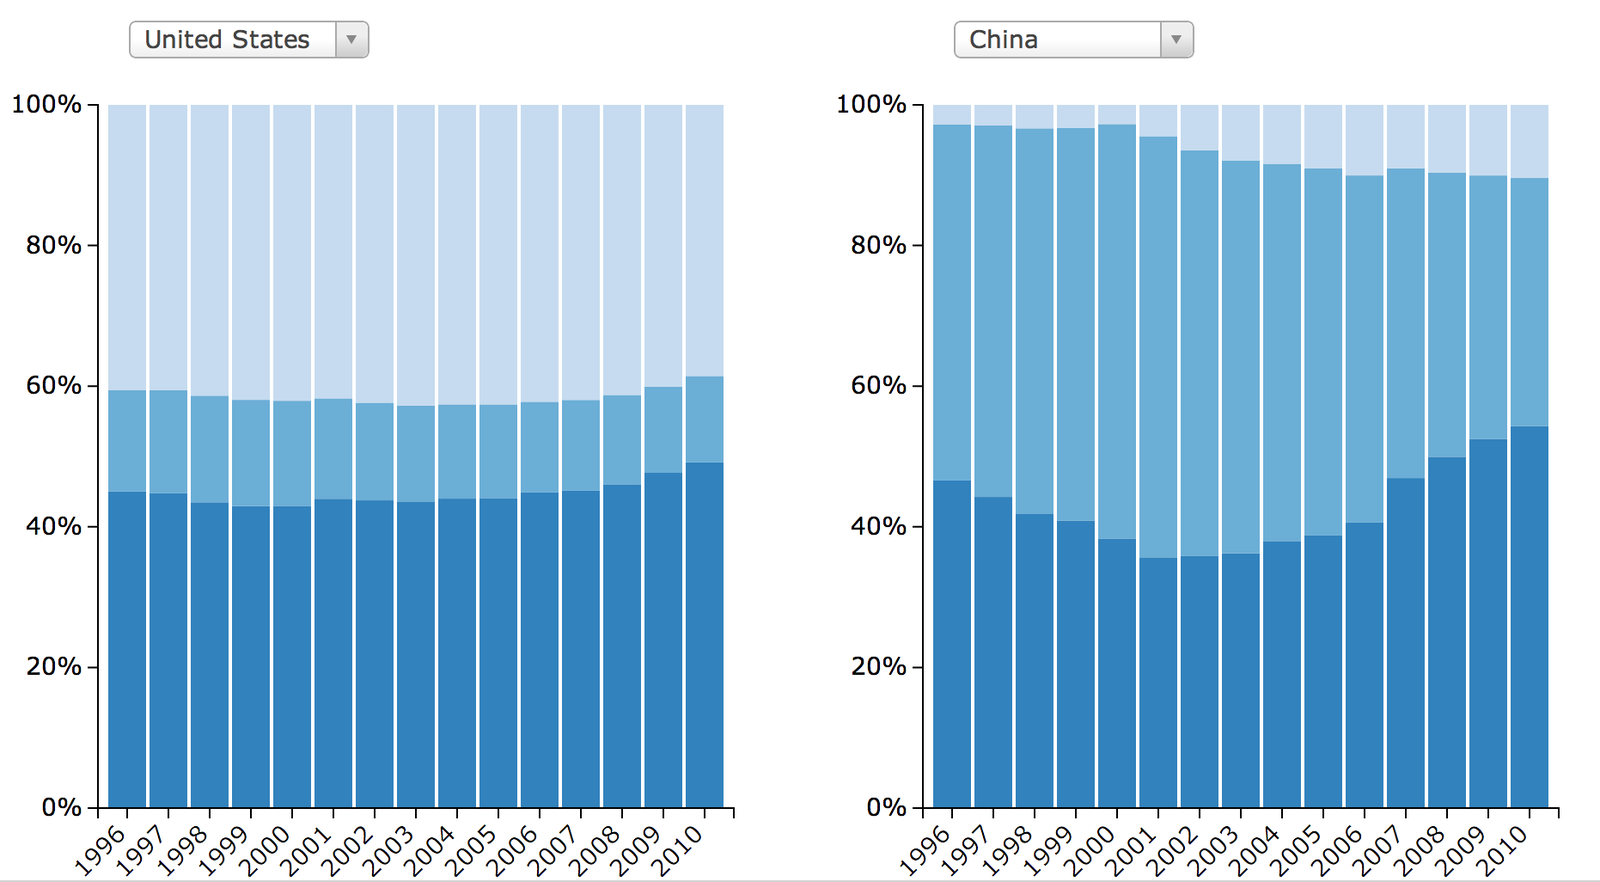
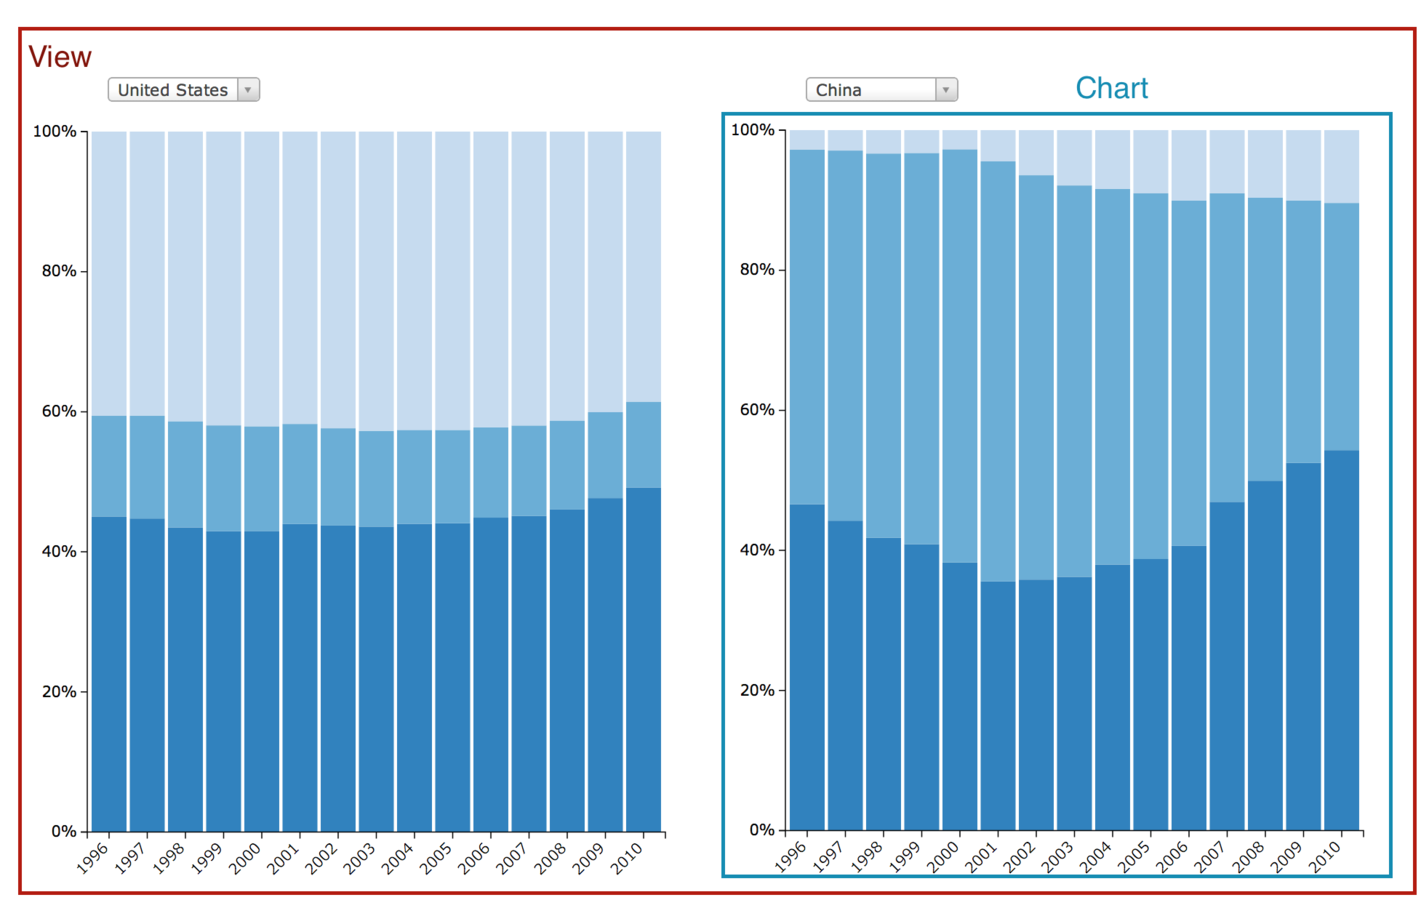
Consider views
A collection of charts
Manages settings for charts
Passes events to charts
this self
Set this as a variable
var person = {
	name:'Alan',
	age:55,
	statement:function() {
	    alert('Hello my name is ' + this.name)
	}
}
Referring to object
var person = {
	name:'Alan',
	age:55,
	statement:function() {
	    var self = this;
	    alert('Hello my name is ' + self.name)
	}
}
{Functions are actually objects}

Constructor functions
Extending (prototyping) functions
var PersonMaker = function(name,age){
    this.name = name
    this.age = age
}
Creating new instances
var jim = new PersonMaker('jim', 44)Defining function
PersonMaker.prototype.statement = function() {
    alert('Hello my name is ' + this.name)
}
{back to D3}
Chart functions
Extend your functions
var BarChart = function(data) {
	// Code that makes a new bar chart
}
Create new instances
var myChart = new BarChart(settings)
Each chart is a function
BarChart.prototype.draw = function() {
	// Draws chart
}
View functions
Instantiate a new View
var BarView = function(chartNum) {
  var self = this
  self.chartNumber = chartNum
  self.build()
}

// Build function
BarView.prototype.build = function() {
  var self = this
  self.makeData()
  self.makeCharts()
  self.makeInteractive()
}
Each View is also a function
var myView = new BarView(settings)
Activity
Restructure the scatterplot code
Start by forking my repo
Assignments
Spotify challenge (due Friday 11:59 p.m.)
Presentations next week
Group Project due 7/22