Widgets!

Outline
Shiny Review
Widgets
Plotly + Shiny
Multiple tabs
{review}
shinyapps.io


Browser passes information back to R
A free cloud-based server that passes information between an RStudio session and a browser
Shiny server builds a web page based on R output
all of this happens on a server somewhere else
{sign up for an account}
{widgets!}
Widgets
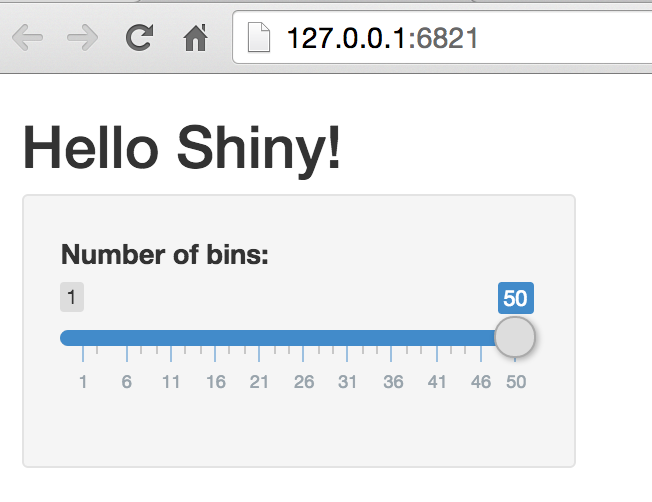
Set of elements a user interacts with
Sends values to server.R file as input$value
Facilitates interactivity!
Widgets: textInput
ui.R
server.R
shinyUI(fluidPage(

  # Create a text input element
  textInput("text", label = h3("Text input"), value = "Enter ..."),

  # Show output$userText from server.R
  textOutput('userText')

))
### Use input to create a string
shinyServer(function(input, output) {
# Render some text, using the value from the ui
output$userText <- renderText({
return(paste0('The user typed: ', input$text))
})
})Widgets: radioInput
ui.R
server.R
shinyUI(fluidPage(

  # Radio buttons
  radioButtons("color", label = "Color",
               choices = list("Green" = 'green', "Blue" = 'blue'),
               selected = 'green'),
  plotOutput('histogram')
))
### Use input to create a histogram
shinyServer(function(input, output) {
# Reder a histogram of a given color
output$histogram <- renderPlot({
x <- rnorm(1000)
return(hist(x, col = input$color))
})
}){example-2}
{plotly}
Plotly
Plays pretty nicely with Shiny
Minor adjustments needed:
## ui.R
shinyUI(fluidPage(
  mainPanel(
    plotlyOutput('scatter'),
    plotlyOutput('map')
  )
))
## server.R
shinyServer(function(input, output) {
# Render a plotly object
output$map <- renderPlotly({
build_map(data, input$export)
})
})Strings as variable names
......WHY?!?!?!!?.....
Select variables to show using Shiny widgets
Easy doable
life_expectancy <- c(75, 73, 71)
var_to_graph <- 'life_expectancy'
# Parse and evaluate var_to_graph
eval(parse(text = var_to_graph))
[1] 75, 73, 71
{exercise-1}
Panel Layout
shinyUI(fluidPage(
  # Main title panel
  titlePanel("title panel"),

  # Declare a sidebar layout
  sidebarLayout(

    # Put sidebar elements in here (i.e., widgets)
    sidebarPanel( "sidebar panel"),

    # Put main stuff in here (i.e., plots)
    mainPanel("main panel")
  )
)){example 3}
TabPanel
# Define UI for random distribution application
shinyUI(fluidPage(

  # Application title
  titlePanel("Tabsets"),

  # Sidebar with controls to select the random distribution type
  sidebarLayout(
    sidebarPanel(
      ....
    ),

    # Create tabs by passing in label and content
    mainPanel(
      tabsetPanel(type = "tabs",
        tabPanel("Plot", plotOutput("plot")),
        tabPanel("Summary", textOutput("summary")),
        tabPanel("Table", tableOutput("table"))
      )
    )
  )
))NavBar
# Create UI of a Navbar page
shinyUI(navbarPage('Page Title',

  # Create different pages using tabs
  tabPanel('Nav. Label 1',
    titlePanel('Page 1 title'),

    # Controls
    sidebarLayout(
      sidebarPanel(
       #widgets
      ),
      # Render plot
      mainPanel(
        plotlyOutput("myChart")
      )
    )
  ),

  # Create your second tab (page)
  tabPanel('Nav. Label 2',
    titlePanel('Page 2 title'),
    # Other contents of page 2 ...
  )
))