Graphite
The purpose today
- What is Graphite
- Why it's so great
- How to graph
What is Graphite?
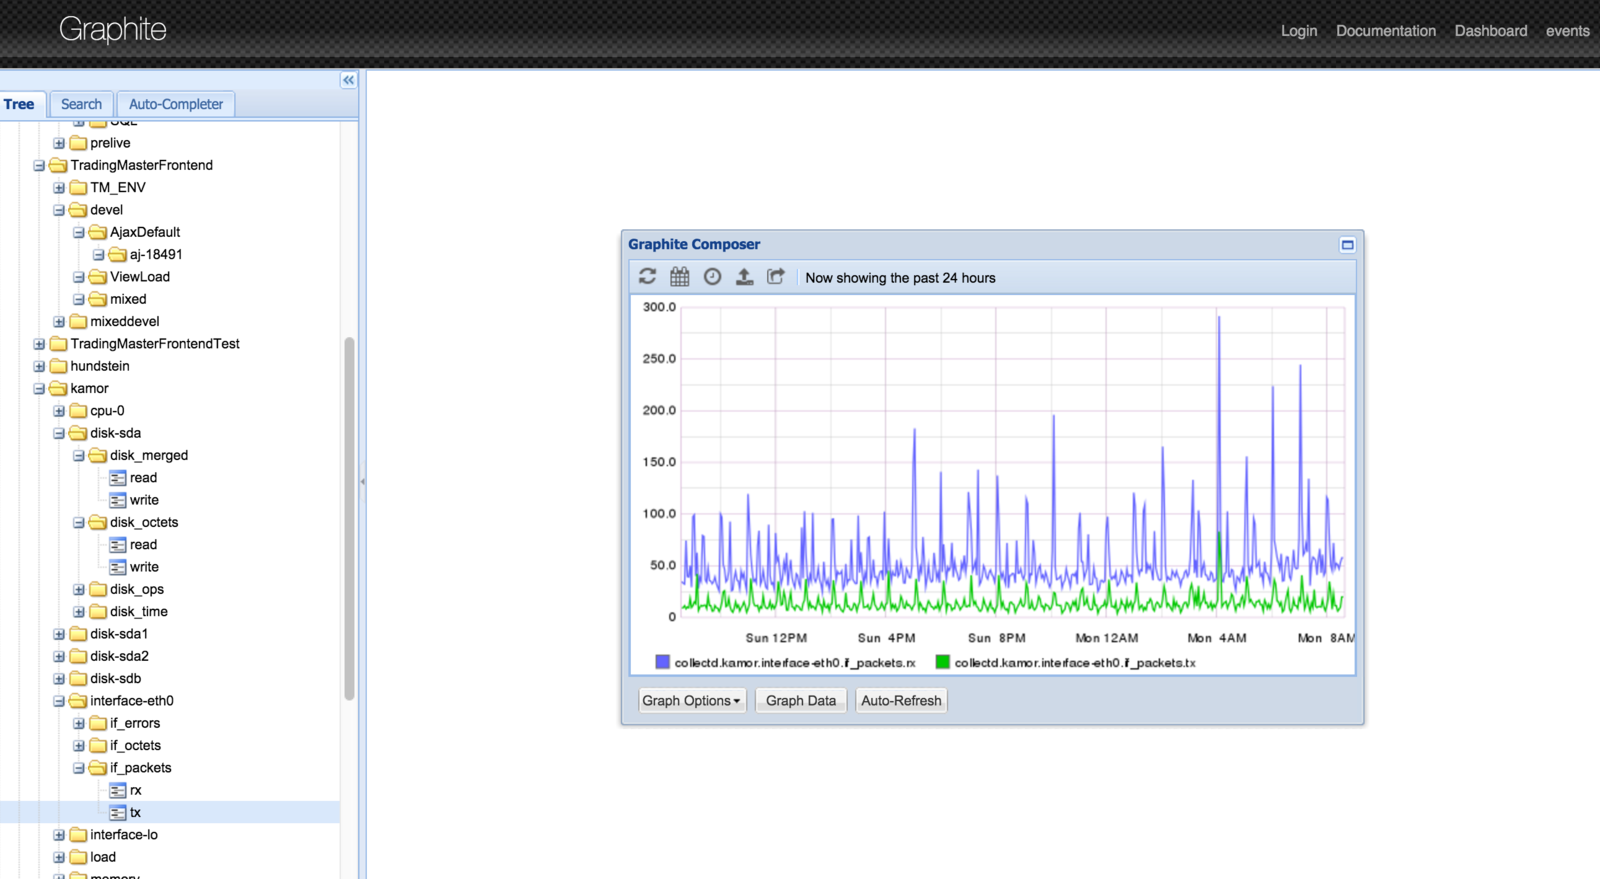
graphite.ch.meteogroup.net
Definition
ALERTING
METRICS
BOTH
Nagios
Icinga
Graphite
Cacti
Munin
Hyperic
Zenoss
Zabbix
What is Graphite?
Django web application
- Carbon - relays (receiving data), aggregations, persisting on disk, caches
- Whisper - fixed-size database, similar in design to rrd (round-robin-database)
- WebUI - simple dashboard, visualization of metrics
Why graphing?
-
Discover trends and patterns
- What time of the day do we get the most users?
- When x happened, what was the effect on y?
- How many hits am I getting per hour?
- How does this compare to last week? last month?
-
Predict future events
- When will we need to add more servers? Databases?
-
Negative feedback
- Did the release into production fix the problem x?
Graphite --
- No poller
- No all in one solution
- No easy backups
Graphite ++
- Simple
- Powerful
-
Functions
- sum, derivatives, integrals, timeshift, scale, averages, etc.
-
Api
- Nagios integration, 3rd party custom dashboards
- Scalable
- Easy to feed data
-
Ecosystem
- http://graphite.readthedocs.org/en/latest/tools.html
A Common Graphite Stack
Collectd
Poller(s)
Scripts
Applications
Carbon
Whisper
Graphite web
Dashboards
Collectd
Agent for system/hardware level metrics
Plugins:
- disk io
- disk space
- cpu
- memory
- mysql
- JMX
- java,
- load
How to graphite data
Bash
#!/bin/bash
timestamp = `date +%s`
value = 10
echo "identifier.metric.name $value $timestamp" | nc -w l graphite.host.name 2003
schema.application_name.namespace.metric_name.metric_type
What to collect?
- Hardware/OS, Load, Disk space, Disk IO, Network activity
-
Application metrics
- How often function x is called
- Average value of function x
- Average running time of function x
-
Database/Datastore
- performance metrics
- number of slow queries
-
Events
- Deployments
-
Log files
- Application logs (exception counts, hits, ...)
Final thoughts
- You don't know what metrics you need until you need it
- Identify your KPIs
- Don't graph everything
- More graphs === less overview
- Too many metrics slows down graphing
- Too many metrics can kill a host
- Correlate
- Include other metrics (deployments, failover)
- Application metrics with database metrics
- Other influences (marketing campaigns, ...)