Introduction to MATLAB
Min Kim
Rutgers
September 2, 2022
H = 40;
L = 4;
irf_i = zeros(H,1);
irf_i_u = zeros(H,1);
irf_i_l = zeros(H,1);

for h=0:H
    YY = Y(L+1+h:end,1);
    XX = X(L+1:end-h,:);
    length(XX);
    [bet, ~, se] = olshac(YY,XX,h+1);
    irf_i(h+1) = bet(2);
    irf_i_u(h+1) = bet(2) + 1.65*se(2);
    irf_i_l(h+1) = bet(2) - 1.65*se(2);
end

figure
plot(0:H,irf_i*100,'k','linewidth',2)
hold on
plot(0:H,irf_i_u*100,'k','LineStyle','--')
plot(0:H,irf_i_l*100,'k','LineStyle','--')
Motivation
- Why do we need a computer in economics?
- empiricists: "to access and analyze data"
- theorists: "to solve models and run simulations"
-
Why then MATLAB?
- widely used in economics
AER
program usage
(2018)
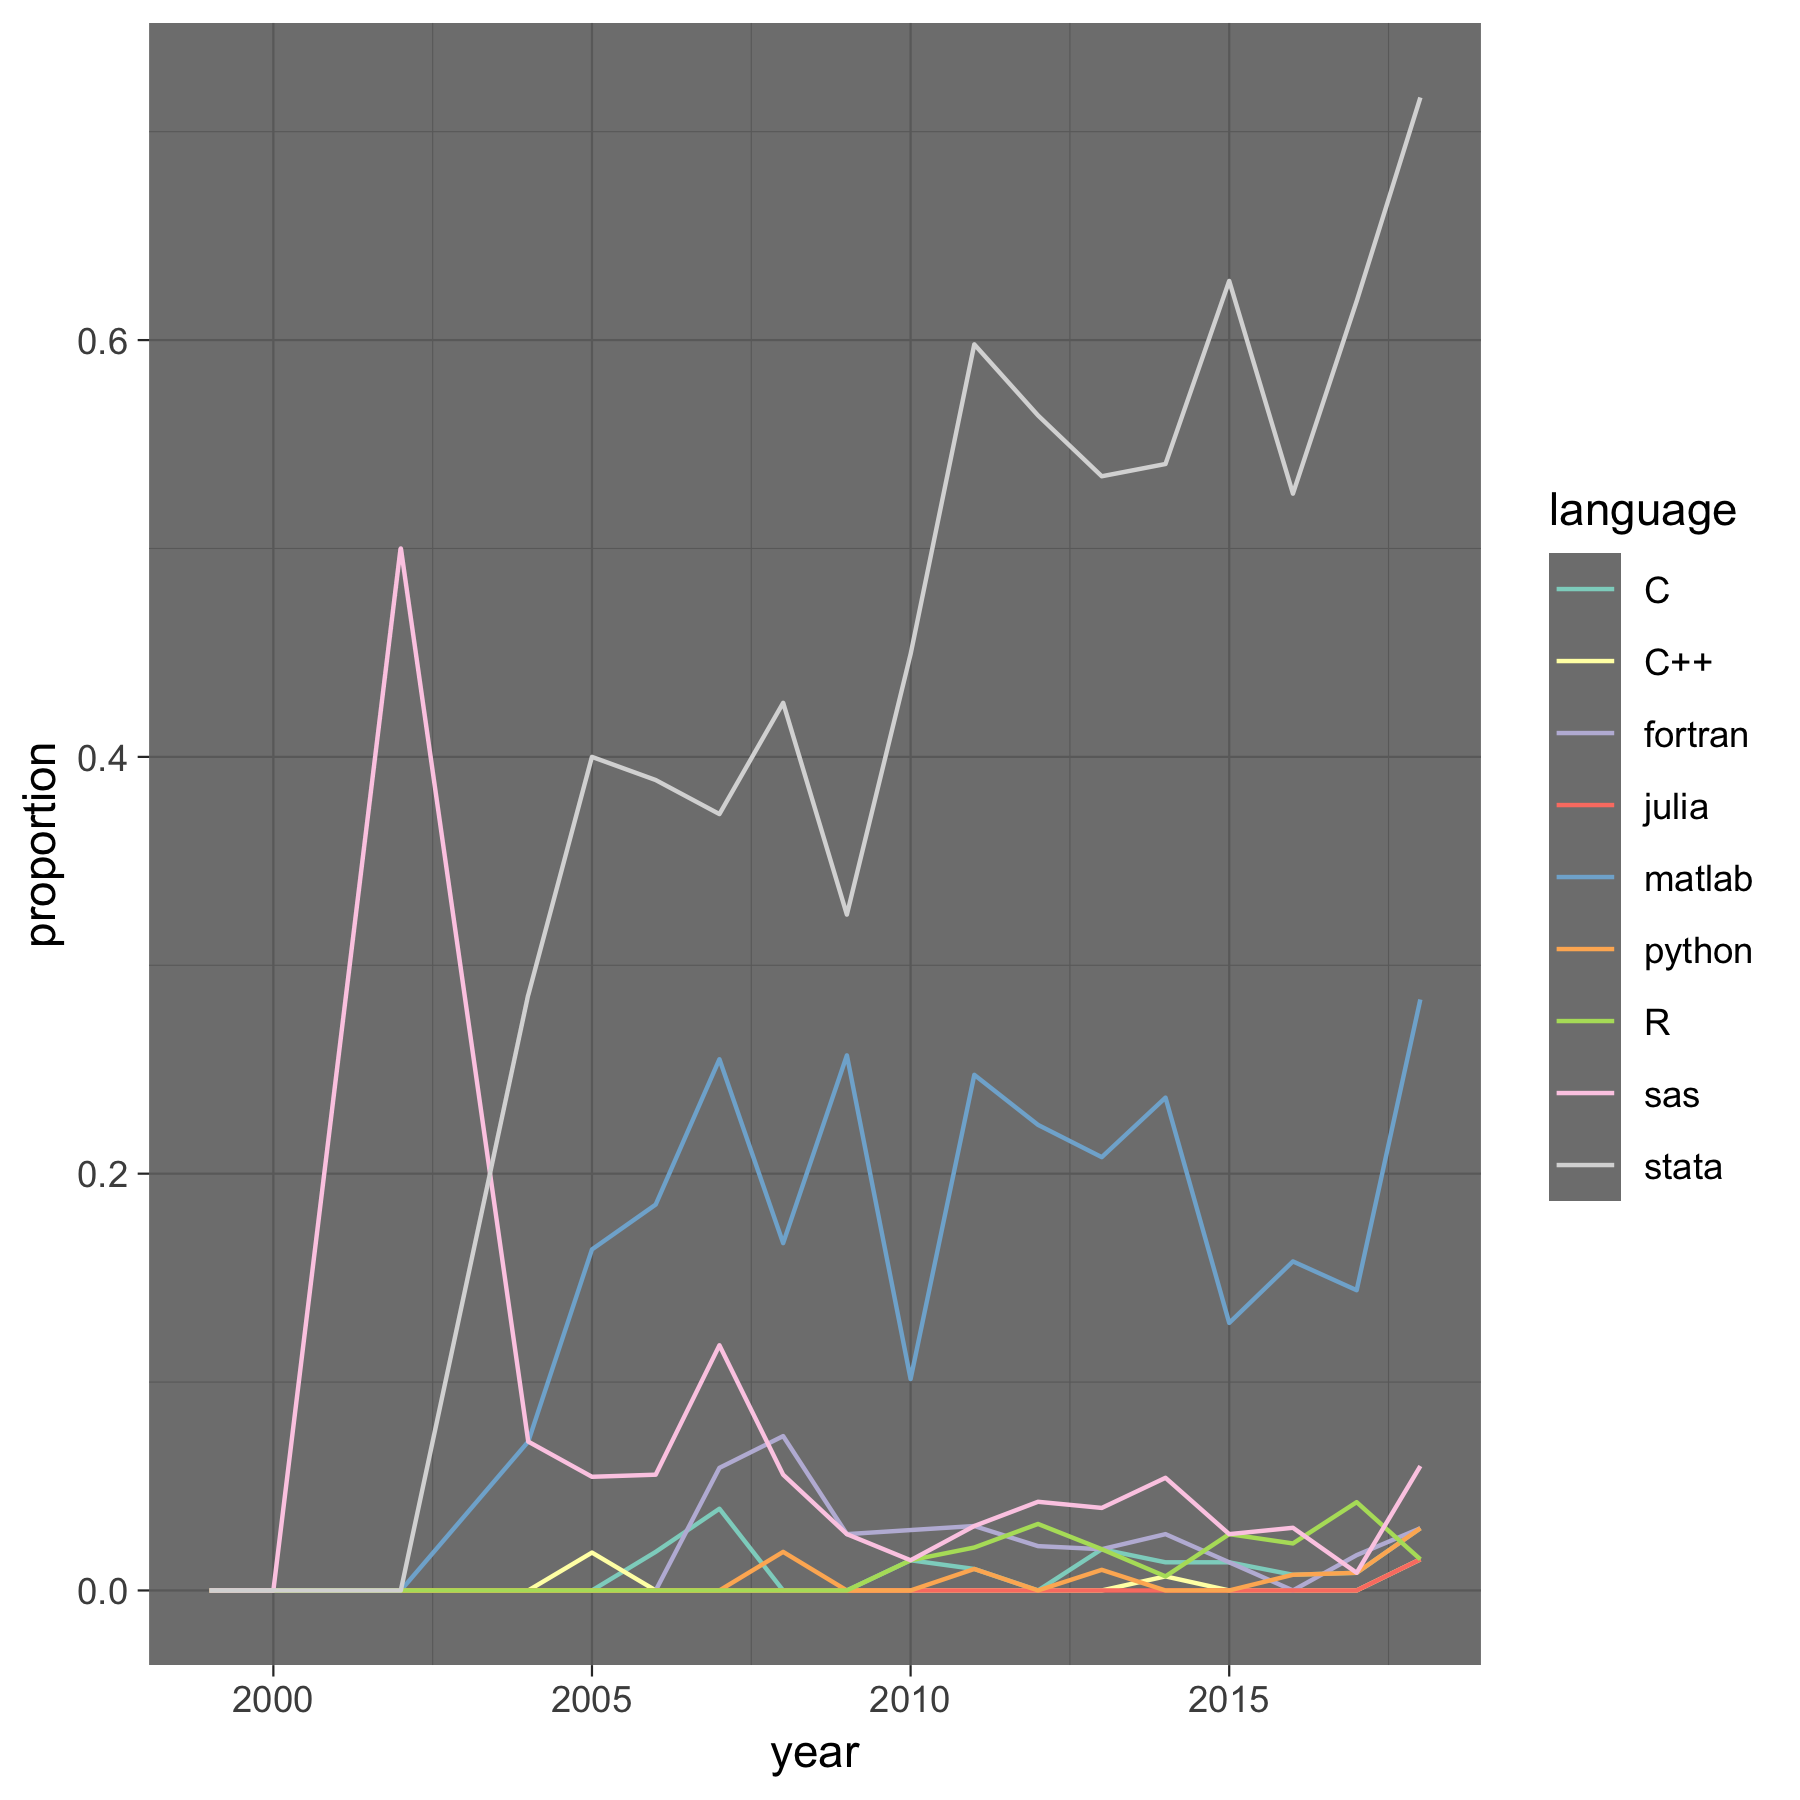
Other professions?
A recent article about programming languages [link]

Motivation
- Why do we need a computer in economics?
- empiricists: "to access and analyze data"
- theorists: "to solve models and run simulations"
-
Why then MATLAB?
- widely used in economics
- easy to learn
- good at linear algebra (it stands for Matrix laboratory)
- useful for homework in macro classes (604/605)
Interface
- Command Window: used to enter commands and to display outputs
- Workspace: displays all the variables
- Command History: shows the history of all the commands executed
- Current Folder: displays all the files in the current folder
Scalars and Strings
- Let's type the followings in the command window
  1 - 1
  2 * 2;
  ans
  ans / ans
  help log % try also "doc log" and "which log"
  a = log(ans);
  a = a + 1
  b = a^2
  0 / 0
  1 / 0
s = 'this is a string'- Now type clc and clear
Vectors and Matrices
- Let's create \(x=\begin{bmatrix}2 \\ 1\end{bmatrix}\), \(y=[0\,\,\, 1]\), and \(A=\begin{bmatrix}2 & 0 \\ 0 & 1 \end{bmatrix}\)
x = [2 ; 1]
y = [0 1]
A = [2 0; 0, 1]
Vectors and Matrices
- Let's create \(x=\begin{bmatrix}2 \\ 1\end{bmatrix}\), \(y=[0\,\,\, 1]\), and \(A=\begin{bmatrix}2 & 0 \\ 0 & 1 \end{bmatrix}\)
x = [2 ; 1] % see length(x) or size(x)
y = [0 1] % y = [0, 1]
A = [2 0; 0, 1] % see det(A) and rank(A)
A = [2 0; y]
A = [A(:,1) y']
A = [x(1) 0; 0 1]
A = diag(x)
A = eye(2) + [1 0;0 0]
Vectors and Matrices
- In Python, for example,
import numpy as np
x = np.array([2, 1]).reshape(2, 1)
A1 = np.array([2, 0])
A2 = np.array([0, 1])
A = np.hstack((A1, A2))
which does not look as simple as MATLAB
Vectors and Matrices
- Let's manipulate matrix \(A\) and create random vectors and matrices
save data x y A
clear
load data
5*A
inv(A)
max(A)
exp(A)
A(1) % see also A(3), A(1,2) and A(:)
A'
A.^2
A + ones(2,2)
ans^2
log(ans)
diag(ans)
1:8
1:2:8
Vectors and Matrices
linspace(1,8,4)
B = reshape(ans,2,2);
A*B
C = magic(5)
C = C(1:end,1) - C(:,3);
C = reshape(C(1:end-1),2,2);
index = find(C > 5)
C_1col = C(index)
size(C_1col)
size(A)
C_1col'*A
rand
randn(2,2)
n = 100
mean(rand(n,1))
Exercise 0 - Solving linear system
- Consider the following linear system:
2 x-3 y=5\\
x+5 y=2
- Write it in matrix form and find the solution
Cell arrays and Structures
- Cell array is a collection of variables (in different types)
C = {'cell array', A; B, x}
C{1,1}- Structure is a database
student(1).name = 'Min Kim';
student(1).nationality = 'South Korea';
student(1).info = [1; 6]; % credits and year
student- Let's create student(2) and type mean([student.info])
Boolean Statements
- Booleans are logical data: true (logical 1) or false (logical 0)
2 >= 1
ones(4,1) >= 1
A(:) > 0
sum(ans)

true
false
true == false
true ~= false
true | false
true & false
Exercise 1 - Bond pricing
- Consider a zero-coupon bond with face value \(M\) that matures in \(T\) periods. If the yield to maturity is \(r\), then what is the market value of this bond at \(t\)?
$$ V_t = \frac{M}{(1+r)^{T-t}}$$
- Assume \(M=\$100\), \(T=10\) periods, and \(r=8\%\). Solve for \(V_t\) for all \(t=0,\ldots,T\)
If/else
- You can also add elseif in the statement
x = 5;
if (x > 3)
	disp('x is greater than 3')
else
	disp('x is lower than or equal to 3')
end
Loops - while
- What is the value of \(S= \sum_{i=0}^{10} i\)?
i = 0; S = 0;
while i <= 10
  S = S + i;
  i = i + 1;
end
Loops - while and if
- What is the value of \(S= \sum_{i=0}^{10} i\) for \(i\) that is even?
i = 0; S = 0;
while i <= 10
	if mod(i,2) == 0
		S = S + i;
	end
	i = i + 1;
end
Loops - for
- What is the value of \(\bar{S}= \frac{1}{10}\sum_{i=0}^{10} i\)?
S = 0;
for i = 0:10
	S = S + i;
end
S_bar = S/i;- For even \(i\)s, we can modify it as \(i=0:2:10\)
Exercise 2 - Bond pricing, again
- What is the change of bond value from \(t\) to \(t+1\)?
- Use a loop to find the first period when the sum of all previous value changes becomes greater than $30.
- Again assume \(M=\$100\), \(T=10\), and \(r=8\%\).
$$V_{t+1}-V_t$$
Script and Function
-
Script is a series of commands stored as .m (or .mlx) files
- You can run the file in current directory by typing filename in the command window
- Let's create a script for Exercise 1&2 and run it
Script and Function
-
Function is a series of commands that require external inputs
- Let's now create a function of Exercise 1&2
function V = ex1(M,r,T)
  tau = T:-1:0;
  V = M./(1+r).^tau;
end
Script and Function
-
Function is a series of commands that require external inputs
- Let's now create a function of Exercise 1&2
- Later I will introduce another way of defining a function (often called anonymous function)
function answer = ex2(M,r,T)
    V = ex1(M,r,T);
    Vdiff = diff(V);
    Vdiffsum = cumsum(Vdiff);
    tau = find(Vdiffsum>30,1);
    answer = strcat("Period ",num2str(tau));
%    or using a loop
%     for i = 1:T
%         if Vdiffsum(i) > 30
%             answer = strcat("Period ",num2str(i));
%             break
%         end
%     end
end
Exercise 3 - Square function
- Write a function \(f(x,n) = x^n\). If \(x\) is a vector or a scalar, \(f\) returns a vector where each element is \(n\)th power of each element of \(x\). If \(x\) is a matrix, \(f\) returns an error message.
- Name \(f\) square.
- Test your function:
- square([2;1],4)
- square(4,2)
- square([2 2;1 2],4)
Recursive function
- We can also define a function in a recursive way
- Let's create a function that computes factorial
- MATLAB default: factorial()
- We know that, for positive integer \(n\)
function V = compute_factorial(n)
  if n<0 || ~isint(n)
      error('n must be a positive integer')
  elseif n == 0
      V = 1
  else
      n * compute_factorial(n-1)
  end
end
\(n! = n*(n-1)*(n-2)*\cdots*1\)
\(0! = 1\)
Recursive function
- Let us go back to Exercise 1
\(V_t = \frac{V_{t+1}}{1+r}\)
function V = ex1(M,r,T)
  tau = T:-1:0;
  V = M./(1+r).^tau;
end- We want it to be recursive:
- What is the relationship between \(V_t\) and \(V_{t+1}\)?
- (Bonus) How would you write a function using this relationship?
Plot
- Let's generate a white noise process \(\varepsilon_t \sim N(0,1)\) for \(T=200\) and plot it
T = 200;
epsilon = randn(T,1);
figure;
plot(epsilon)- Close the figure window by typing close all
Plot
- Now an AR(1) process \(x_{t} = c + \rho x_{t-1} + \varepsilon_t\) where \(c=0\), \(x_0=0\) and \(\rho =0.9\).
x = zeros(T,1); % pre-allocation of memory
rho = 0.9;
for t = 2:T
	x(t) = rho * x(t-1) + randn;
end
figure
plot(1:T,x)
Plot
- Let's plot a function of two variables \(g(x,y) = 4x^2+2y^2+4xy+2y+1\)
x = linspace(-10,10,100)';
y = x;
[X,Y] = meshgrid(x,y);
g = @(x,y) (4*x.^2+2*y.^2+4*x.*y+2*y+1);
figure;
surf(X,Y,g(X,Y)) % looks like g is convex
Exercise 4 - Plotting AR(1)
- Plot three AR(1) processes for \(\rho=0, 0.8,0.98\) together
- Plot a matrix composed of the three processes in column
- Use hold on or tiledlayout
Debugging

Exercise 5 - Debugging a function
- Find three errors in the function below
function sequence=collatz(n)
% Collatz problem. Generate a sequence of integers resolving to 1
% by Ian M. Brooks
% For any positive integer, n:
%   Divide n by 2 if n is even
%   Multiply n by 3 and add 1 if n is odd
%   Repeat for the result
%   Continue until the result is 1
sequence = n;
next_value = n;
while next_value >= 1
    if rem(next_value,2)=0
        next_value = next_value/2;
    else
        next_value = 3*nextvalue+1;
    end
    sequence = [sequence, next_value];
end
Estimation
- Consider AR(1) process \(x_{t} = c + \rho x_{t-1} + \varepsilon_t\) where \(\varepsilon_t \sim N(0,\sigma^2)\)
- Assume \(c=5\), \(x_0=0\), \(\rho =0.7\), \(T=1,000\) and \(\sigma=2\)
- Let's simulate the model and estimate it using OLS
T = 1000;
x = zeros(T,1);
rho = 0.7;
c = 5;
for t = 2:T
x(t) = c + rho * x(t-1) + 2*randn;
end
X = x(1:end-1); % one period lag
y = x(2:end);
model = fitlm(X,y); % linear model fitting
model.Coefficients
Exercise 6 - AR(1) Estimation
- Find the vector of estimator and plot the simulated data together with the fitted value
- (Hint: Read the document for fitlm)
- Can you do it without using the toolbox?
- Recall the formula for OLS estimator
$$\begin{bmatrix}\hat{c}\\\hat{\rho} \end{bmatrix}=(X'X)^{-1}X'y$$
- Recall the formula for OLS estimator
Exercise 7 - Detrending US GDP
- Let's go to FRED for US real GDP per capita series
- Steps to follow
- Download the series in '.csv' format
- Load it in MATLAB
- Plot the series
- Detrend the series
- Linear-detrending method: detrend()
- HP filtering method: hpfilter()
-
Examine the cycles and the trend for each method
- what can we say about these two methods?
Optimization
-
Root-finding
- Use fzero for a single-variable nonlinear zero finding
- Use fsolve for systems of nonlinear equations of several variables
- Q.What is the value of \(x\) that satisfies \(x^2=2\) or \(x^2-2=0\)?
Optimization
- What is the value of \(x\) that satisfies \(x^2=2\) or \(x^2-2=0\)?
- Let's first check how it looks like
f = @(x) (x.^2-2); % anonymous function
x_val = linspace(-5,5,100); % domain or grids
figure;
plot(x_val,f(x_val))
yline(0,'k--')- What is the point in x_val that gives you 0 for f?
- this is called Grid-search method
Optimization
- What is the value of \(x\) that satisfies \(x^2=2\) or \(x^2-2=0\)?
- Now let's find the root(s)
int_val = 1; % initial value
[sol, fvalue] = fzero(@f,int_val); % find_root is the function- Does your answer depend on the initial value?
- Try again with int_val = -1;
Optimization
-
Minimization
- Use fminunc for local minimization of a function of several variables
- fminsearch does the same job using an algorithm that does not require gradients
- Use fminbnd for single-variable bounded nonlinear function minimization
- Find the minimum of function \(g(x,y) = 4x^2+2y^2+4xy+2y+1\)
Optimization
- Find the minimum of function \(g(x,y) = 4x^2+2y^2+4xy+2y+1\)
g = @(x) (4*x(1).^2+2*x(2).^2+4*x(1).*x(2)+2*x(2)+1);

int_val = [1; 1]; % initial value
[sol, gvalue] =  fminunc(@g,int_val); % g is the function
Exercise 8 - Savings problem
- Consider a simple consumer problem:
\max_{c_1,c_2,s}\quad U(c_1,c_2)=u(c_1)+\beta u(c_2)\\
\text{s.t.}\\
c_1+s=y_1\\
c_2=y_2+Rs
- How would you find the solution?
\frac{u'(y_1-s)}{\beta u'(y_2+Rs)}=R
Exercise 8 - Savings problem
- Write a function savings(\(s\)) assuming \(u(x)=\log(x)\)
- Use fsolve and find \(s\) when \(\beta=0.99\), \(R=1.04\), \(y_1=10\), and \(y_2=5\)
- What do you get when \(y_2=20\)? Intuition?
- (Bonus) Find \(c_1\), \(c_2\) and the utility value \(U(c_1,c_2)\)
- Can you solve the same problem using grid-search method?
- Create grids for \(s\) and find the solution
exercise