Intro to Text Analysis

Voyant visualizes your texts in many different ways, some basic, some complex. You can upload texts or link to text files on the web, but we're going to use this corpus so we're all on the same page.
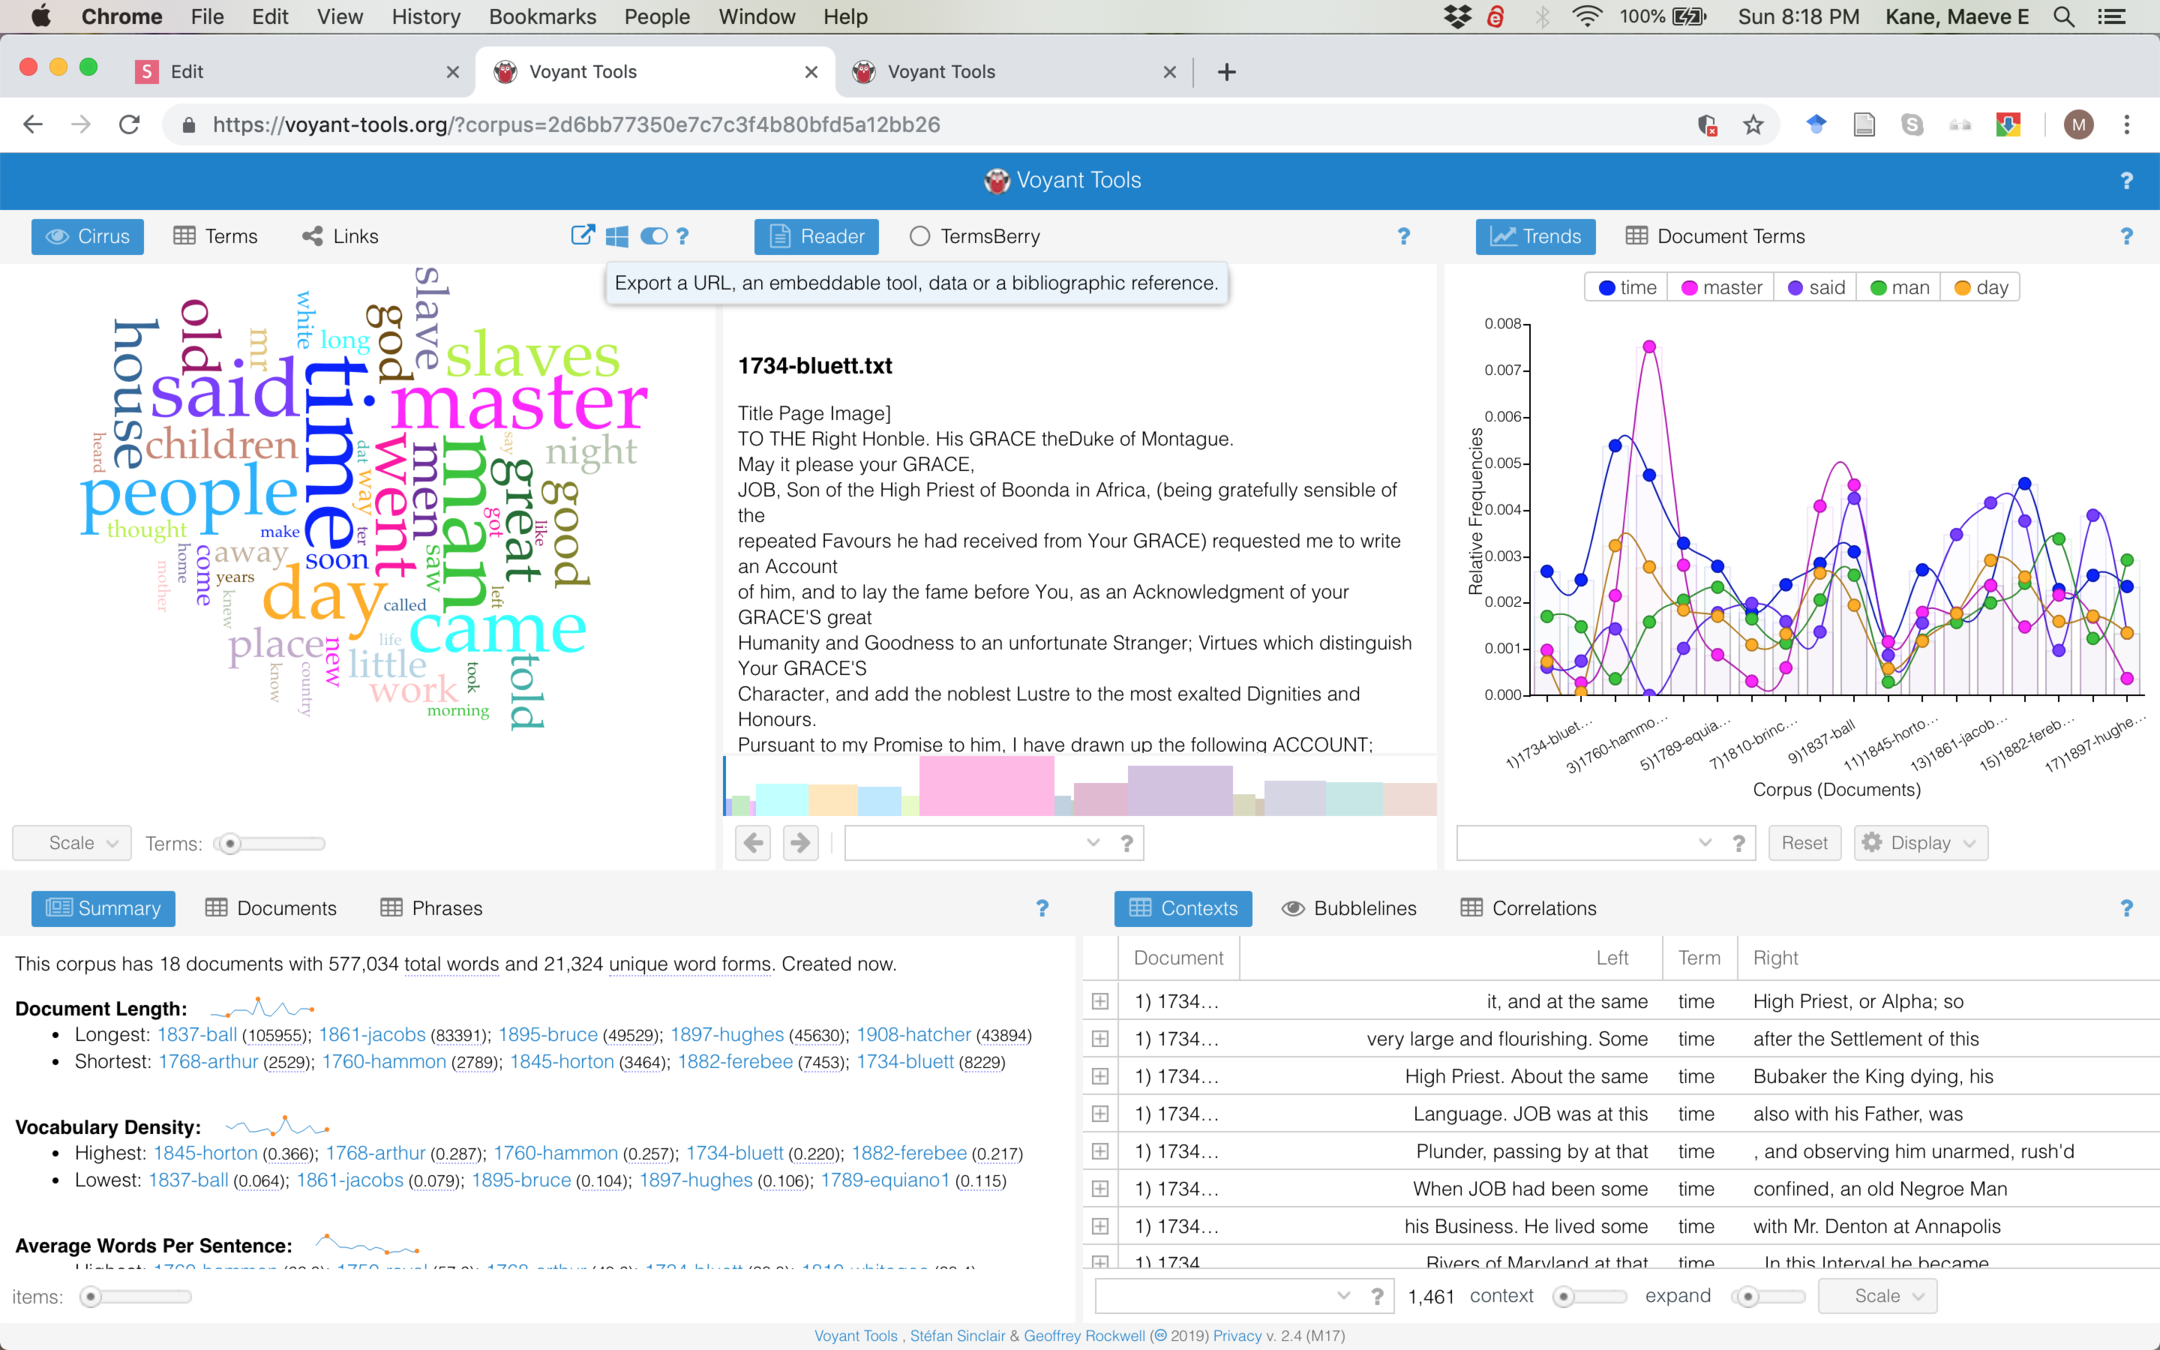
If you want to see any pane in its own tab to get a better view, hover over the question mark until more options appear, then click "Export a URL" and select "Export a URL for this view"
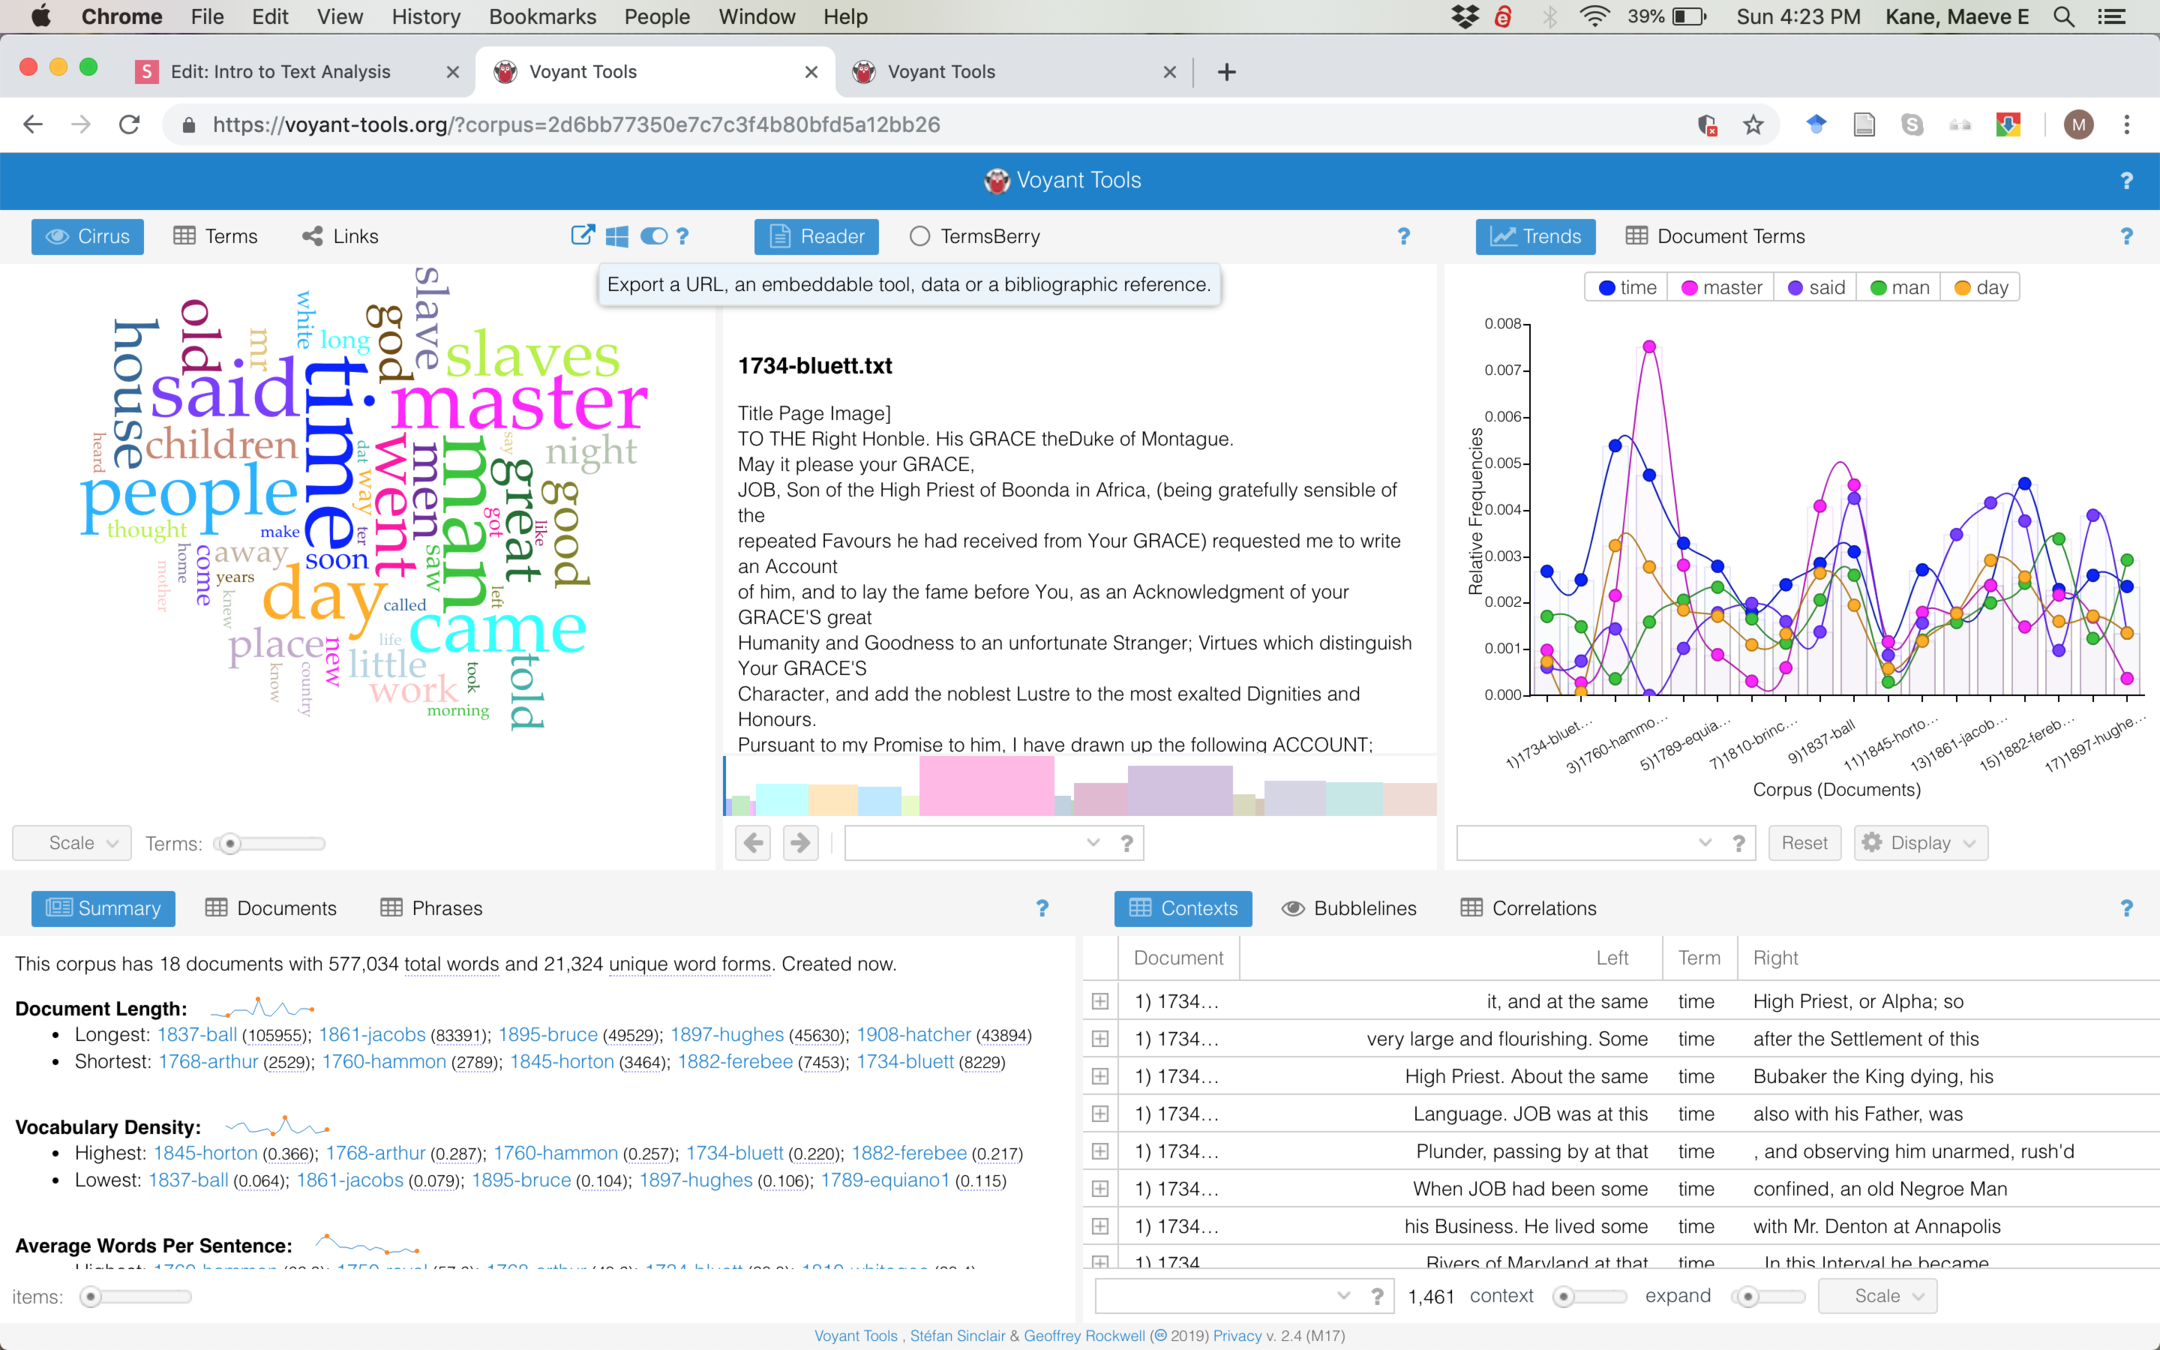
Voyant gives us a broad overview of our texts. The Cirrus word cloud tells us which words are frequently used in the whole corpus (or combined body of texts), while the Trends pane tells us the frequency of top words across all our texts (ordered here by date).
How do they compare? What does it mean that "master" is frequently used in the corpus but is less prominent in some texts?
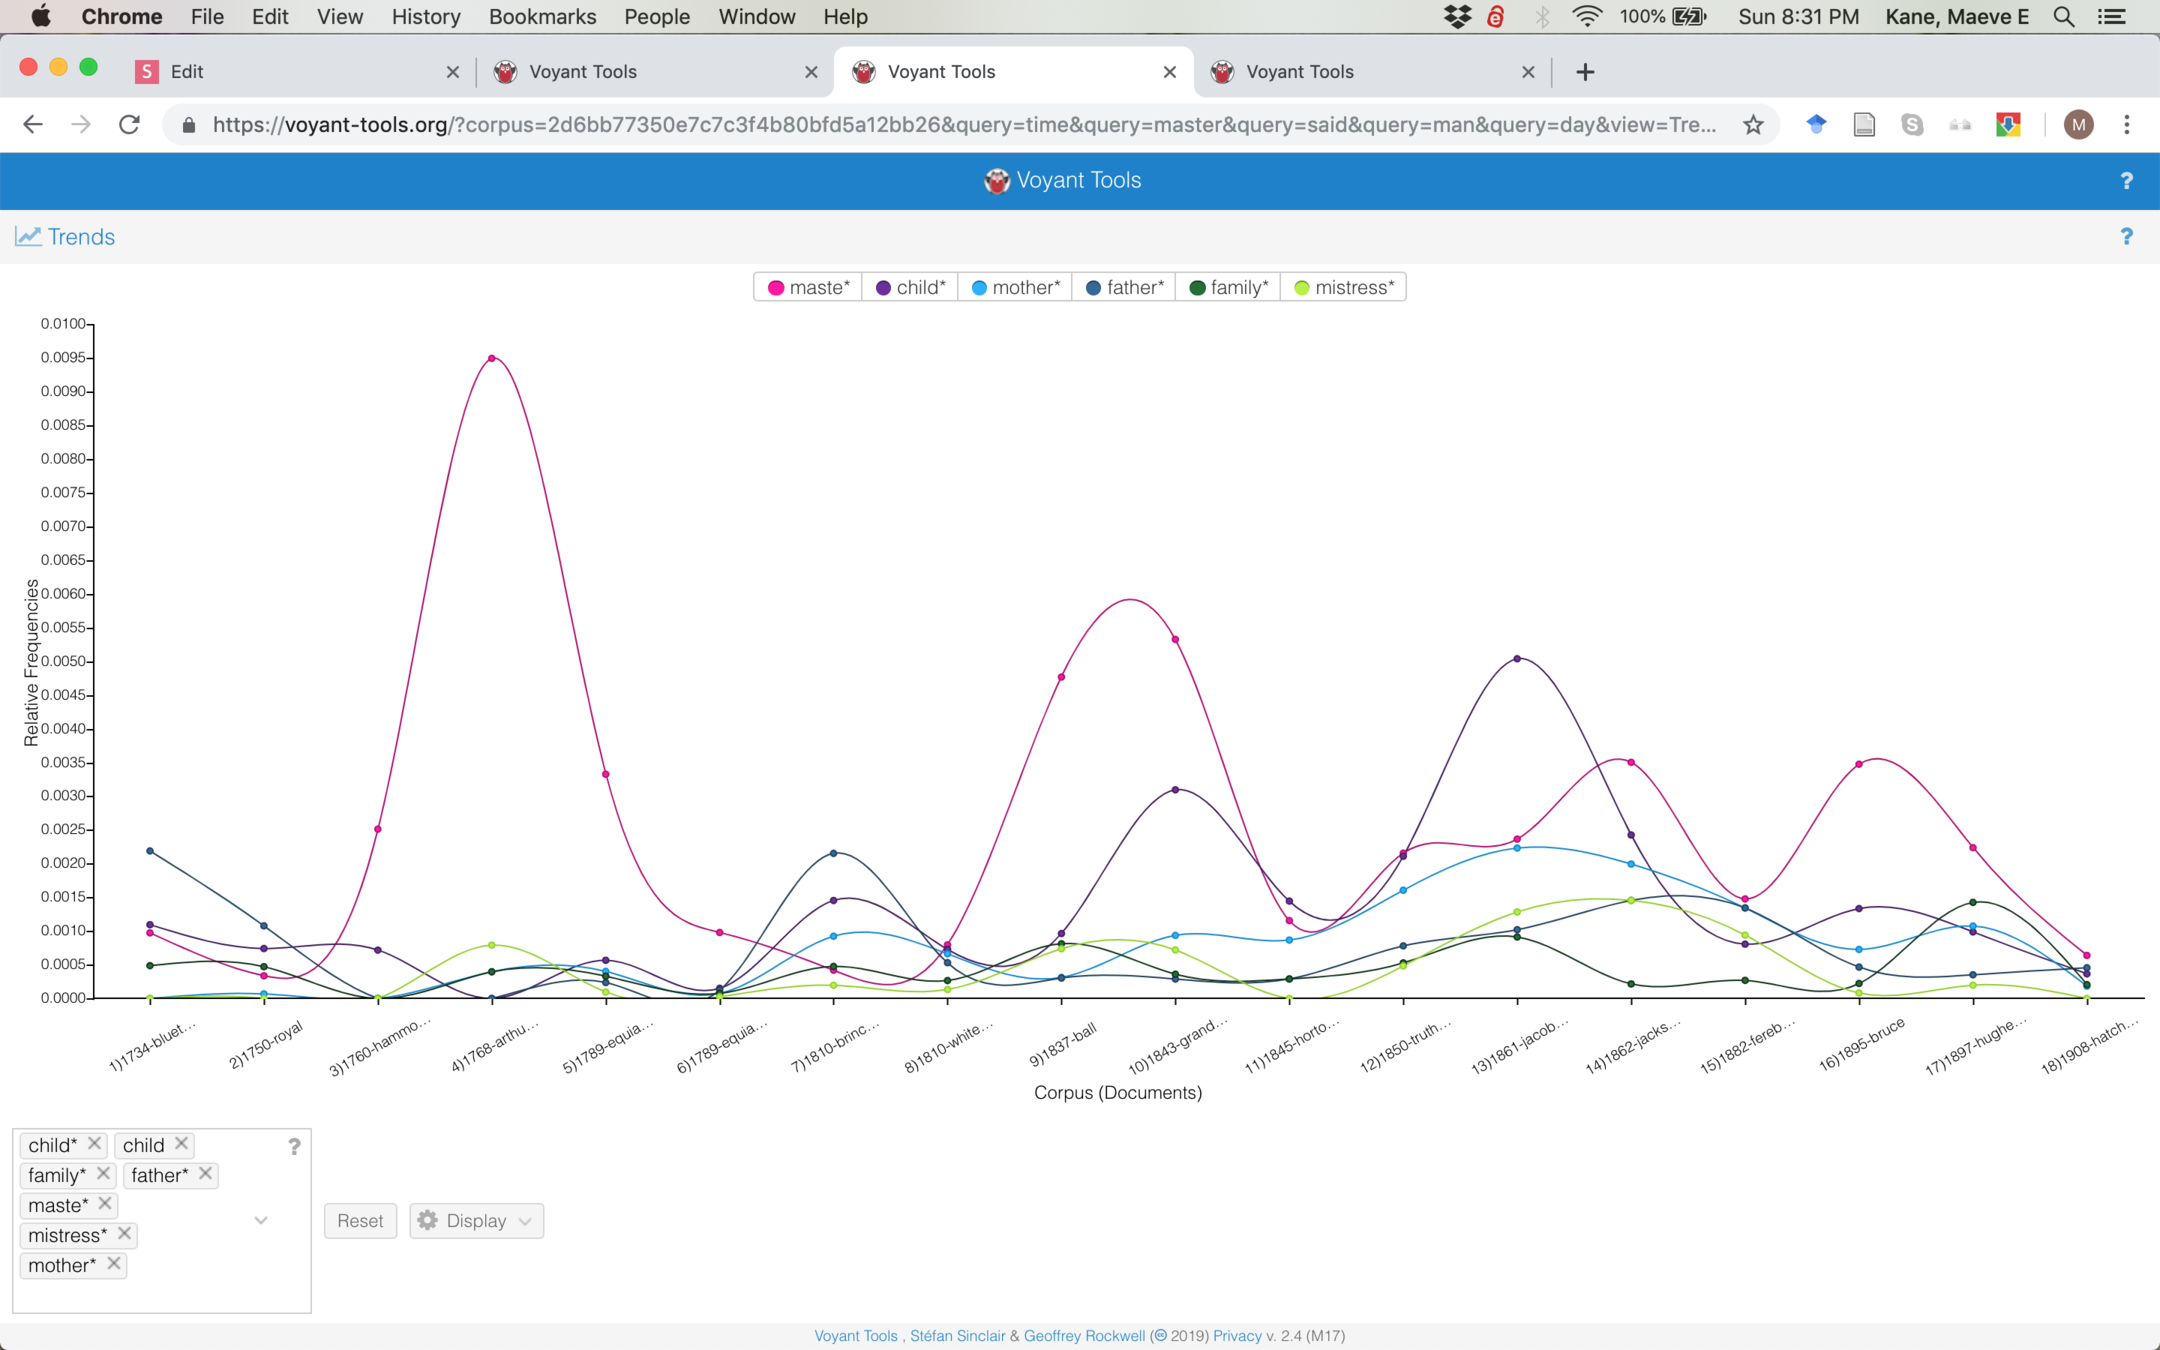
Using Trends, we can compare terms using the search bar. What does it mean that "master" is proportionally more or less prominent than family-related terms in some texts? What can we say about gender if master is more prominent than mistress, but mother is more prominent than father?
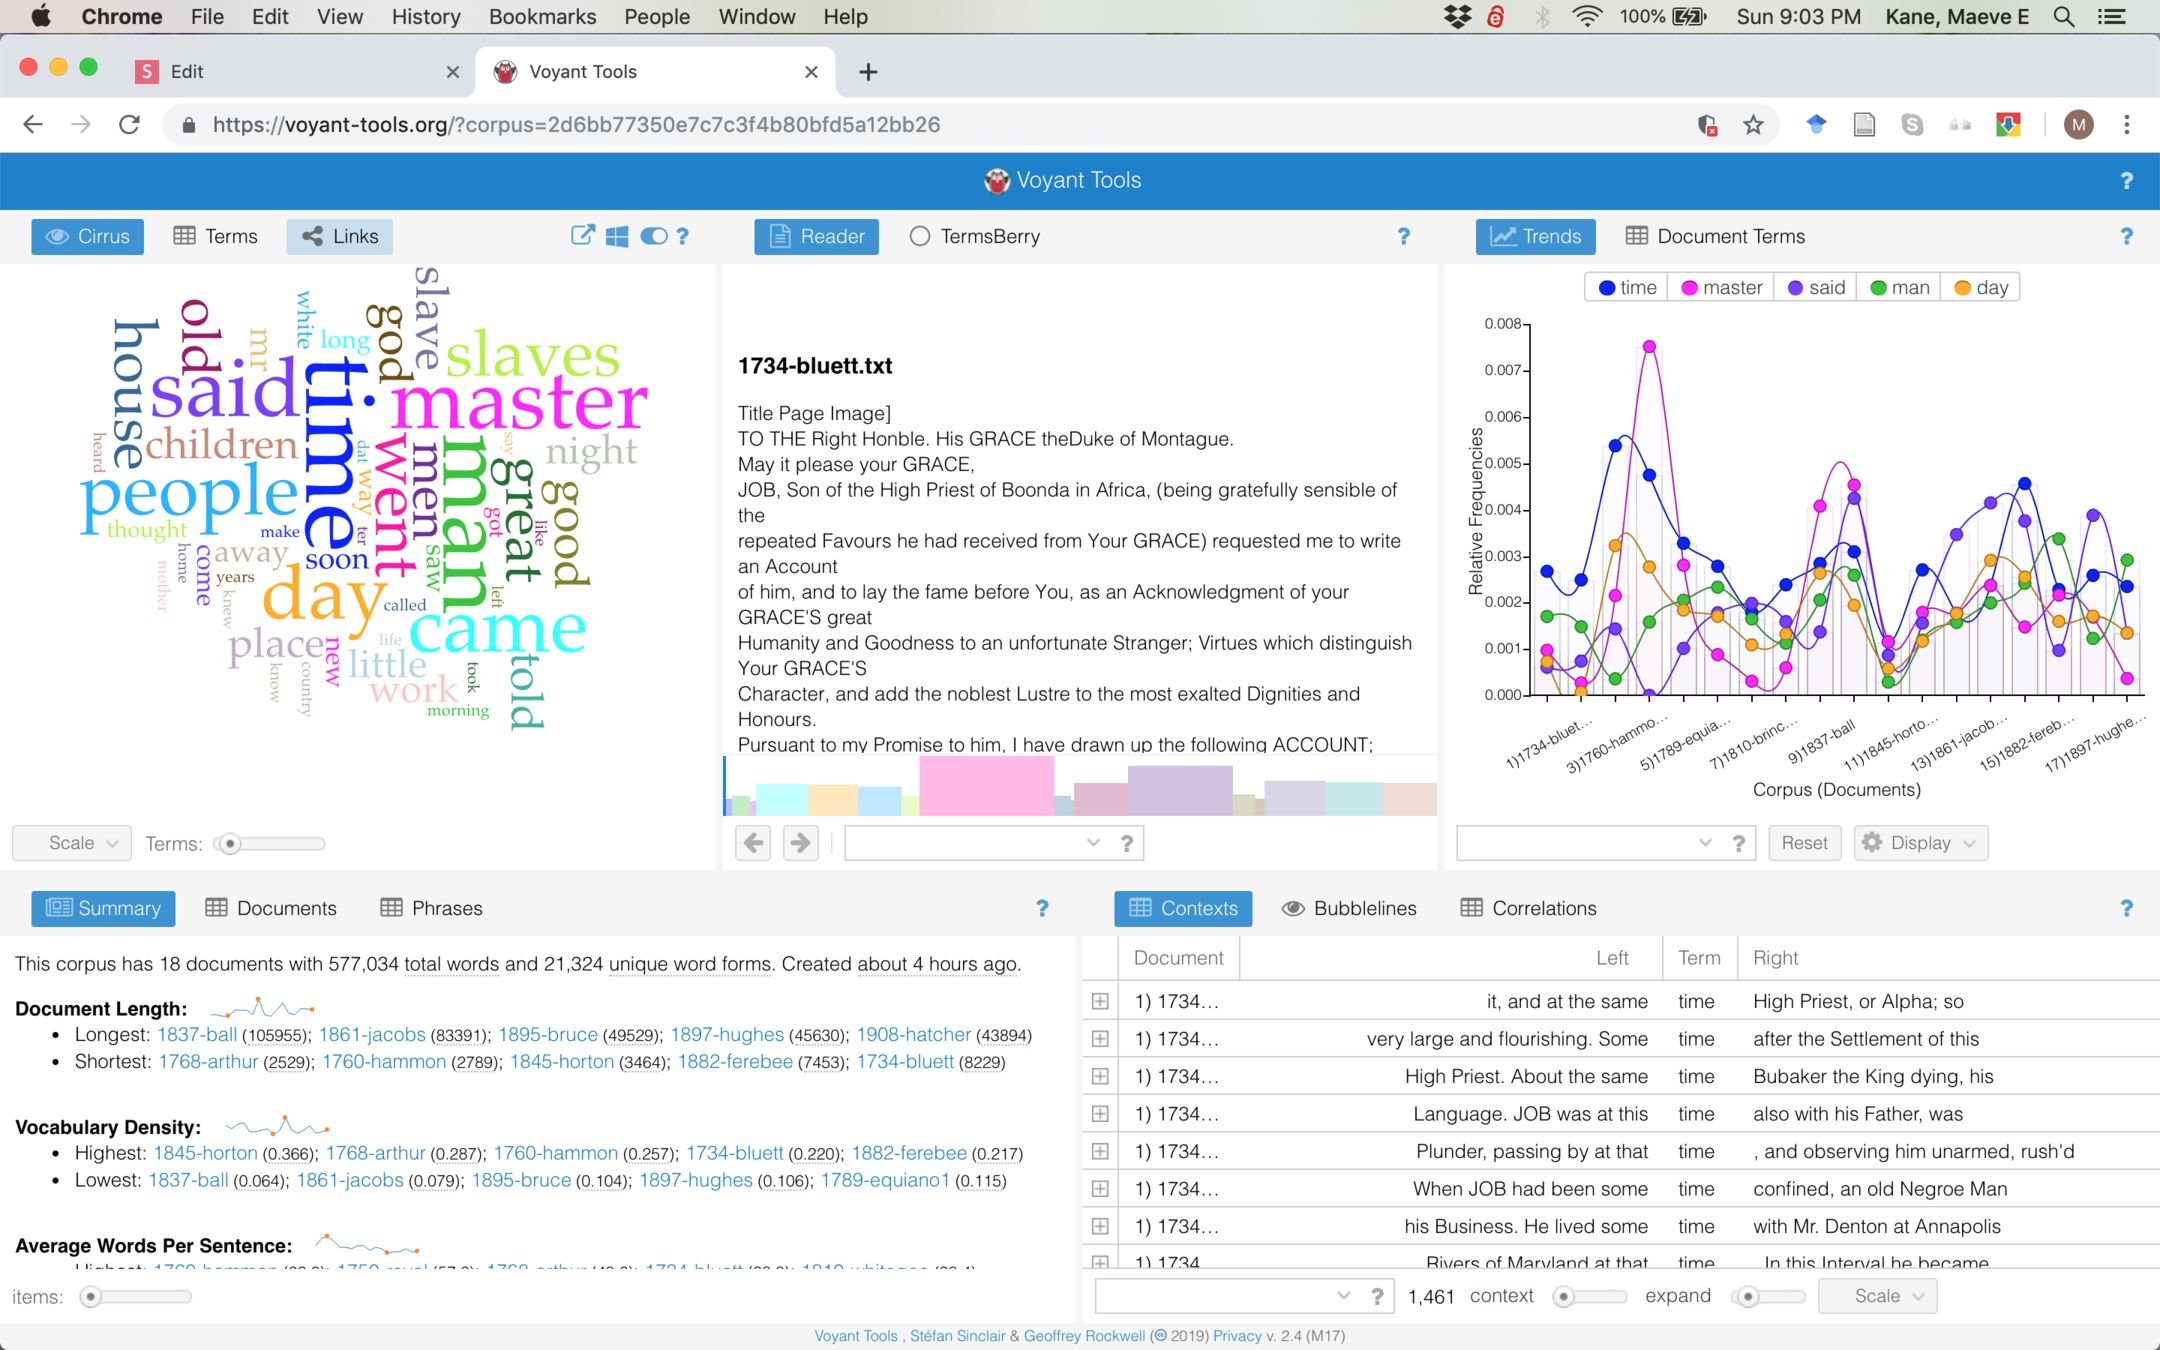
We can toggle between different kinds of analysis with the different presets Voyant gives us. Let's switch to Links, which will give us a network similar to Gephi.
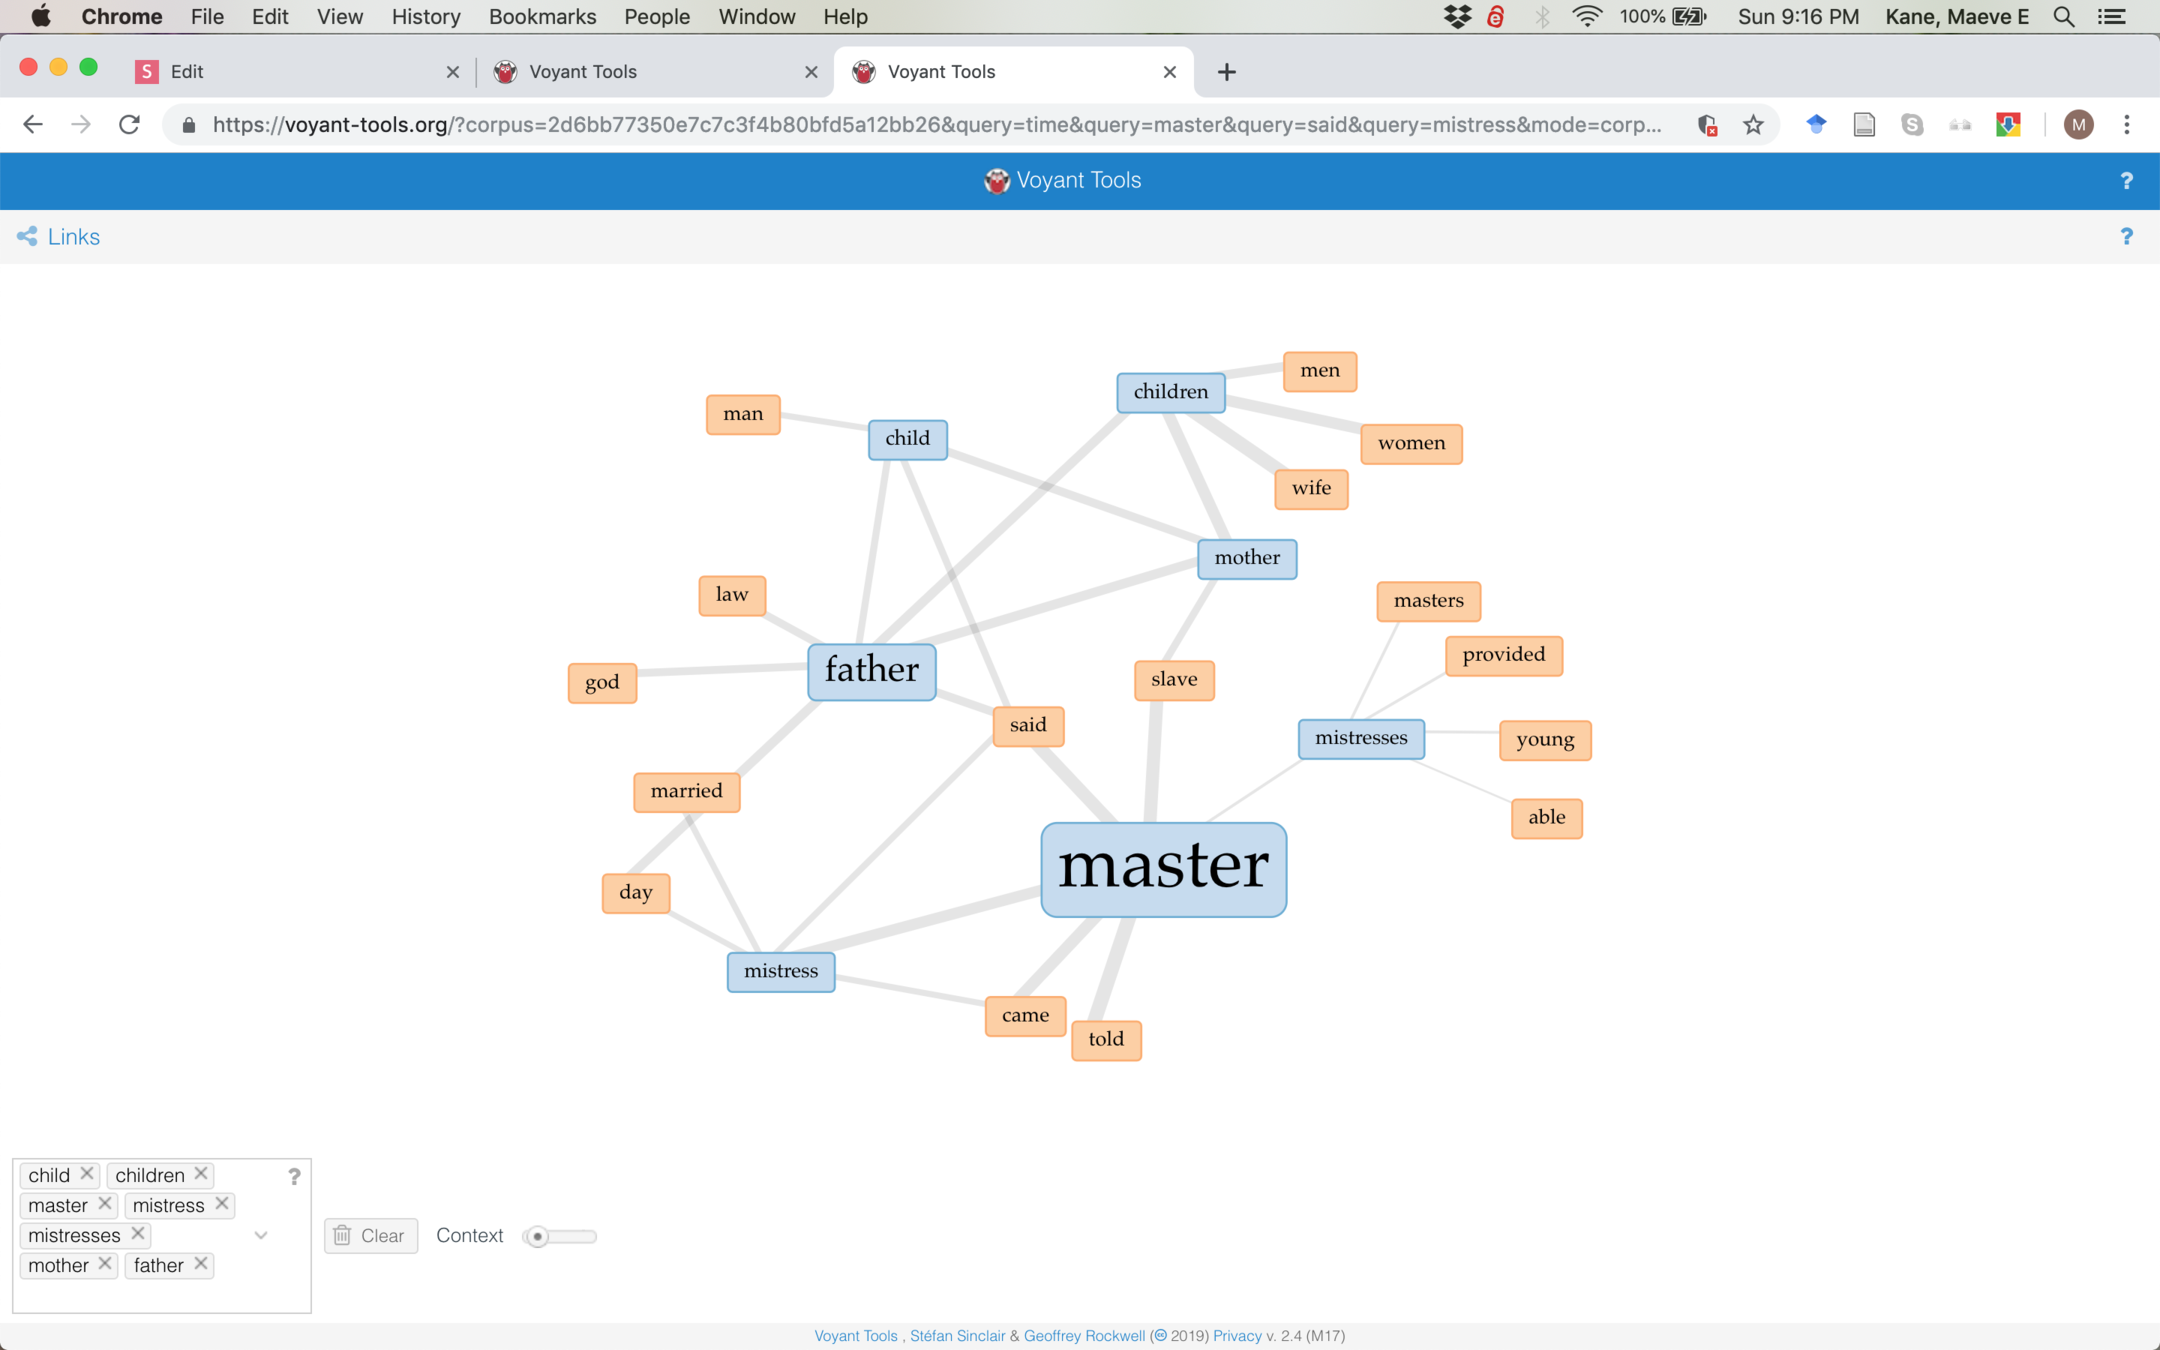
Like Trends, we can search for specific terms and see which (orange) words are frequently associated with them. What could we say about the verbs associated with master vs mistress?
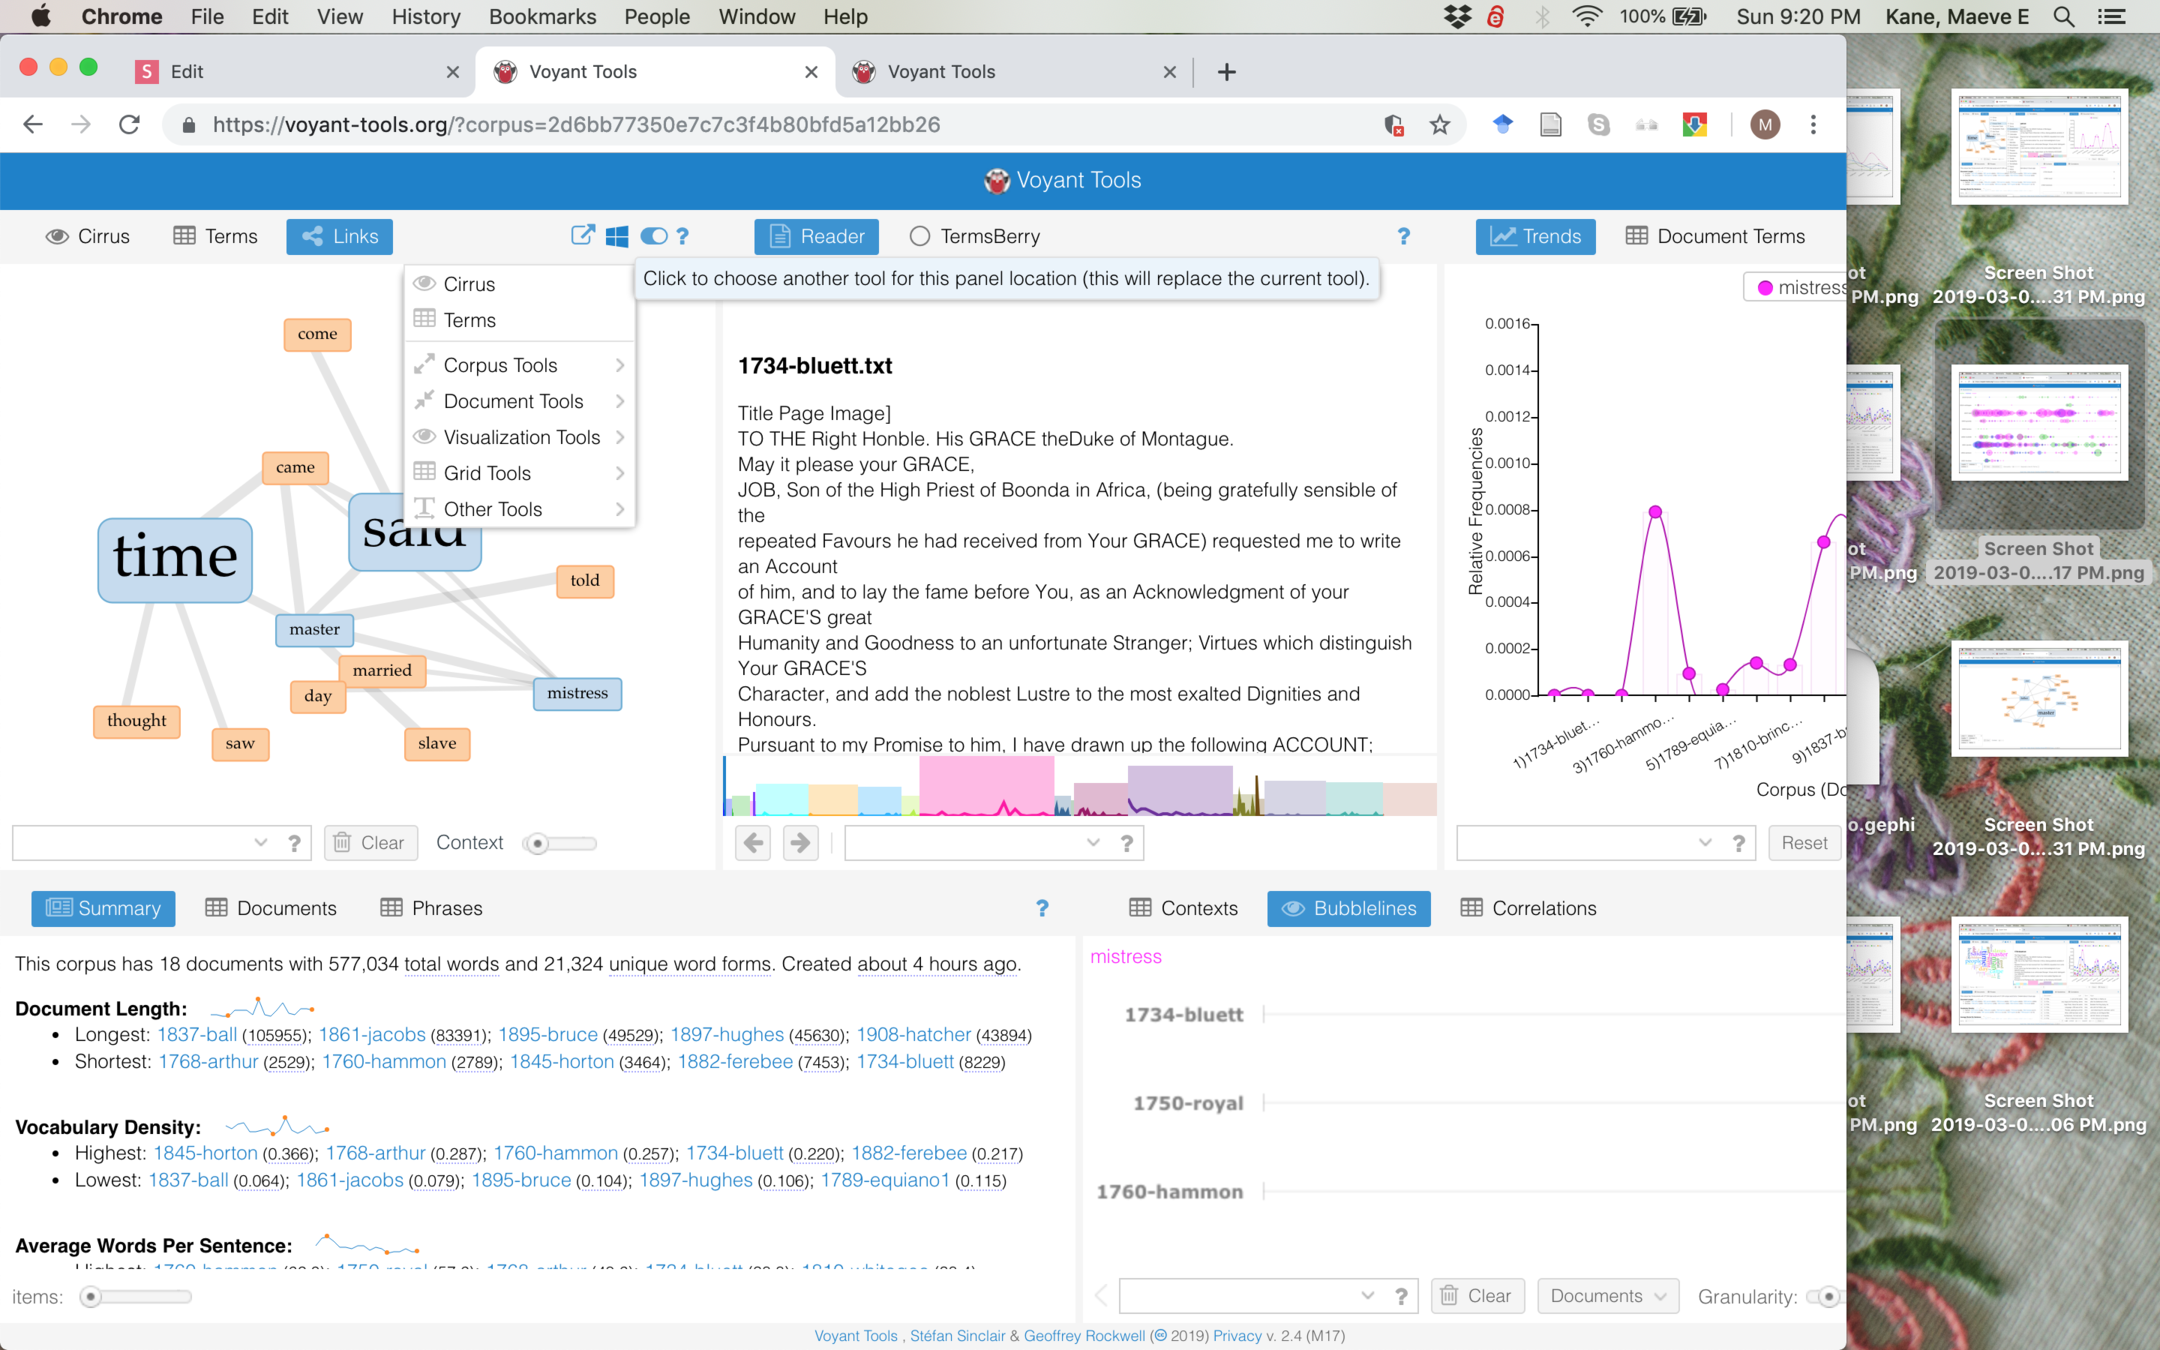
We can choose any analysis tool by selecting from the options that appear by hovering over the question mark. Let's select Bubblines next.
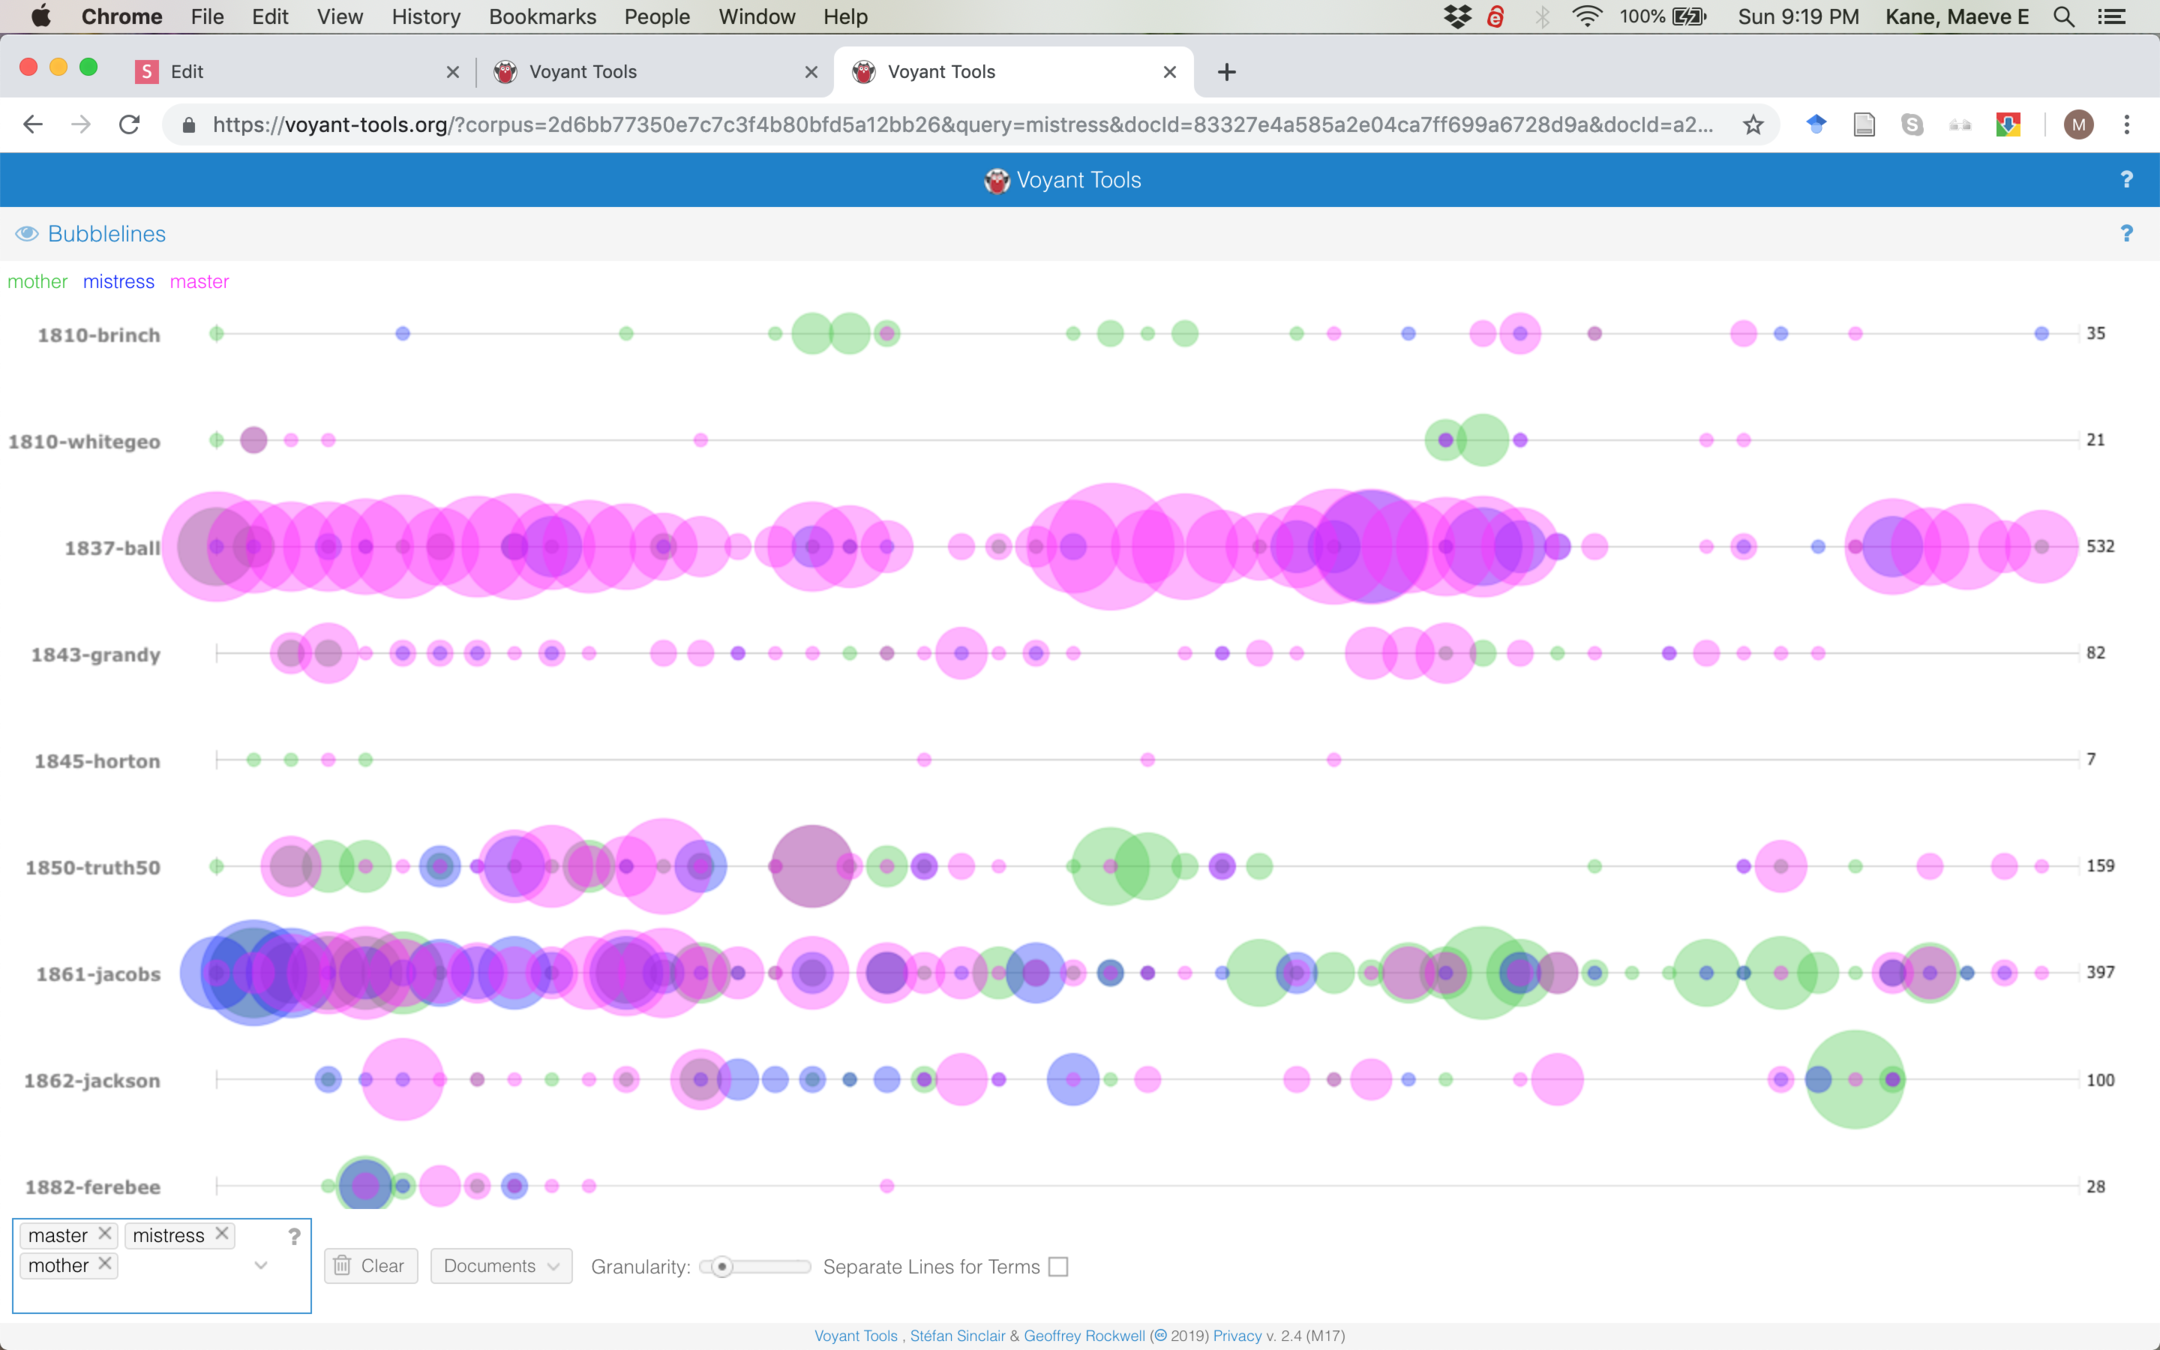
Bubblines shows how frequently different terms occur over the course of a text. What might it mean that in Harriet Jacobs' Incidents in the Life of a Slave Girl, "mistress" is very prominent near the beginning, but "mother" becomes more prominent near the end?
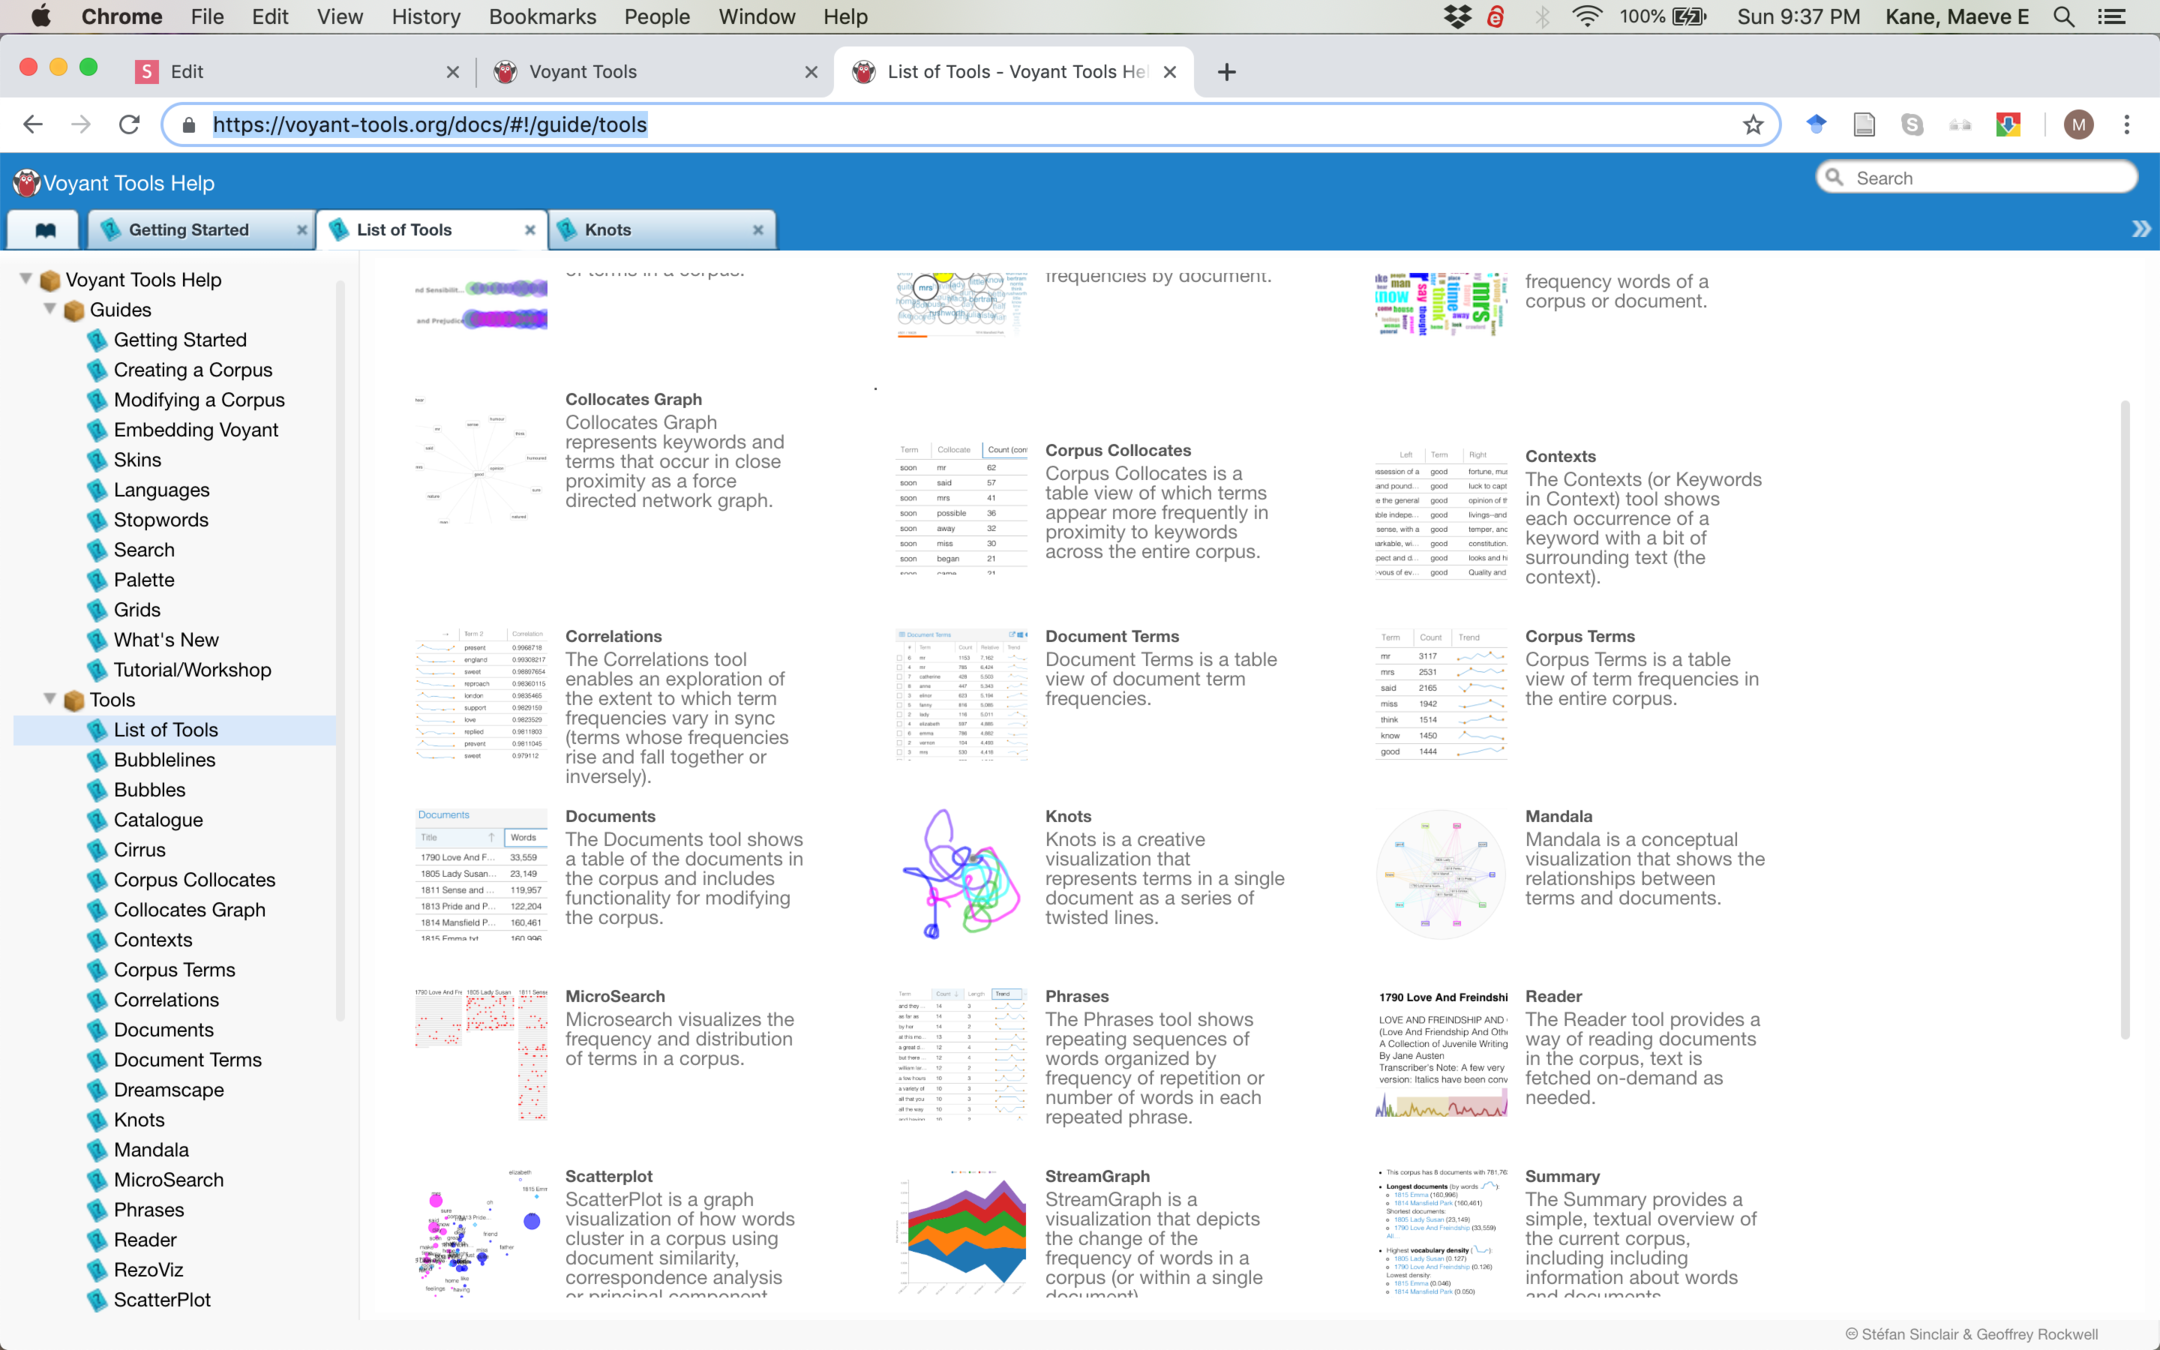
Voyant includes many tools, some of which aren't immediately readable on their own. For some, you'll need to read the documentation to understand what they say about our texts.
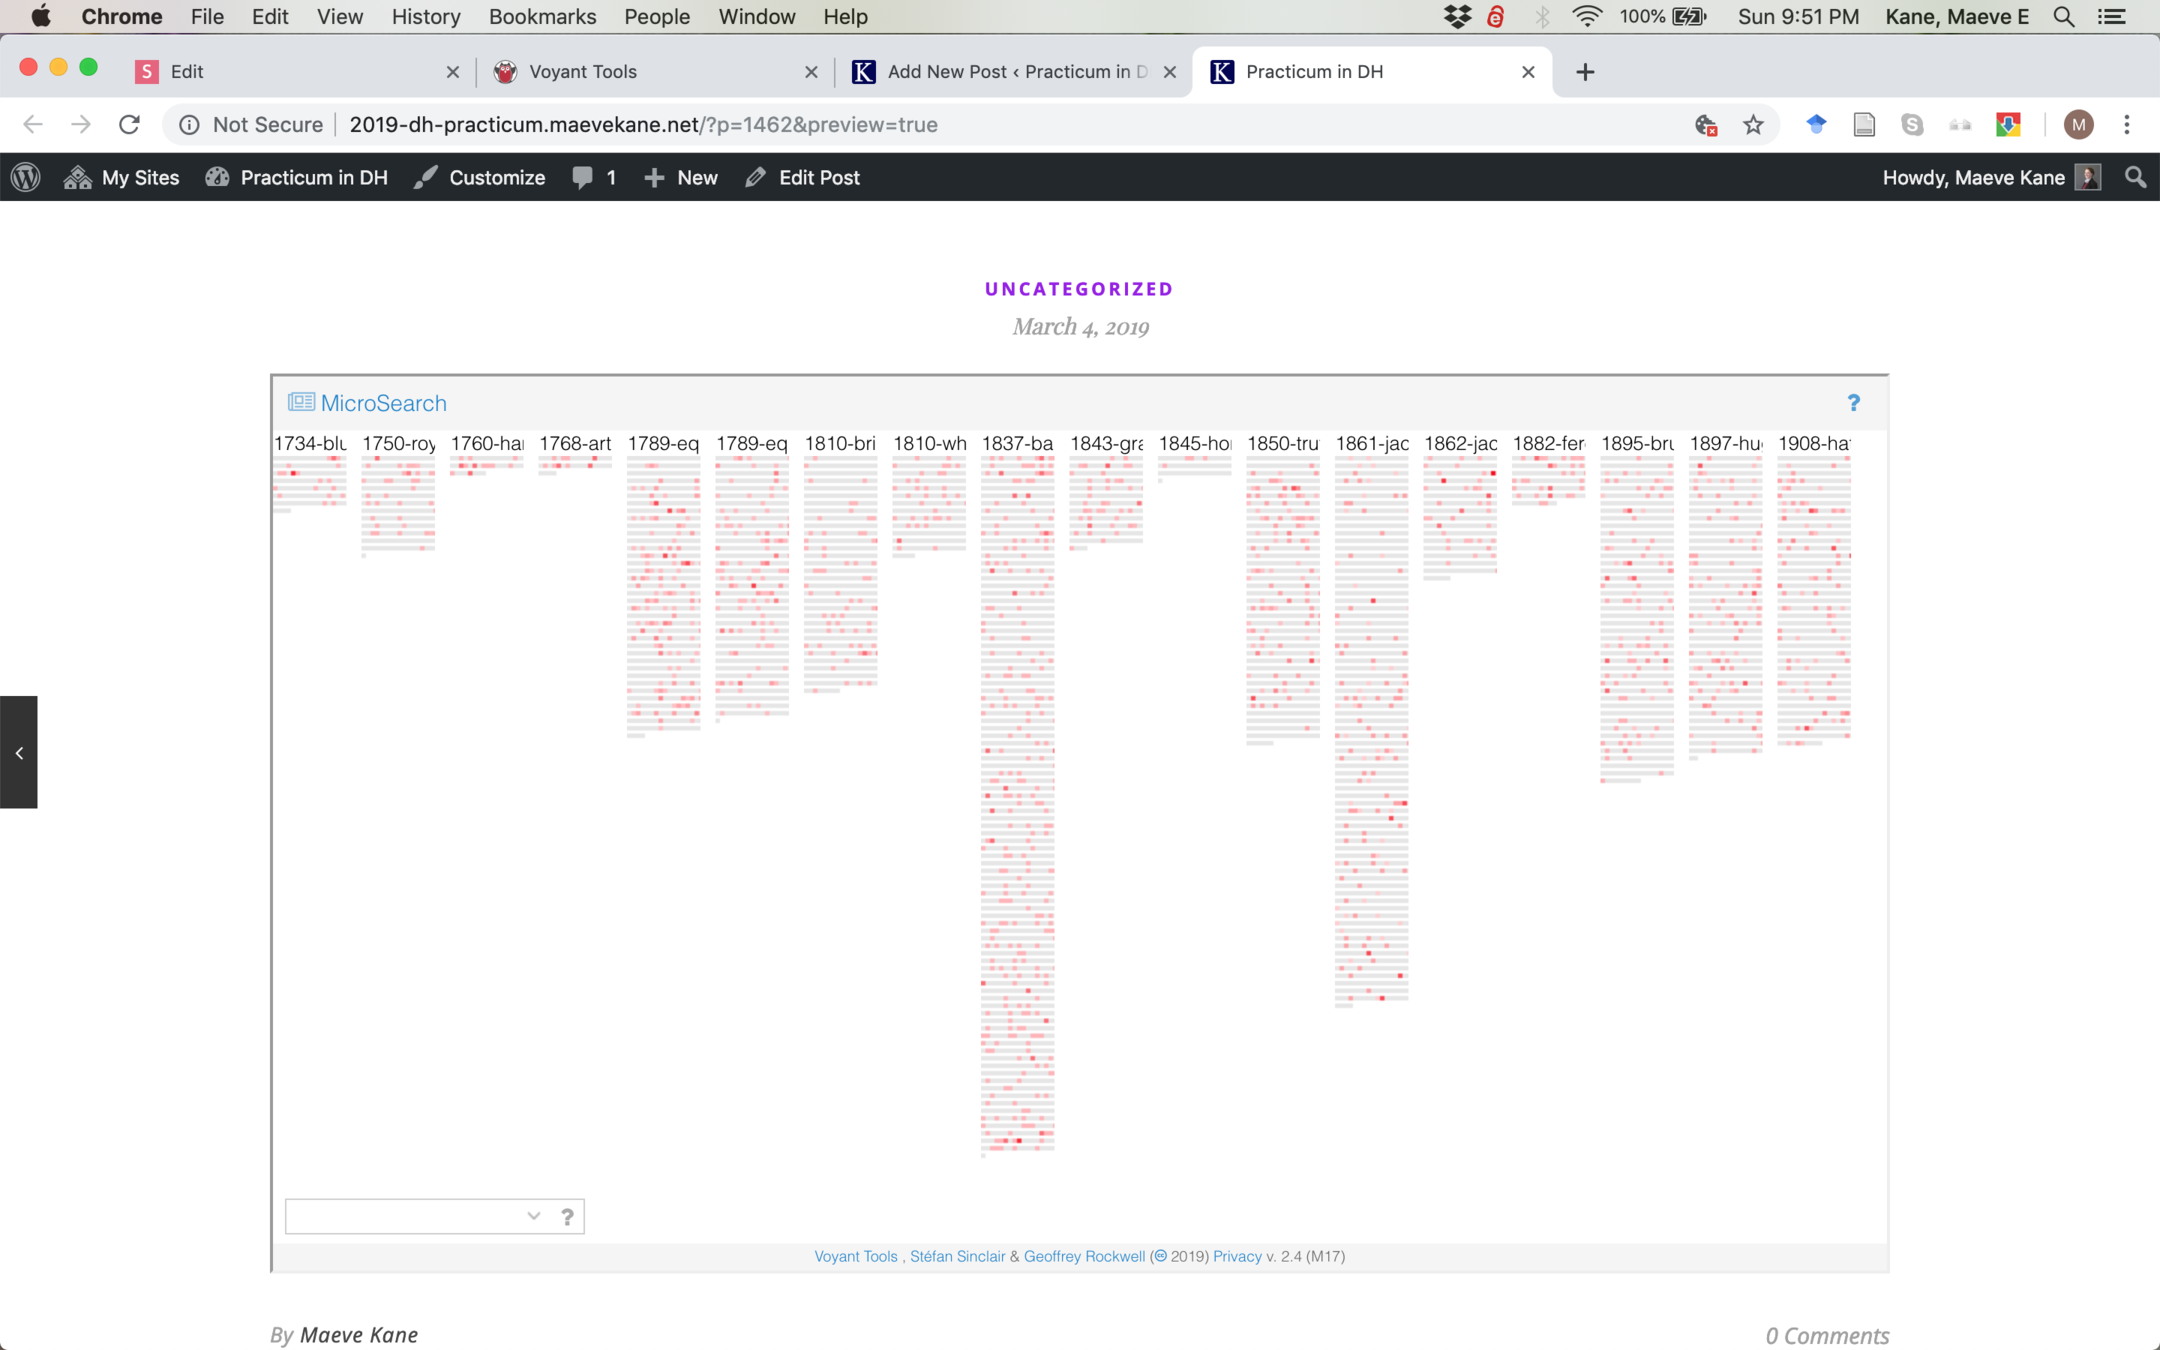
Select at least two tools after reading through the documentation. Productive ones include Loom, Streamgraph, Knots, Microsearch, Scatterplot, and Mandala.
Select a set of 4-6 terms to investigate. Using one of the visualizations covered in this lesson and the two additional tools you've selected, describe how your terms appear in each of your visualizations. What are some additional questions that your visualizations provoke which might be investigated further through close reading?
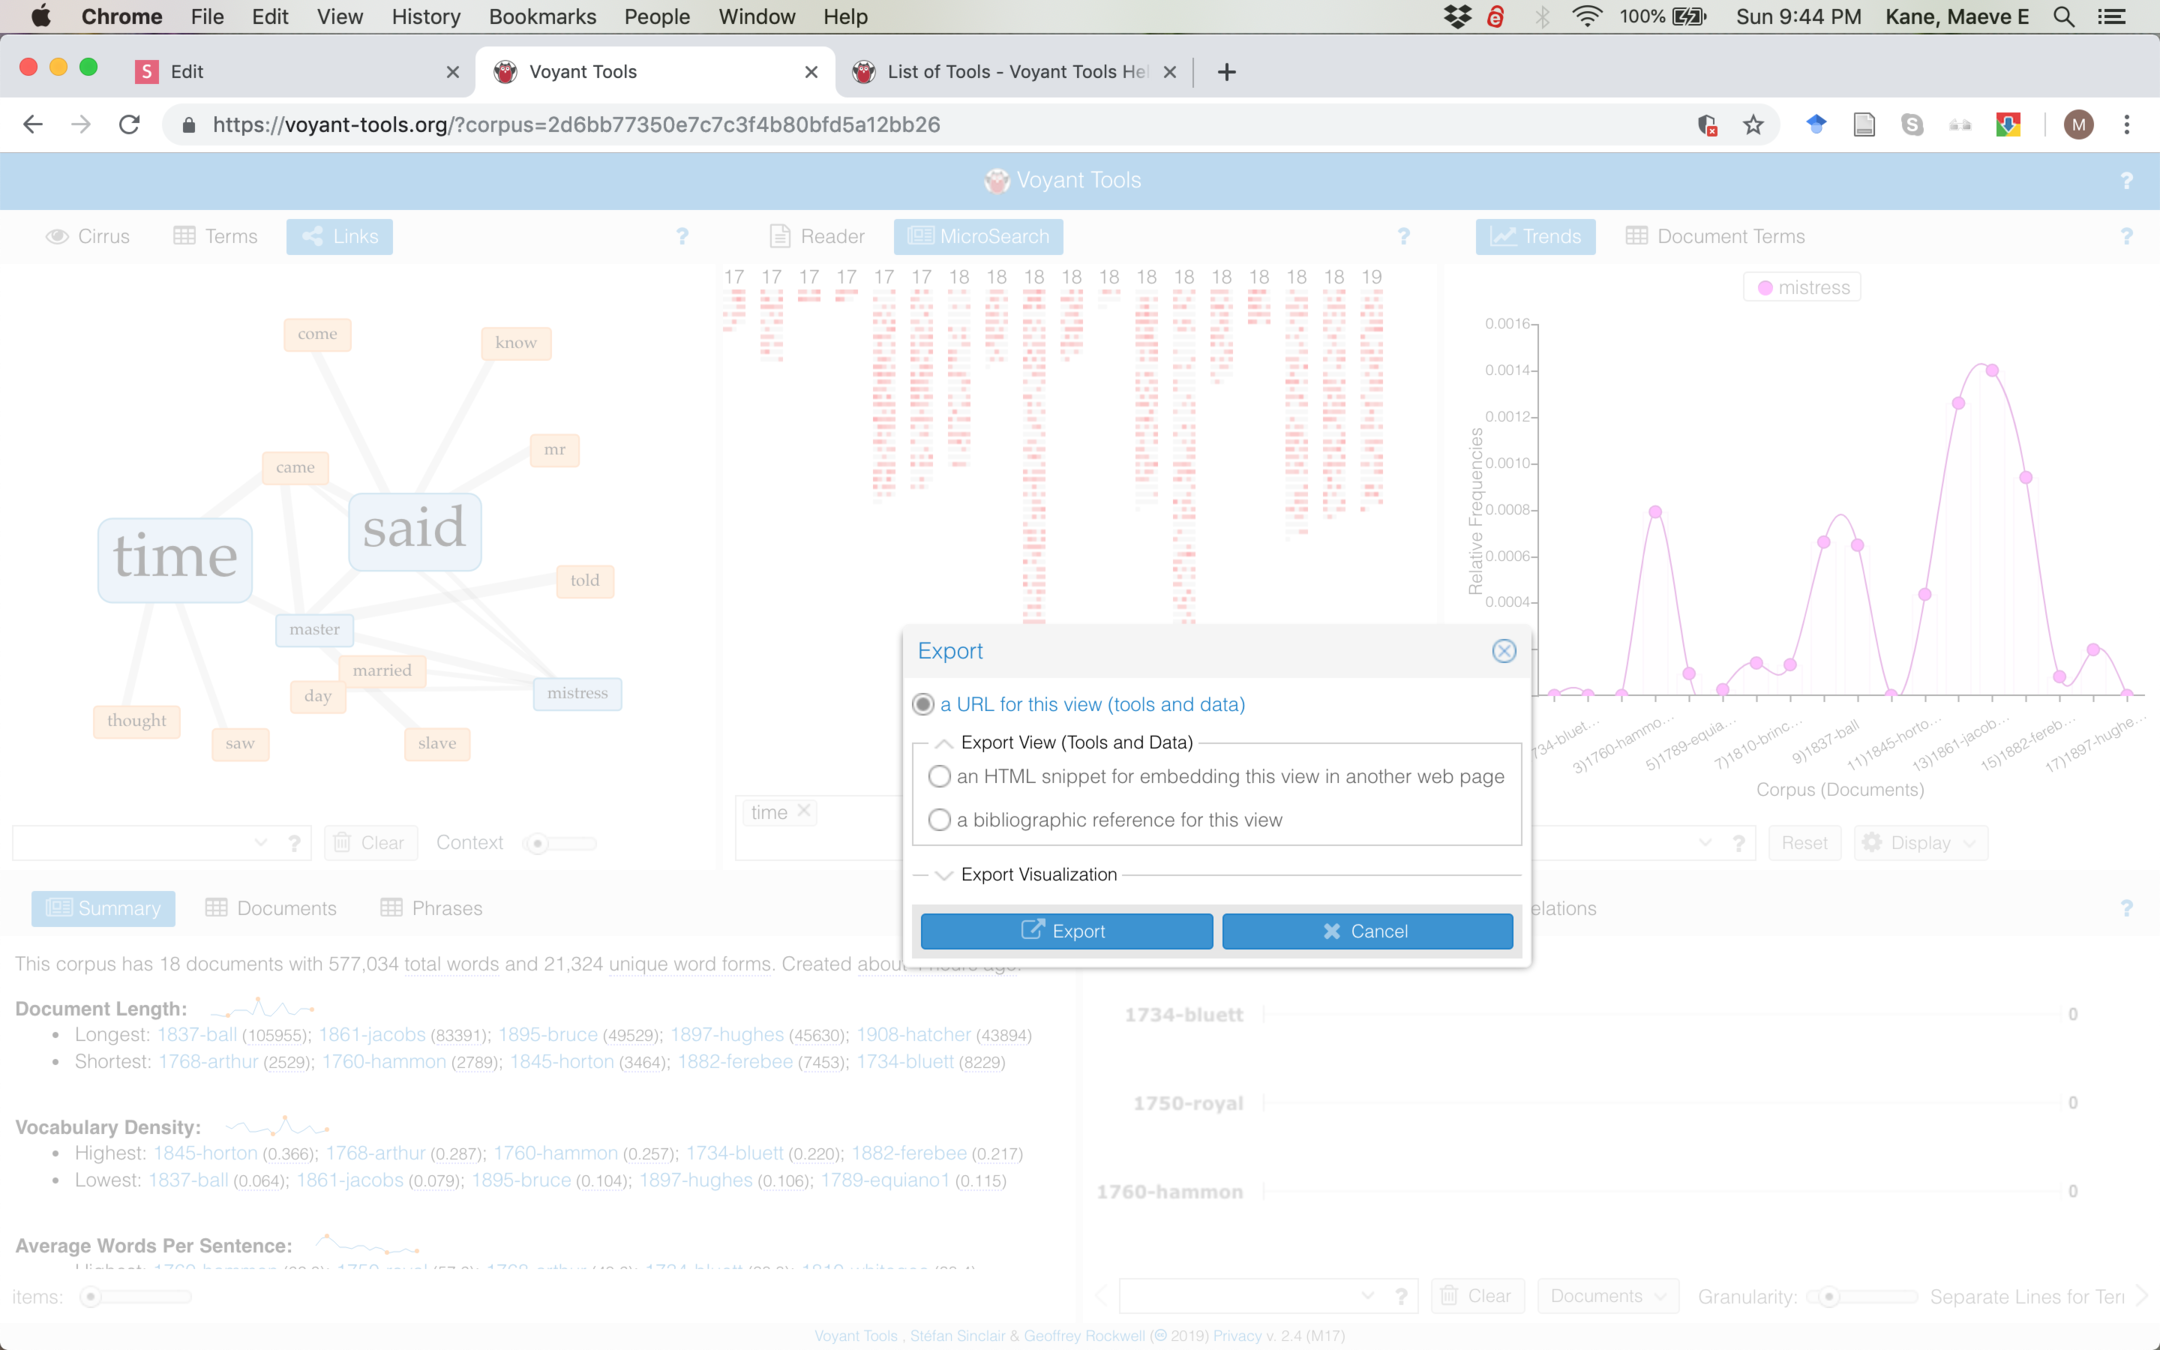
To include your visualizations in your post, hover over the options to export, and select "HTML snippet for embedding"
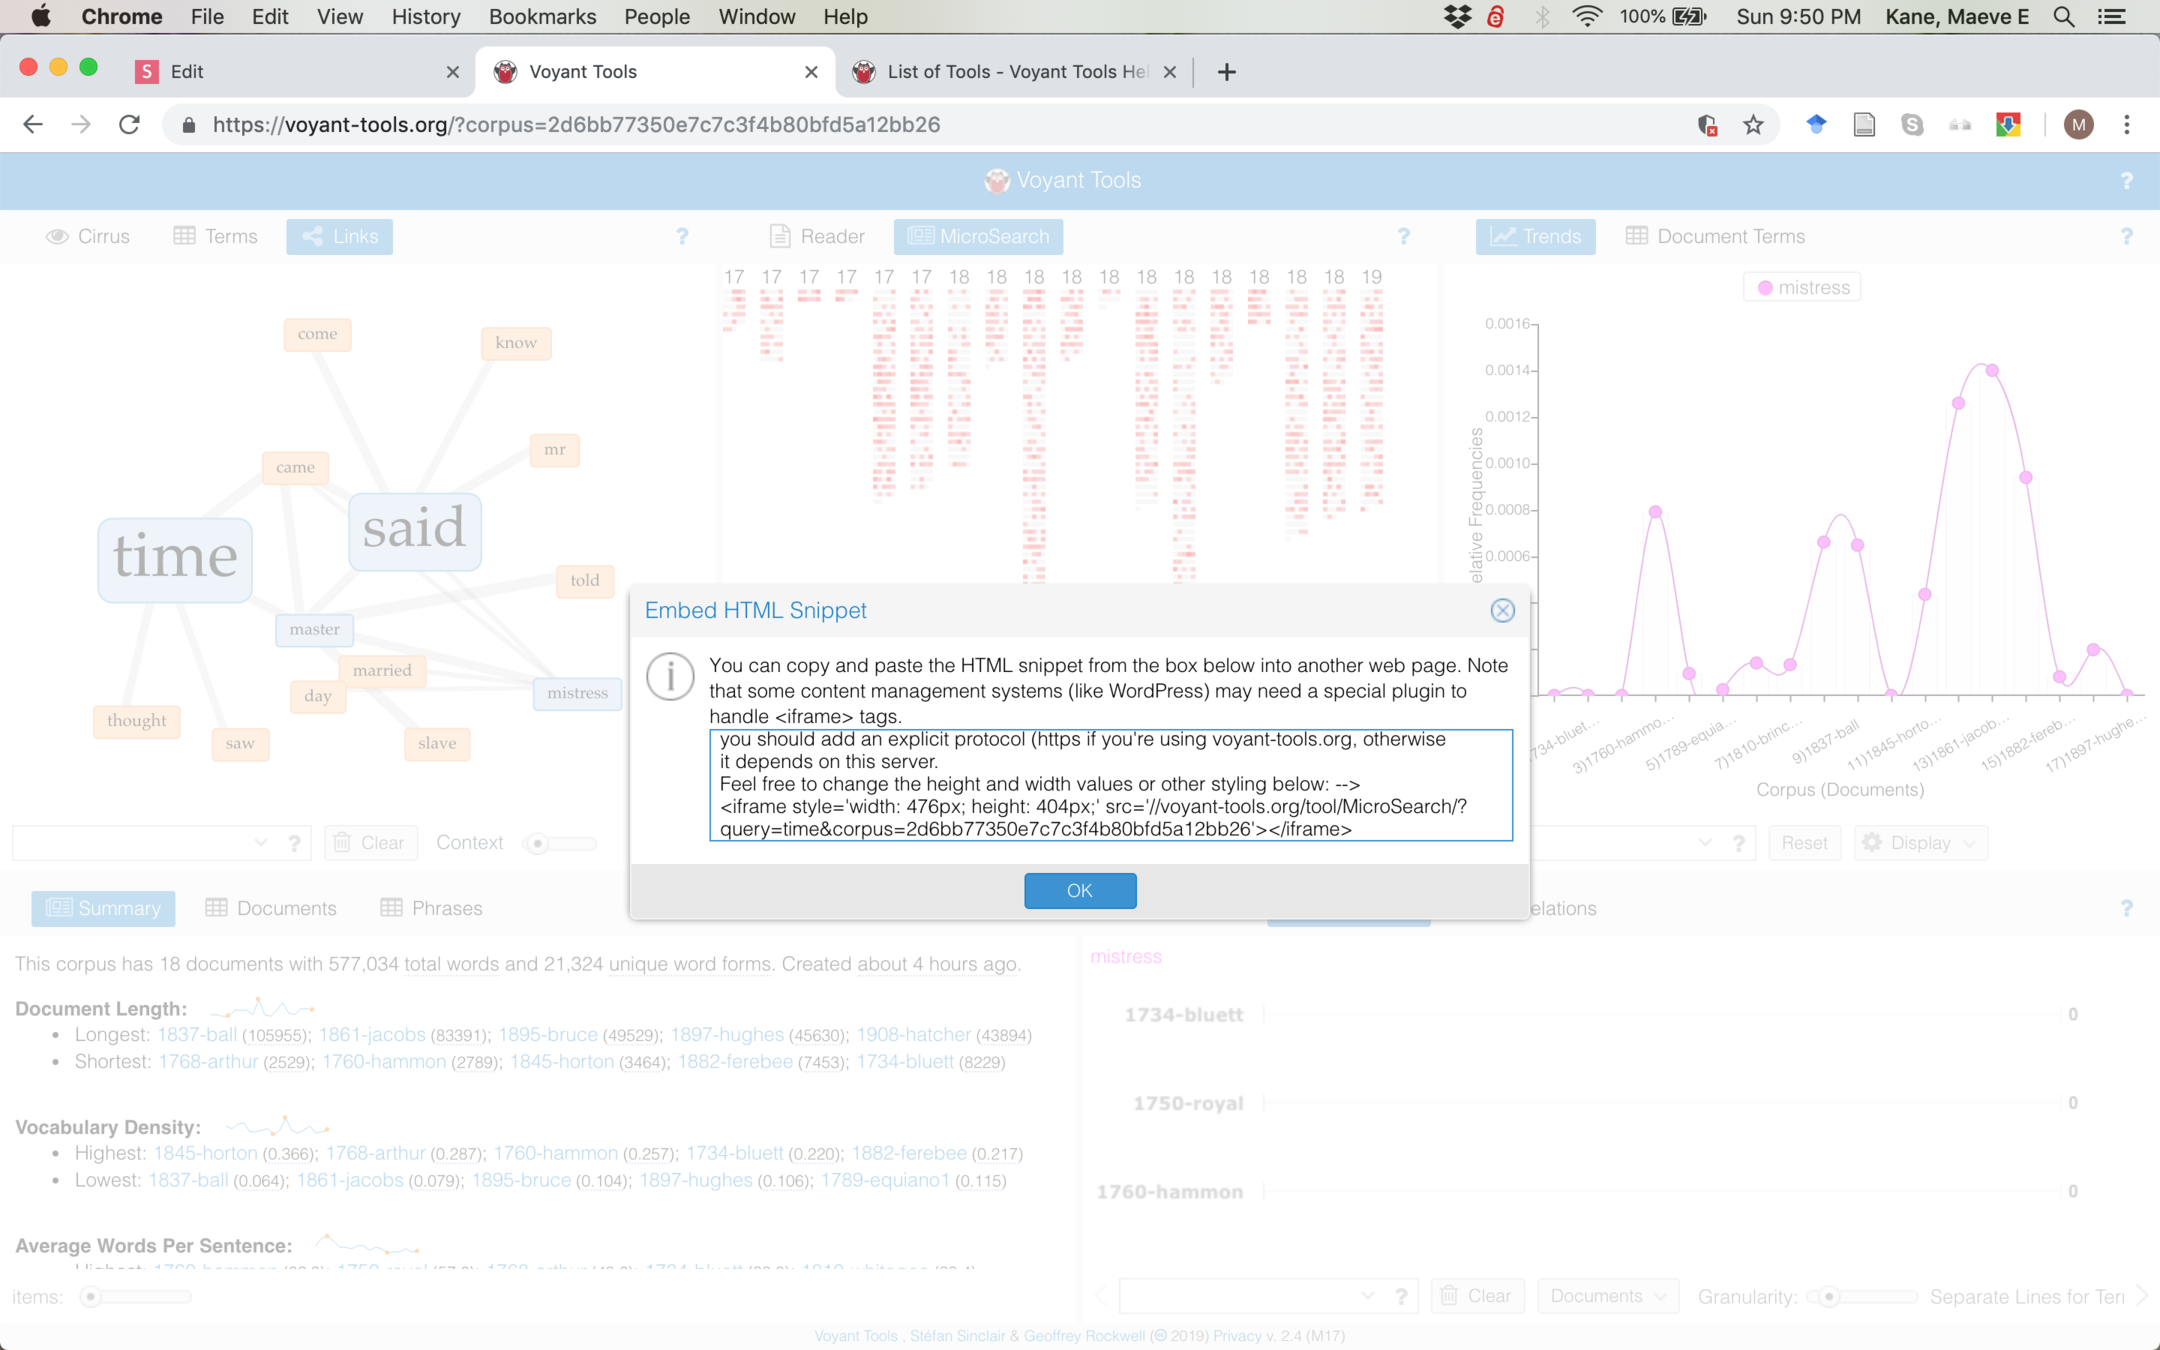
Copy the code for the embed and make a new post on the course blog.
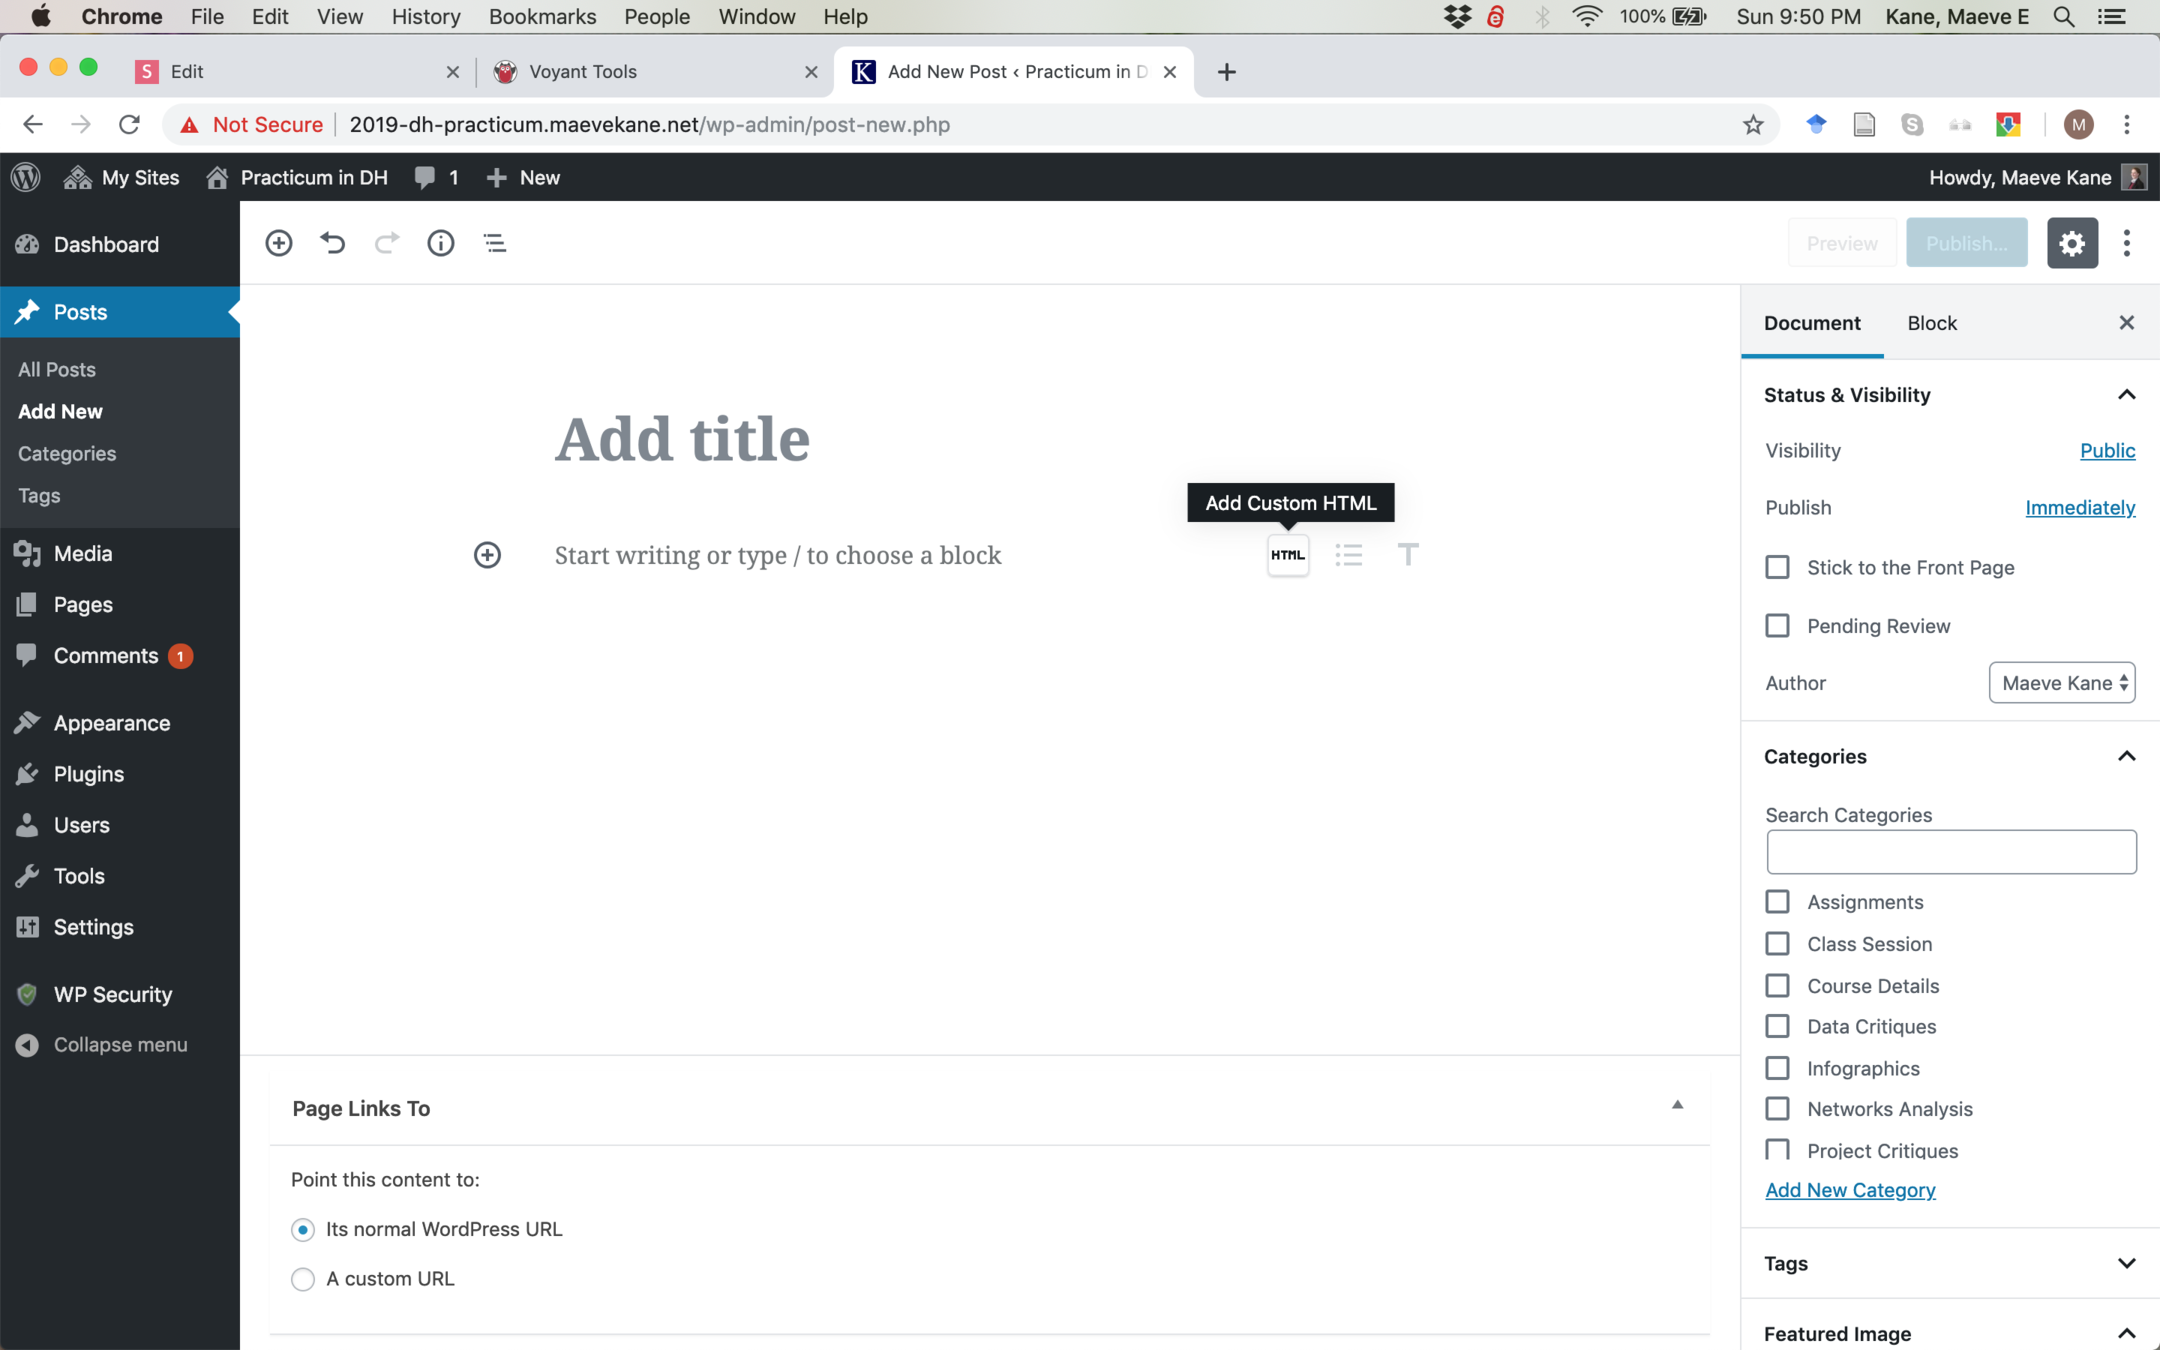
In your post, add a custom HTML block. This is also available by searching for "Custom HTML" with the plus icon to add a new block.
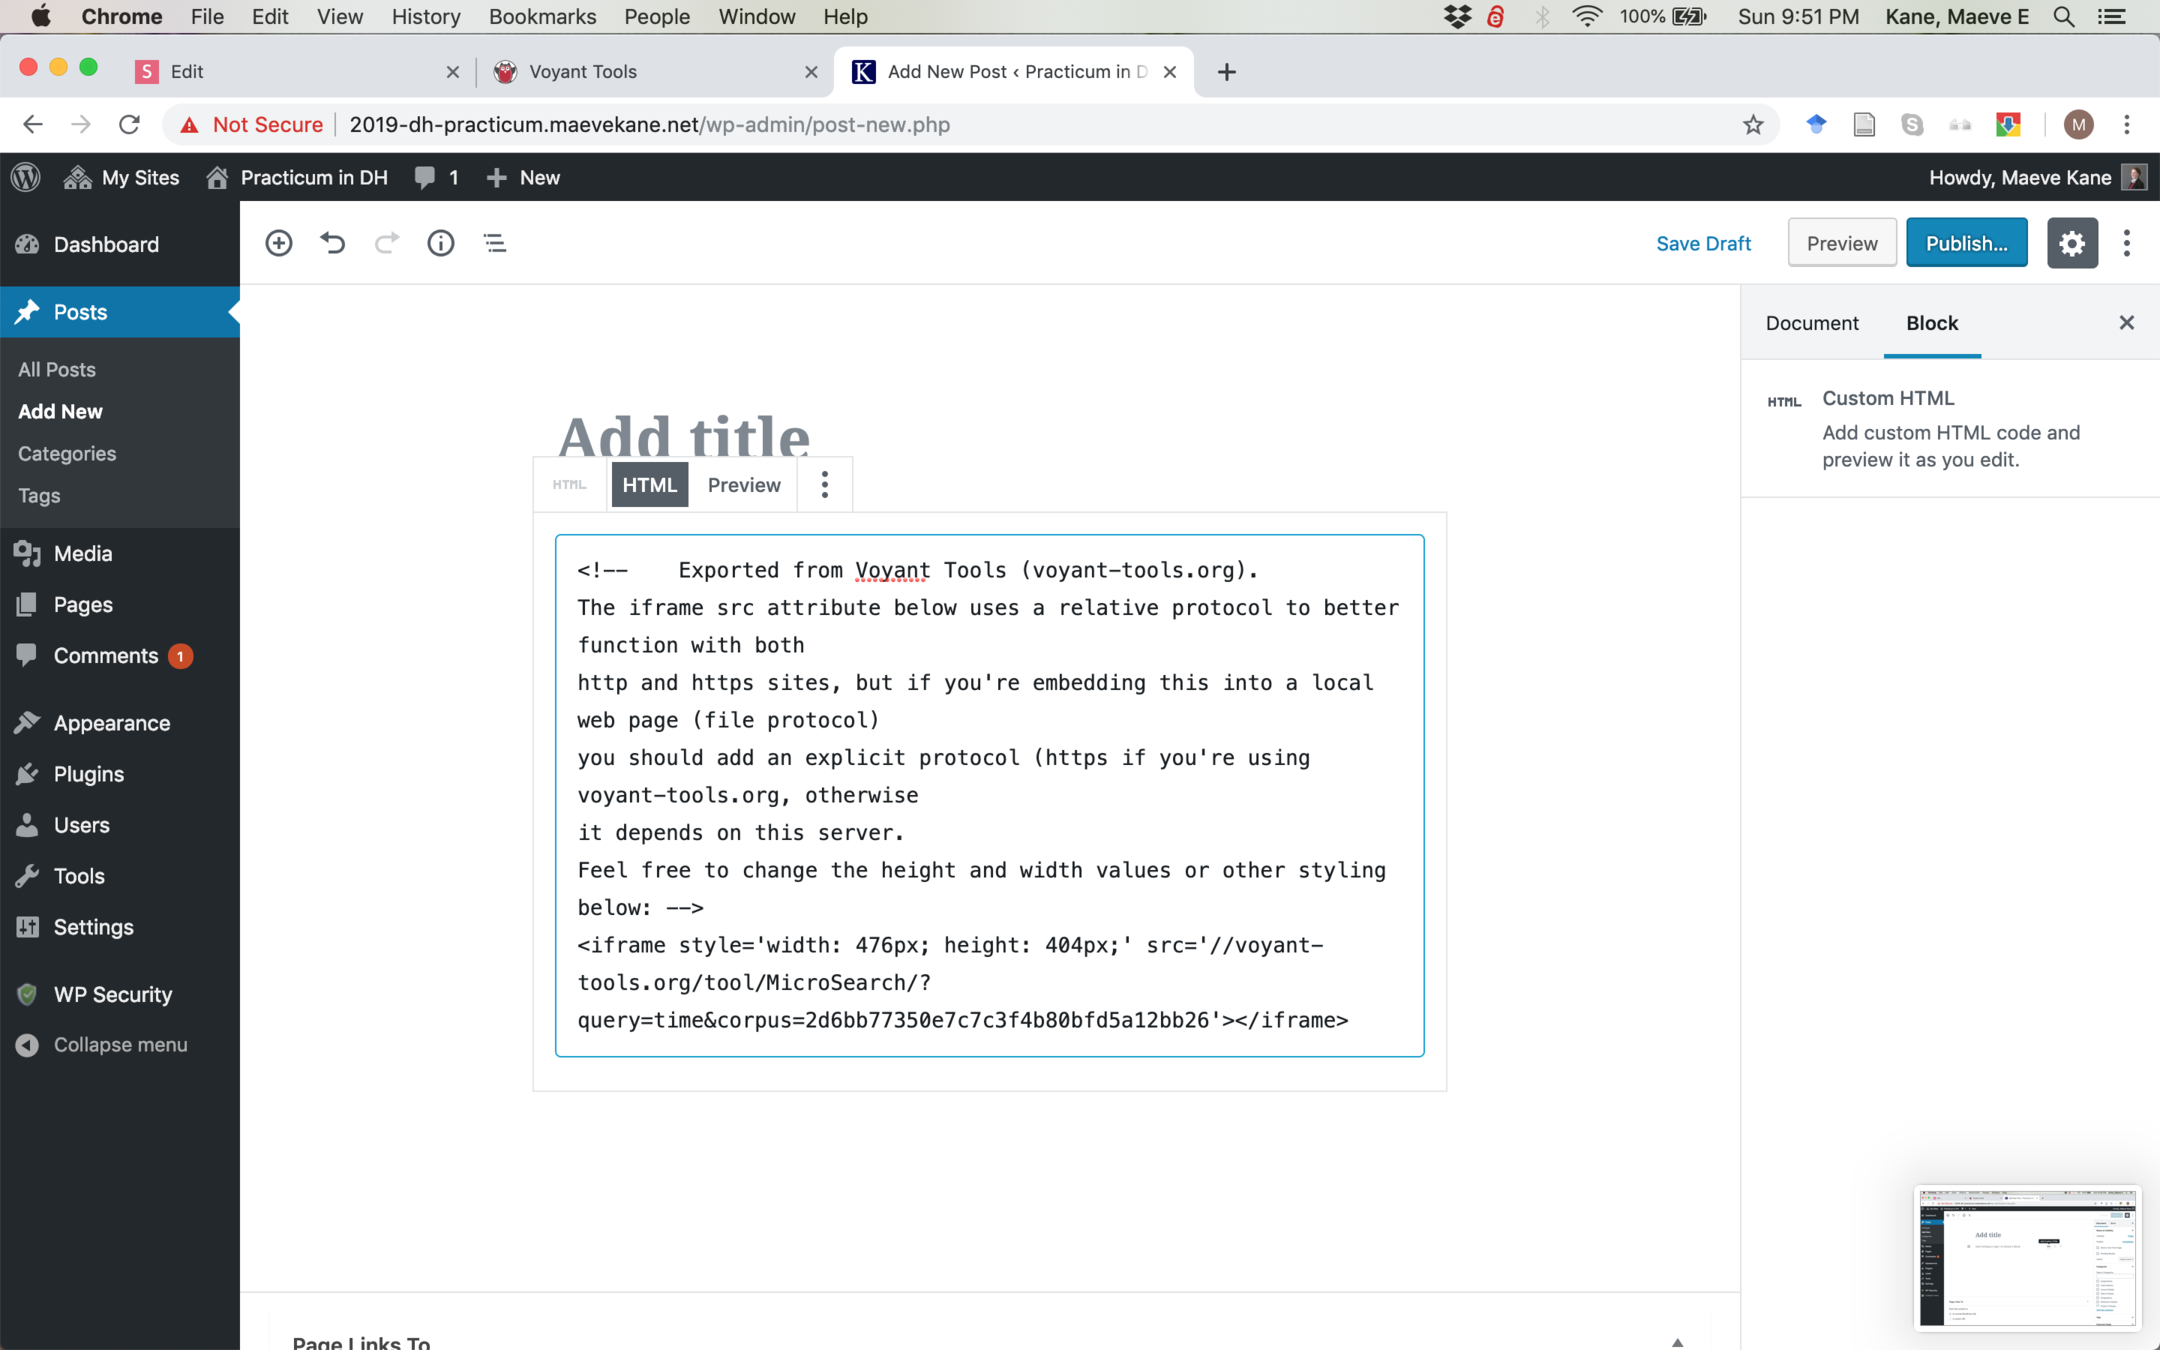
Paste in your code. Make sure to change the style='width: 476px; height: 404px' (or whatever appears for you) to style='width: 100%; height: 600px' If you don't change this, your embed will be a small, strange size.
You can write your text above and below the embed code in different blocks.
After publishing, your embed will be visible and interactive in your post.